-
-
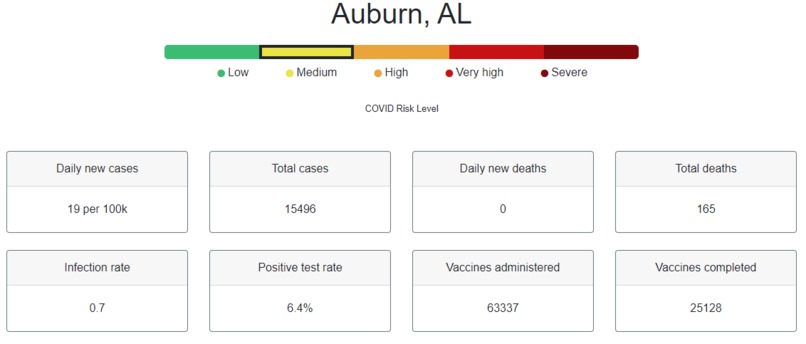
Healthy State Home Screen
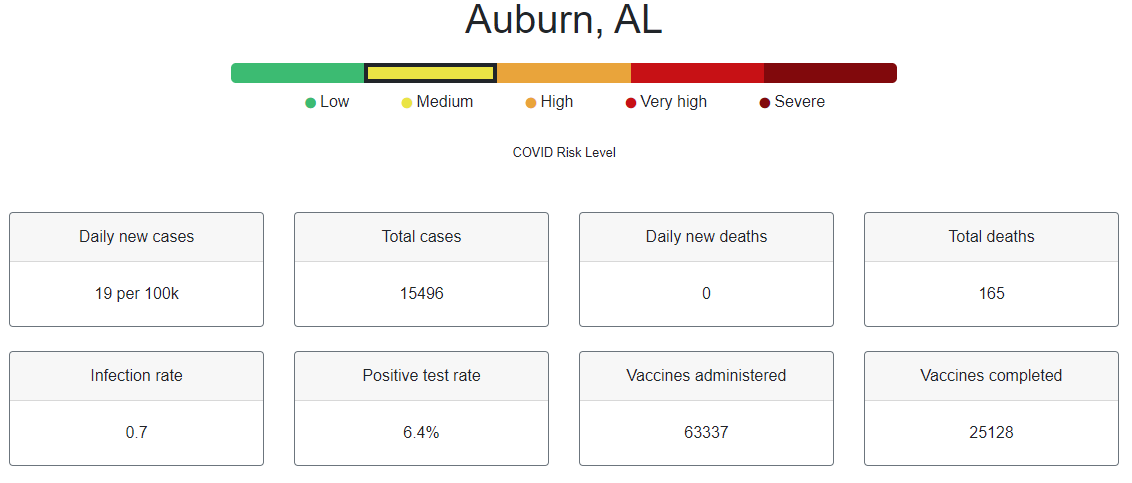
Inspiration
Eagerly awaiting the time we can safely meet each other in person again, we decided to make a website which helps us view the current state of covid19 in our areas. Enter, Healthy State.
What it does
Healthy State is a website which allows us to look at some statistics surrounding covid19 for each state / county in each state. These statistics are then used to give each state / county an overall risk factor score. Here, our goal is to keep a tight look on the spread of covid19, to inform people about the potential risk they could still be in, and to eventually watch the risk factors across all states drop to 0!
How we built it
Healthy State was built with React and Express for the frontend and routing, Google Cloud for making calls to our api, the covidactnow.org api for supplying our covid19 data for each state / county, and the all-the-cities library to get the fips codes for cities entered.
Challenges we ran into
One of the biggest challenges we had faced was getting the right data for the right city. Because of the nature of the way covidactnow's api stores the data, we needed to figure out which county in a state a city belonged to.
Other challenges included, working with google cloud and getting our API up and running. And centering those divs for the frontend.
Accomplishments that we're proud of
It runs without crashing, so we are happy.
One of the biggest accomplishments for our team was being able to work on our front and backends simultaneously with minimal conflicts. This lead to a clean merge of the two halves in our project, minus some of the bugs.
What we learned
Google cloud is a powerful tool which we are most likely going to consider using in the future again.
When in doubt, there is probably an api for that.
React bootstrap is clutch.
What's next for Healthy State
Outside of the present bugs, some good next steps for Healthy State would be to track the information and display it through different forms. Maybe we track the data overtime and show the percent increase / decrease we are currently seeing. Maybe we add some graphs to spice up the webpage itself.
How to use it
You can search a states statistics using the 2 letter representation of the state (EX: WA, CO, AL, CA, etc.) You can search a specific city by typing the name of the city followed by the 2 letter representation of the state (EX: Auburn, AL)
If the data doesn't change, chances are we do not have data for that city and or state.
Built With
- all-the-cities-library
- bootstrap
- covidactnow-api
- express.js
- google-cloud
- html/css
- javascript
- node.js
- react


Log in or sign up for Devpost to join the conversation.