-
-
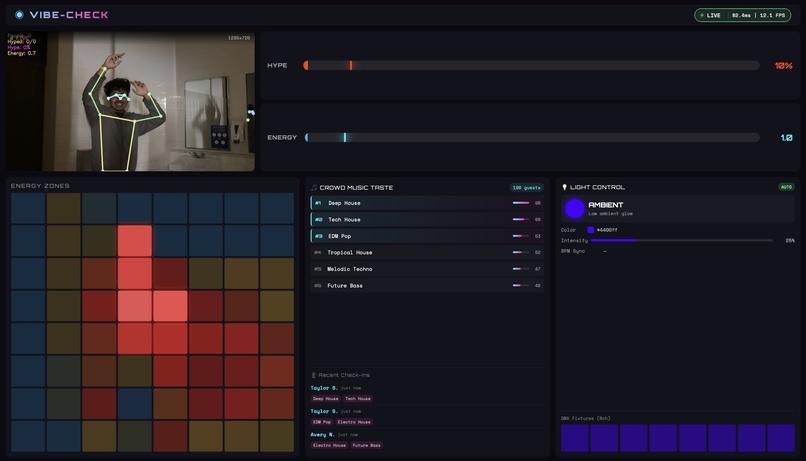
Full dashboard: Heatmap (bottom left), Hype/Energy(top right), Genre Rank(bottom mid), Light Sync (bottom right)
-
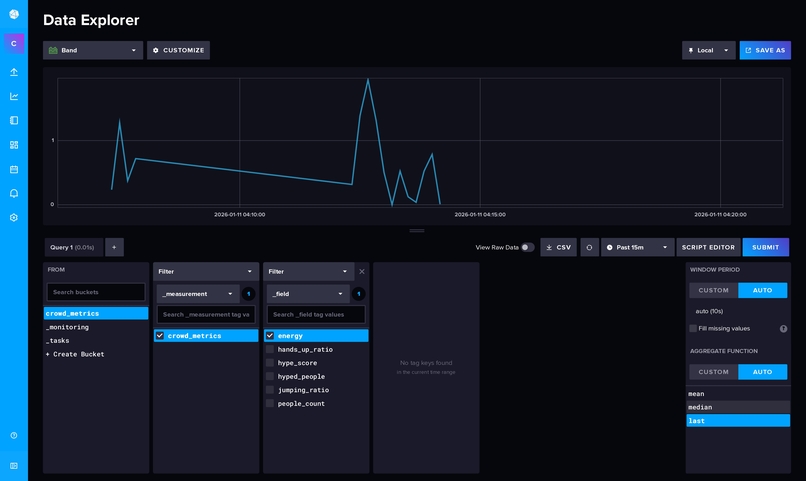
InfluxDB data graph: energy levels by time stamps
-

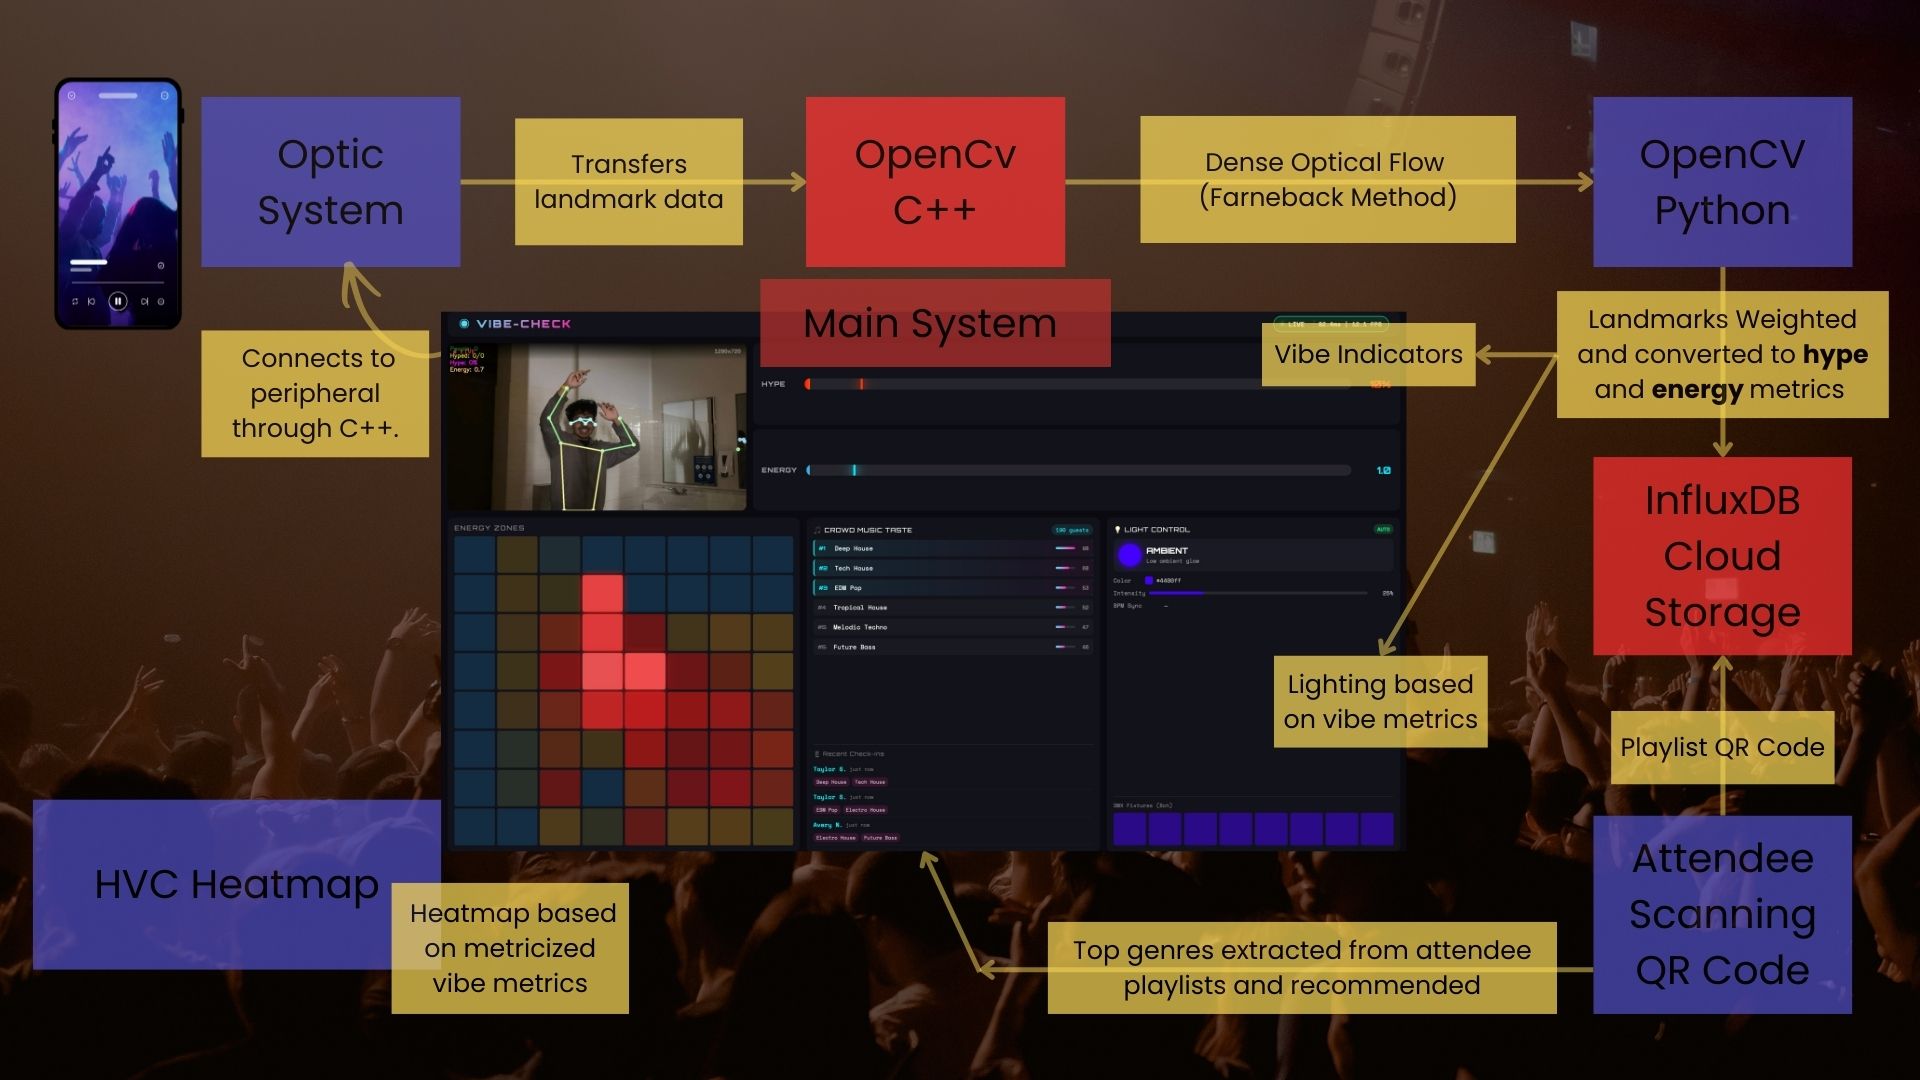
System Design Overview

Inspiration
What inspired us was multiple negative experiences at events and parties where the DJ was not able to read the room correctly.
What it does
Our goal is to accurately provide the DJ/manager with real-time data about energy levels in the crowd, where, in the frame of reference, the crowd is more "hype", and to sync different processes based on crowd engagement and preference. One of these features includes accessing attendees' Spotify data with their permission to extract crowd favorite genres, which are ranked in real-time by popularity. Another important feature we chose to integrate was synchronizing lights in a venue to match the energy levels of the crowd.
How we built it
We built Vibe Check by starting from the core of our project, which was optical flow tracking with OpenCV. We ran this and tested its accuracy in low-light settings to assess its feasibility with our vision. Then, we worked to extract the intensity of movements from the Farneback optical flow method so that we could vectorize each pixel in successive frames and measure movement. After this, we added weights so that we could calculate a real score for hype and energy levels. Then, we split the frame into a grid and figured out where in the grid energy movement was coming from. This allowed us to create a heatmap of energy in the frame. To display this, we built a React user interface and used WebSocket to host it seamlessly on our local machine. We then connected this data to an InfluxDB database in which we could store energy levels by timestamp and per frame for later use. From here, we brainstormed additional features to add. For example, we thought to add a feature that allows attendees to scan a QR code and then give permission to access their Spotify listening data in exchange for a voucher of sorts. We showed this as a proof of concept on our Vibe Check dashboard by simulating a demo stream of check-ins and popular genre rankings for the DJ to adapt to. Another feature we thought to demonstrate was integrating the energy level with venue lighting systems so that they can adapt accordingly.
Challenges we ran into
The main challenge we ran into was figuring out the weights for different movements and crowd sizes. This required a lot of calibration and testing because we continuously ran into misleading energy outputs. We continued testing amongst ourselves as well as with other hackers to get their feedback on how realistic our energy calculations were. Another challenge we ran into was when adding a potential new feature. We thought to access attendees' accelerometer data from their mobile phones to measure movement, but we quickly realized this would be inaccurate and cumbersome, which caused us to pivot and solely rely on computer vision.
Accomplishments that we're proud of
The biggest thing that we are proud of is properly integrating the grid-based heat map. Another accomplishment that really put a smile on our faces was simulating check-ins from attendees and updating the genre ranking in real-time.
What we learned
We learned a lot about the math behind Fernback's optical flow algorithm, as we really wanted to understand how it works at a core level before implementing it. Another important thing we learned was how to integrate code in multiple languages that are chosen specifically for certain tasks.
What's next for Vibe Check
We have many real-world plans to improve our current version. We would like to first test our dashboard with larger crowds in real-world settings by splitting the area into grid squares and having multiple cameras processing the live feed. Additionally, we want to expand our genre rank feature into a full, viable product.


Log in or sign up for Devpost to join the conversation.