Inspiration
Geomagnetic storms are a reminder that some of the most significant threats to technological infrastructure originate beyond Earth. Severe disturbances in Earth's magnetic field can affect satellite operations, navigation systems, radio communications, and electrical power infrastructure.
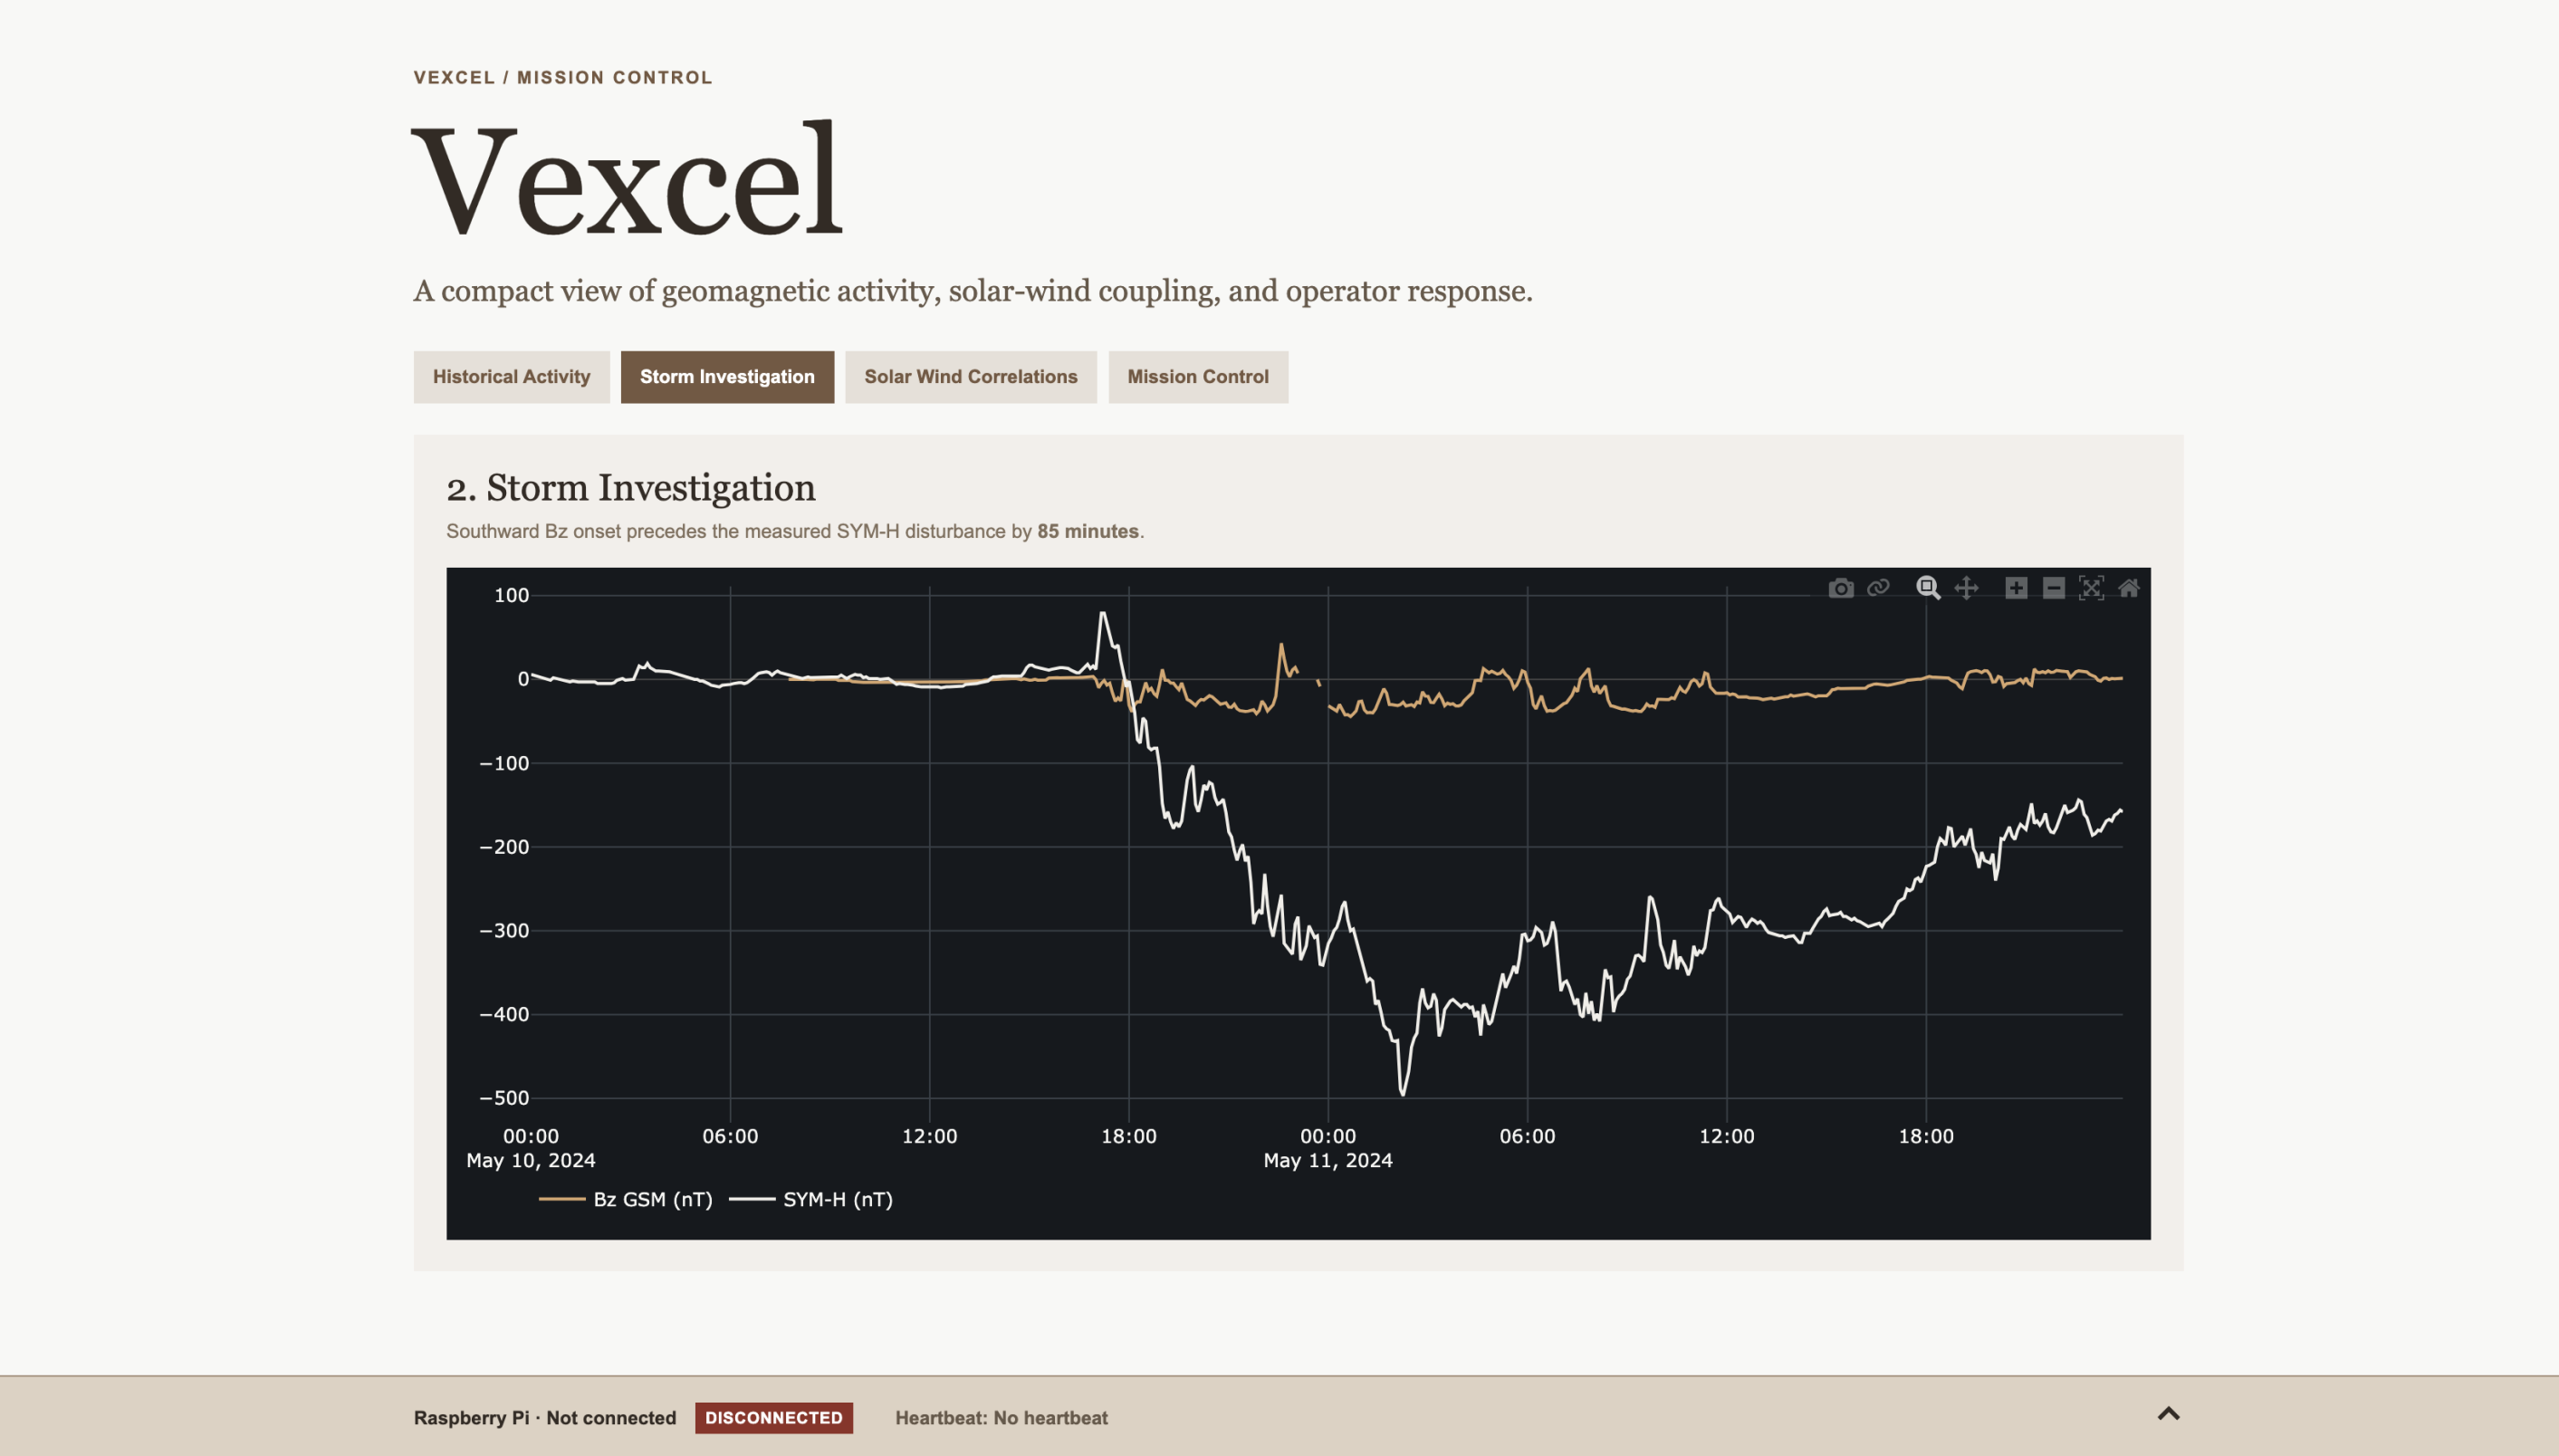
We were inspired by the May 10–11, 2024 Gannon Superstorm, one of the most significant geomagnetic storms in recent history. We wanted to explore how solar-wind measurements could help operators understand developing space-weather events and make better-informed operational decisions.
Our goal was to go beyond displaying scientific data in conventional charts. We wanted to create an interactive space-weather analytics platform that combines historical investigation, telemetry replay, early-warning indicators, and a physical hardware interface inspired by real mission-control environments.
What it does
Vexcel is an interactive Space Weather Analytics Hub and Mission Control system designed to investigate geomagnetic storms and demonstrate how space-weather telemetry can support operational awareness.
It uses NASA OMNI five-minute solar-wind and geomagnetic observations to investigate the relationship between interplanetary magnetic field (IMF Bz), solar-wind conditions, and geomagnetic activity measured by SYM-H and AE.
Vexcel provides three primary analytical capabilities:
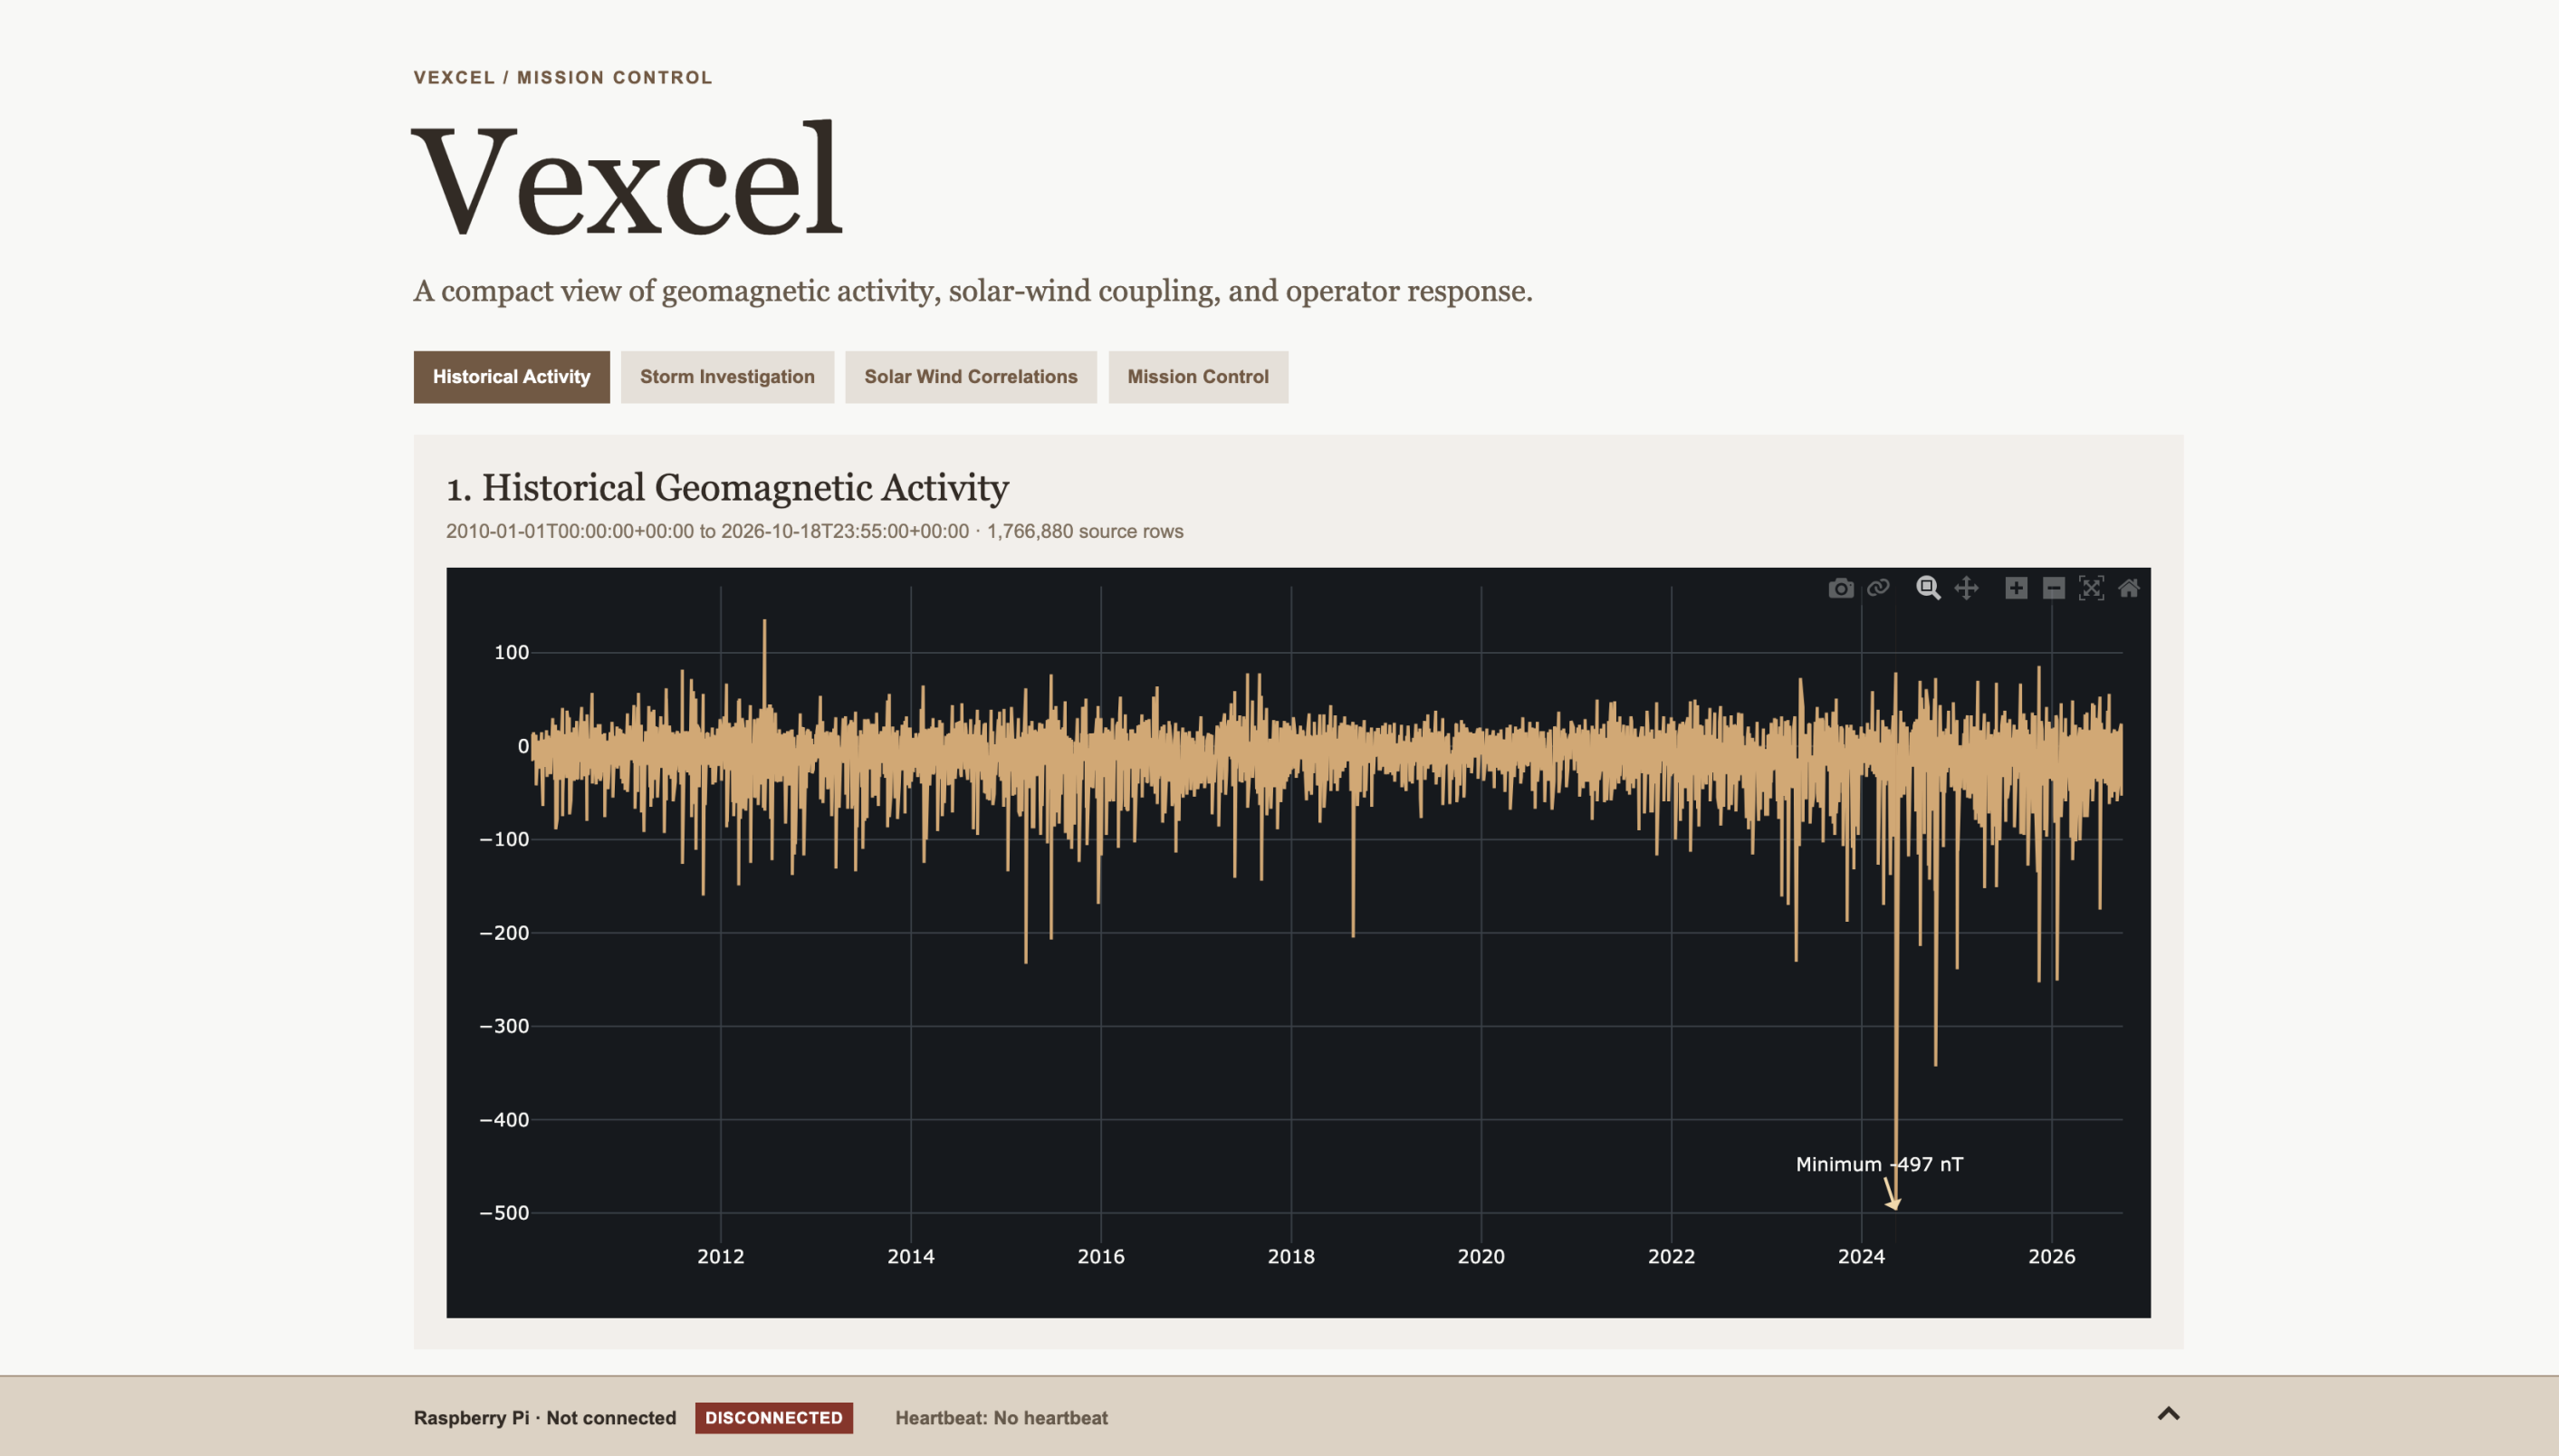
- Historical space-weather analytics: Explores the 2010–2026 SYM-H timeline, highlighting significant geomagnetic disturbances and the May 10–11, 2024 Gannon Superstorm.
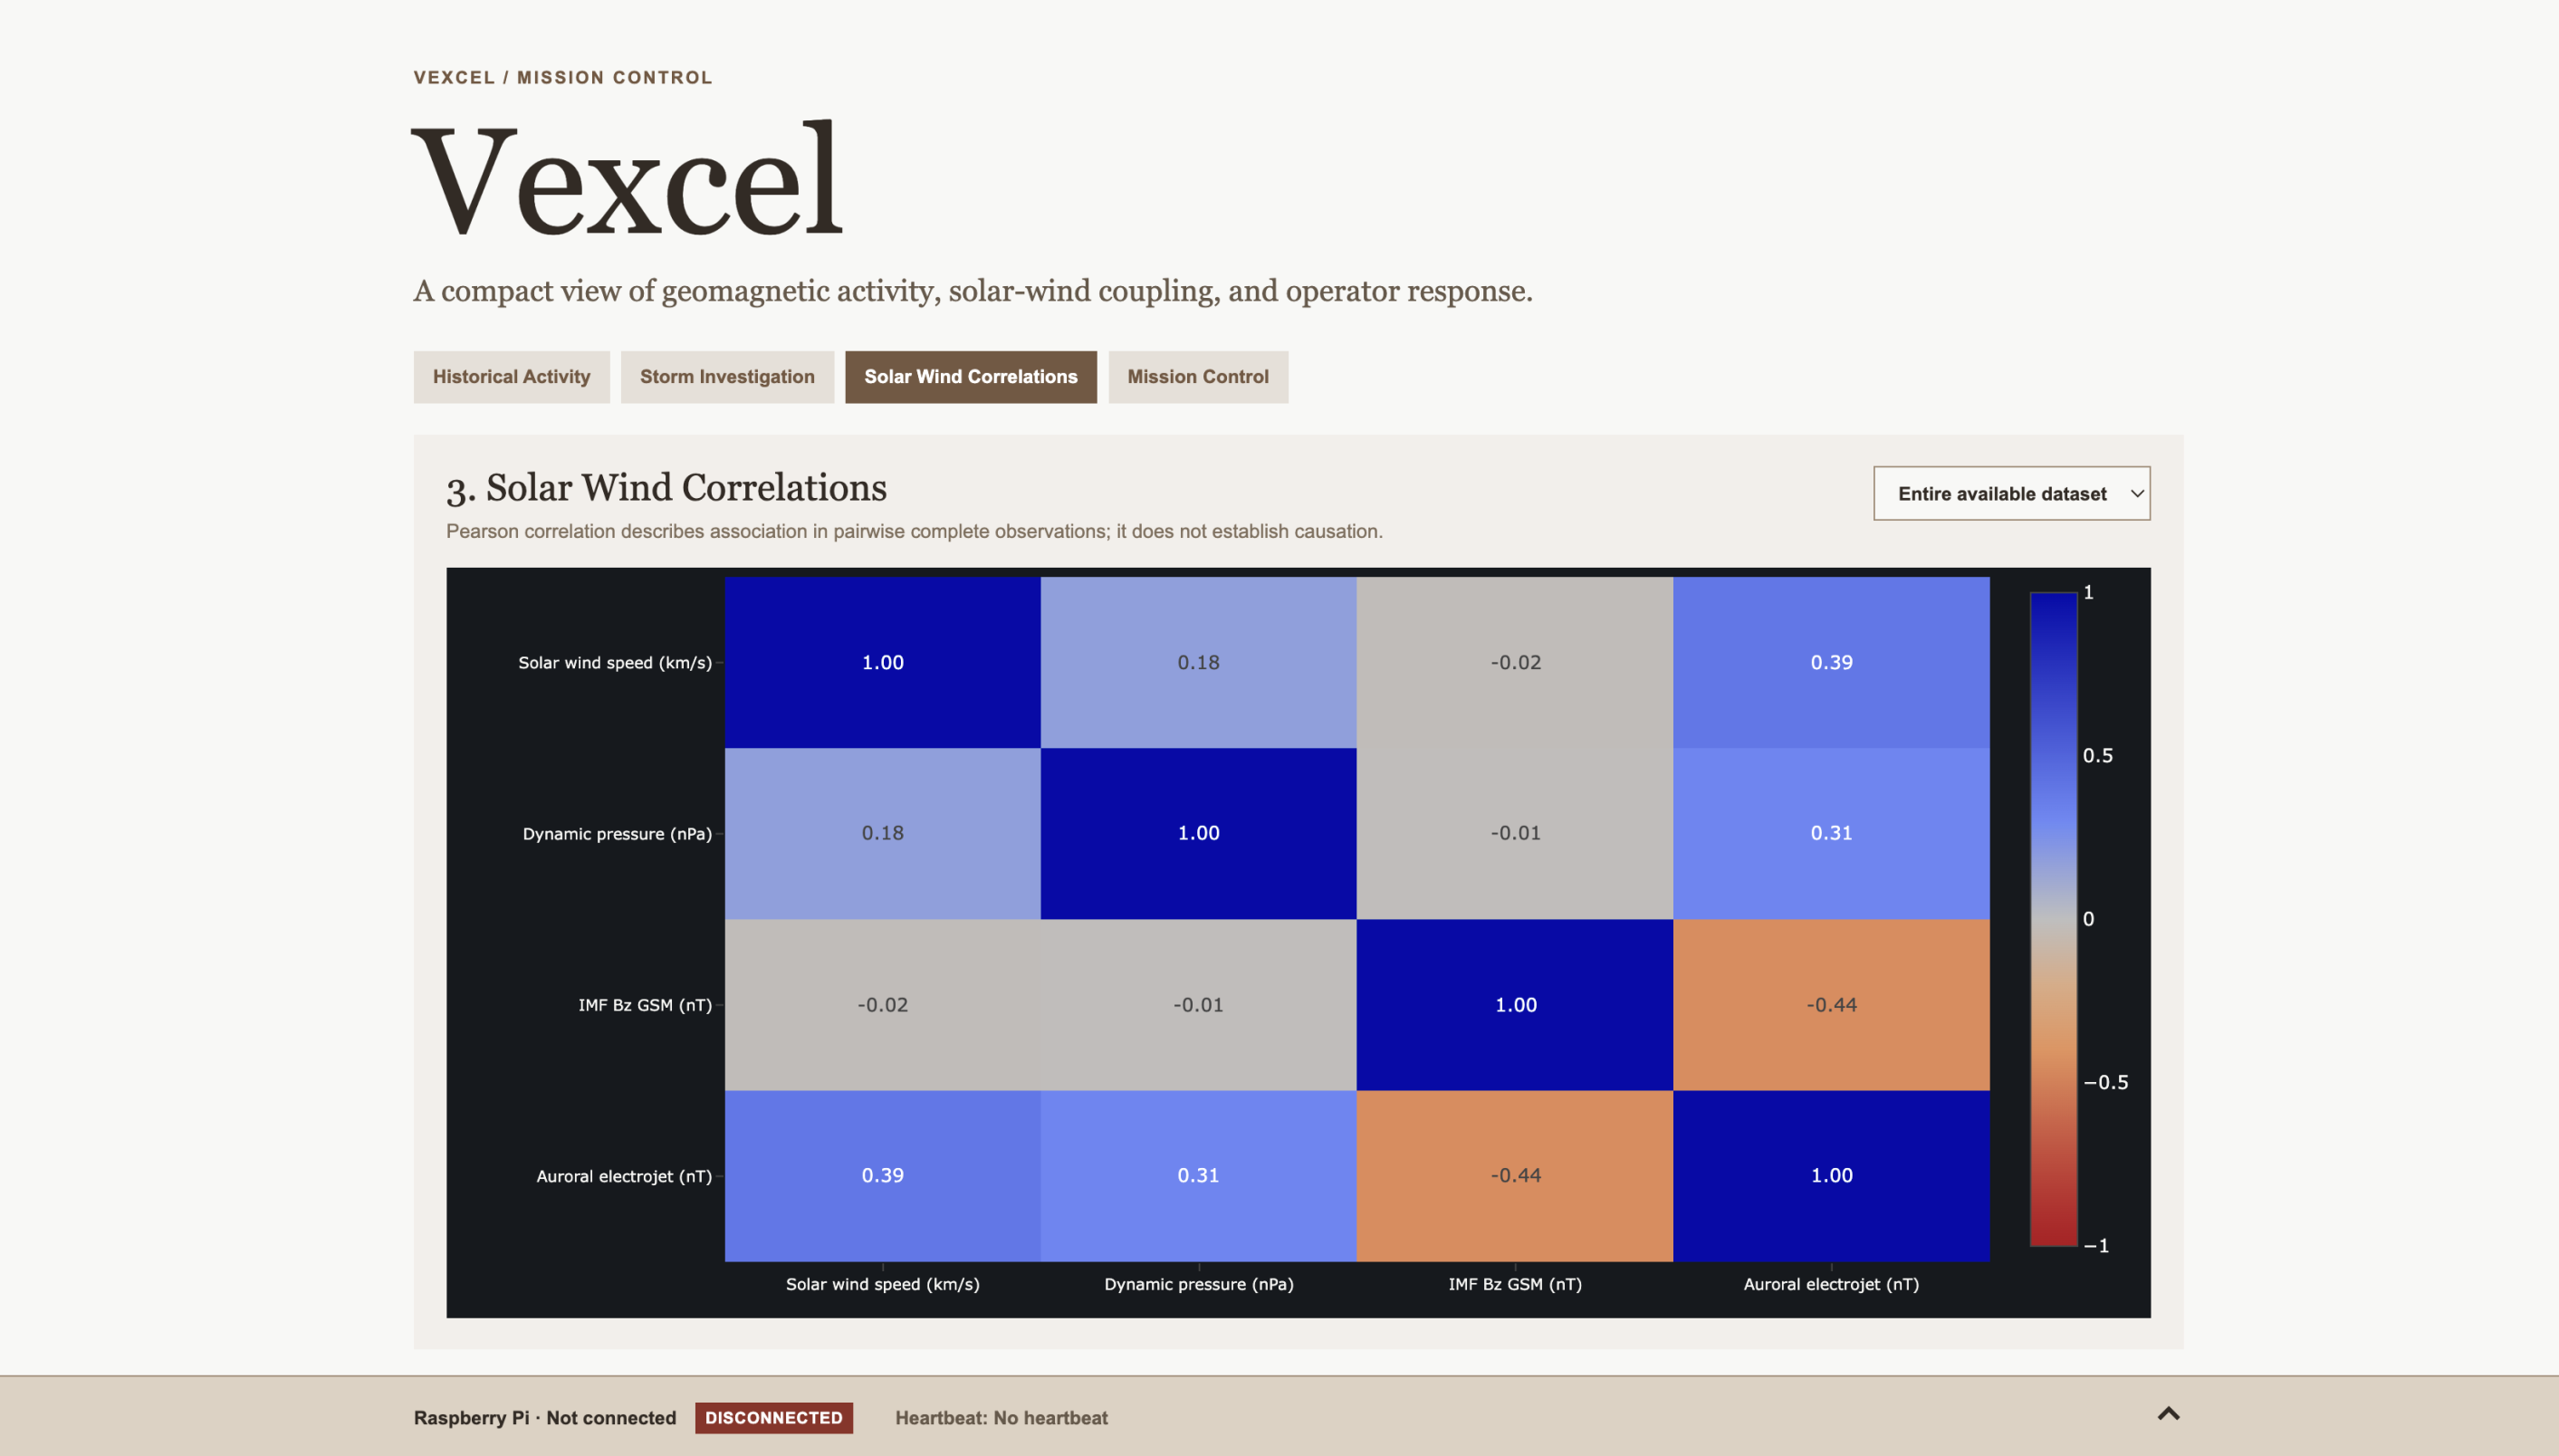
- Storm investigation: Examines the relationship between IMF Bz and SYM-H during the May 2024 event, alongside a correlation heatmap comparing solar-wind speed, dynamic pressure, Bz, and auroral electrojet activity.
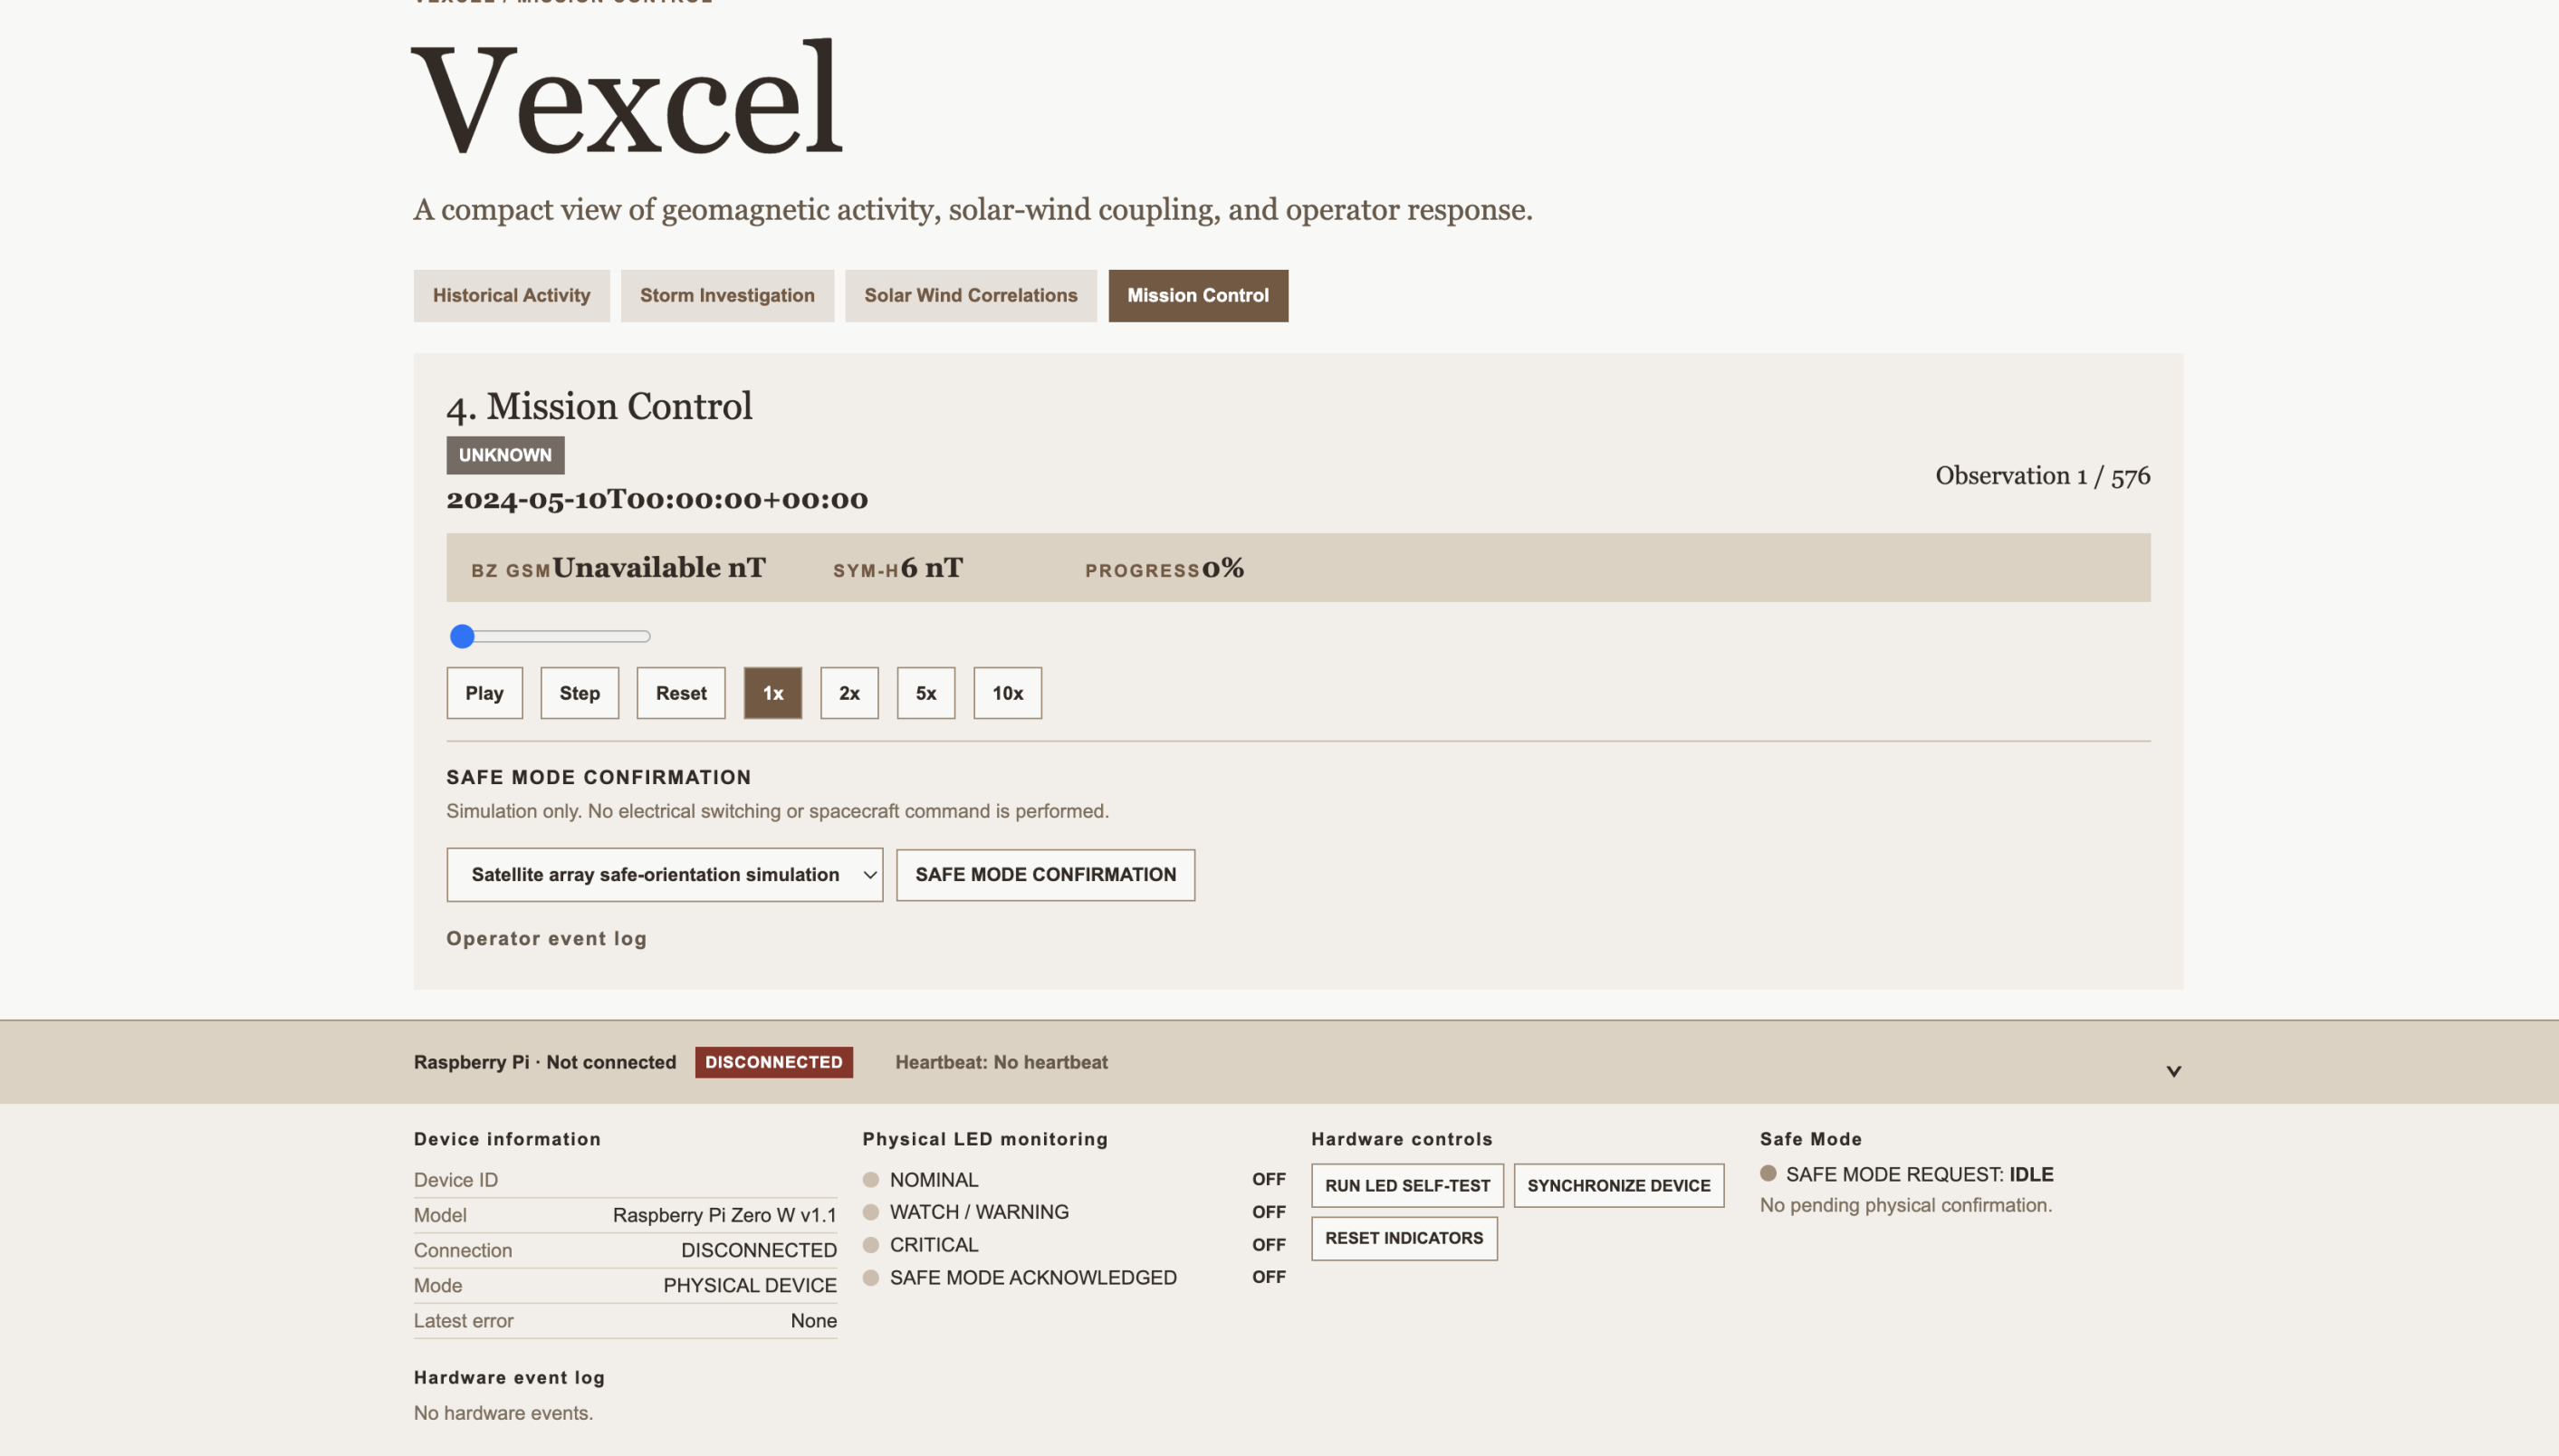
- Mission Control replay: Allows operators to step through historical storm telemetry row by row, with play, pause, reset, step, seek, and adjustable playback speeds.
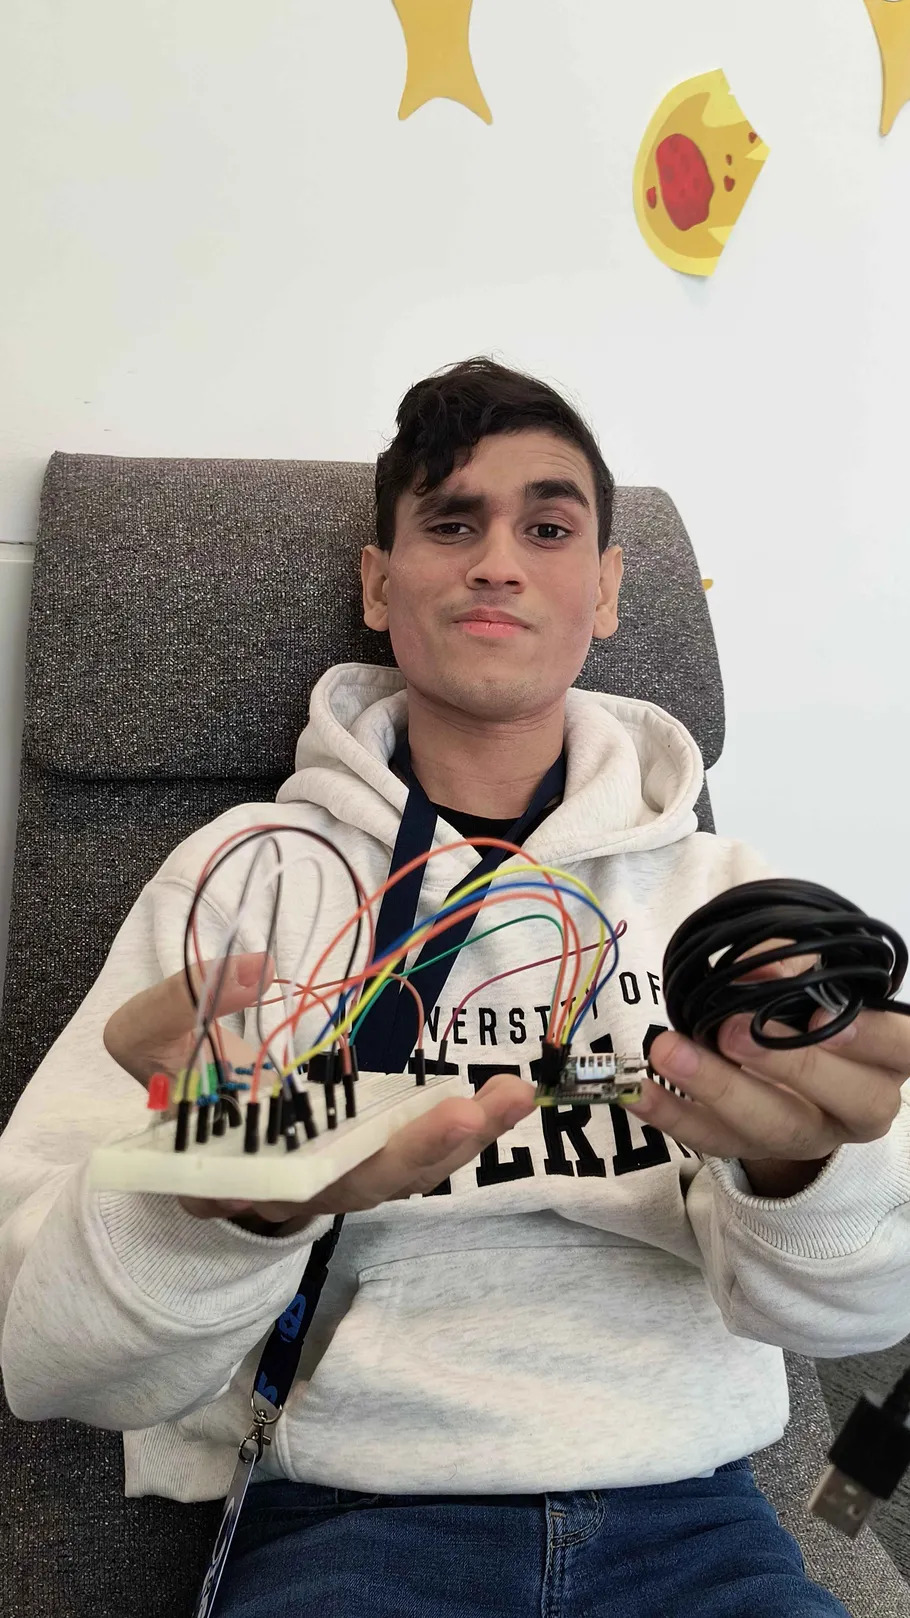
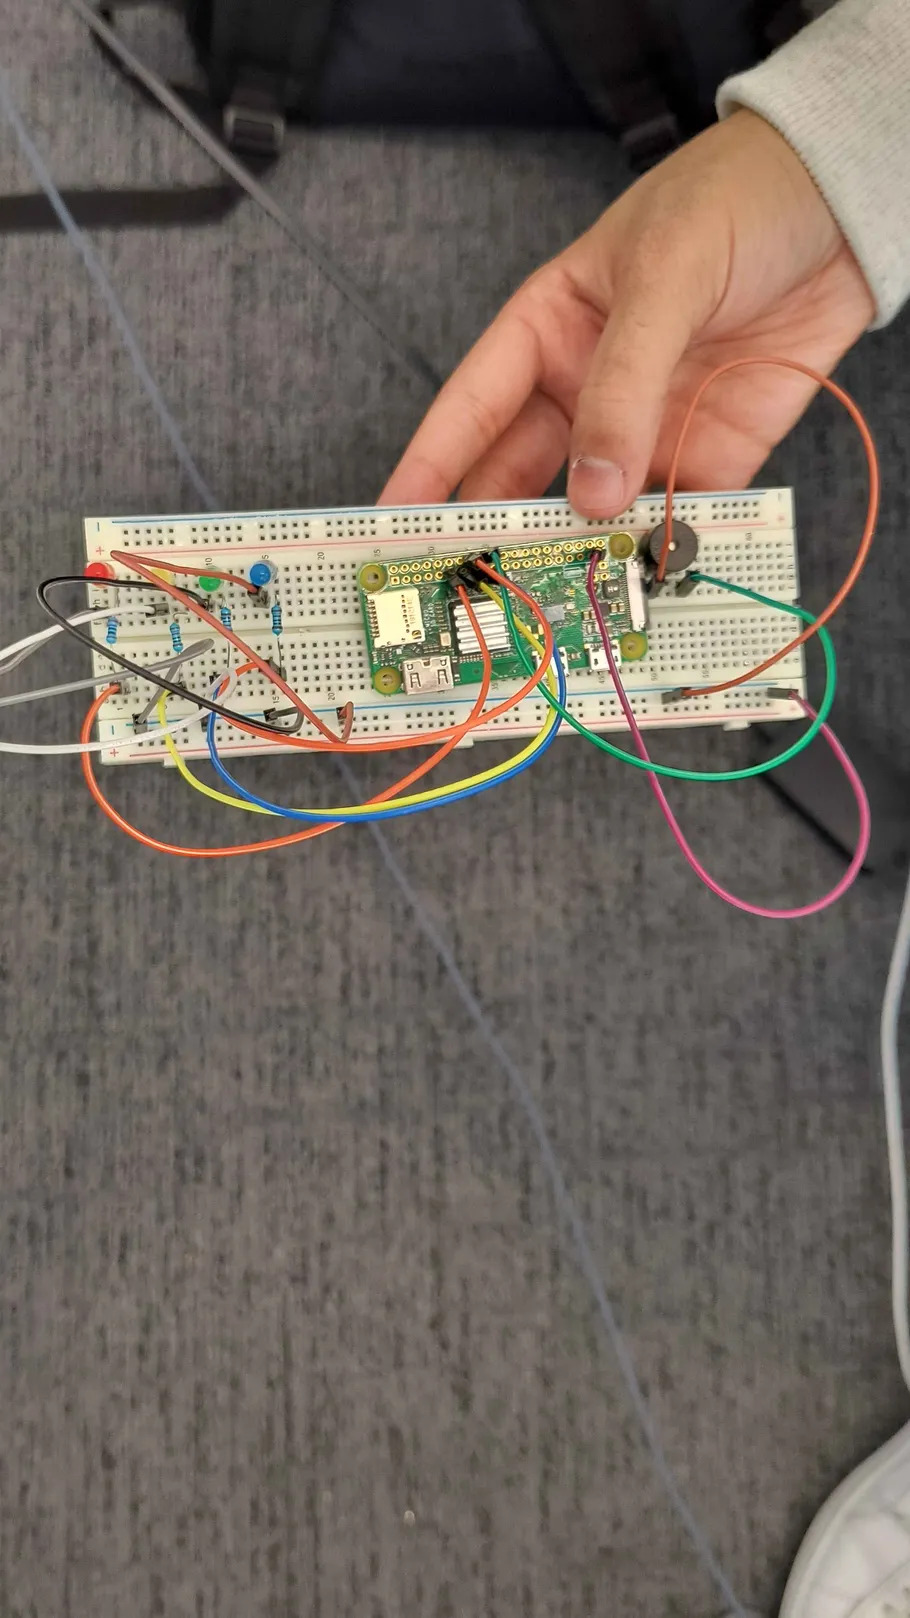
The platform also includes a SAFE MODE CONFIRMATION mechanism that records an operator authorization event and the current replay state. Authorized events can be transmitted to an authenticated Raspberry Pi Zero W v1.1 device, where a blue LED provides a physical indication of authorization.
Rather than simply presenting historical data, Vexcel explores how scientific observations, operational awareness, and physical hardware can work together in a mission-control environment.
How we built it
We designed Vexcel around three interconnected components:
1. Scientific data and analytics
We used the supplied NASA OMNI five-minute CSV dataset containing solar-wind and geomagnetic measurements from 2010–2026.
The backend processes the observed measurements to generate historical timelines, storm investigations, and correlation analysis. It also identifies sustained geomagnetic conditions using three consecutive five-minute samples below defined Bz or SYM-H thresholds.
An important design decision was to preserve the integrity of the scientific data. Missing observations are not synthesized, and missing samples break sustained-event detection rather than being treated as continuous measurements.
2. Interactive Mission Control
We built an interactive frontend that presents historical analytics and a dedicated mission-control replay interface.
The replay is controlled by the backend, which maintains the authoritative telemetry position and supports playback, pausing, resetting, stepping through observations, seeking, and playback speeds of 1x, 2x, 5x, and 10x.
Status indicators provide an operational interpretation of incoming telemetry using demonstration thresholds. Operators can also initiate SAFE MODE CONFIRMATION to record an authorization event and select one of two simulated responses.
3. Raspberry Pi hardware integration
We integrated a Raspberry Pi Zero W v1.1 as a physical hardware component of the mission-control system.
Rather than allowing the browser to communicate directly with GPIO, we implemented a separate authenticated device agent that connects to the backend through a WebSocket connection.
The connection supports device heartbeats, LED state updates, commands, and acknowledgements. The frontend communicates with the backend through authenticated API endpoints, while the backend coordinates communication with the physical device.
This architecture separates the frontend, backend authorization logic, and physical hardware, providing a foundation for expanding the system's hardware capabilities.
Challenges we ran into
One of our biggest challenges was bringing together scientific data analysis, interactive telemetry replay, backend services, and physical hardware within a single cohesive application.
Working with real scientific data presented its own challenges. Five-minute observations can contain missing values, and treating gaps as continuous measurements could produce misleading conclusions. We needed to preserve the original observations and ensure that sustained-event detection accounted for missing samples.
Connecting historical analytics to mission-control replay was another challenge. We wanted the replay to represent actual dataset observations rather than an independently generated animation. This required the backend to maintain the authoritative replay state while the frontend handled the operator interface.
Hardware integration and communication introduced additional complexity. We needed to establish a reliable communication path between the backend and a Raspberry Pi without exposing hardware controls directly to the browser. Authentication, heartbeats, device disconnection, command delivery, and acknowledgements all had to be considered.
Finally, we had to think carefully about the distinction between a scientific observation, an operational warning, and an actual automated response. Our demonstration thresholds are not official NOAA storm classifications, and SAFE MODE CONFIRMATION does not perform electrical switching or issue spacecraft commands. Maintaining this distinction was important to the system's design.
Accomplishments that we're proud of
We're proud of building a project that connects scientific space-weather investigation with an interactive mission-control experience and physical hardware integration.
In particular, we're excited about:
- Integrating NASA OMNI historical observations into an analytical platform spanning 2010–2026.
- Building interactive visualizations that explore geomagnetic activity and relationships between solar-wind parameters.
- Implementing backend-authoritative, row-by-row historical telemetry replay with adjustable playback controls.
- Developing sustained-event detection that accounts for missing observations instead of inventing data.
- Integrating an authenticated Raspberry Pi Zero W v1.1 client through WebSocket communication.
- Creating a physical authorization indicator that connects mission-control events to a real hardware device.
- Designing a modular architecture that separates scientific processing, frontend interaction, backend coordination, and device communication.
Most importantly, we're proud that Vexcel goes beyond a conventional space-weather dashboard by exploring how scientific telemetry can be translated into an interactive operational environment.
What we learned
Through Vexcel, we developed a deeper understanding of space-weather measurements and how different solar-wind parameters relate to geomagnetic activity.
We learned how important data integrity is when working with scientific observations. Missing measurements cannot simply be filled in without potentially changing the interpretation of an event. Preserving observed values and accounting for gaps is essential to producing trustworthy analysis.
We also explored the difference between correlation and causation. Although solar-wind speed, dynamic pressure, IMF Bz, and auroral electrojet activity can exhibit meaningful relationships, statistical association alone cannot establish a causal relationship or guarantee predictive capability.
From a software engineering perspective, we gained experience designing backend-authoritative systems, coordinating frontend and backend state, and implementing authenticated WebSocket communication.
Perhaps our biggest takeaway was understanding that operational safety involves more than displaying a warning. Authorization, explicit operator interaction, communication reliability, and clear boundaries between simulated and physical actions are all important considerations when designing systems inspired by mission-critical infrastructure.
What's next for Vexcel
Our vision is to develop Vexcel into a more comprehensive space-weather monitoring and operational-awareness platform.
Our immediate priorities include:
- Live space-weather monitoring: Explore integration with live solar-wind and geomagnetic data sources to complement historical observations.
- Improved early-warning analysis: Investigate measurable lead times between changes in IMF Bz and subsequent geomagnetic responses, with appropriate statistical validation.
- Expanded forecasting capabilities: Explore predictive models for identifying potentially significant geomagnetic disturbances using historical and real-time observations.
- Hardware expansion: Extend the Raspberry Pi interface with additional physical indicators and operator controls.
- Operational scenarios: Develop more detailed simulated responses that demonstrate how severe space-weather conditions could influence satellite operations and power-grid preparedness.
- Data validation: Improve the handling of missing observations, event detection, and analytical validation against established space-weather classifications.
- System integration: Investigate how Vexcel could connect with existing monitoring and operational-awareness systems.
Ultimately, we want Vexcel to demonstrate how scientific data, software engineering, and physical hardware can come together to make complex space-weather events easier to investigate and operationally understand.

