-
-
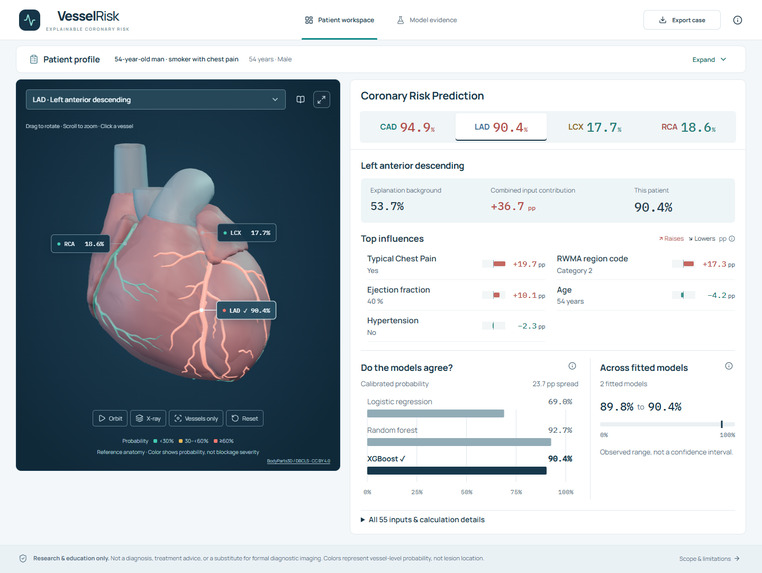
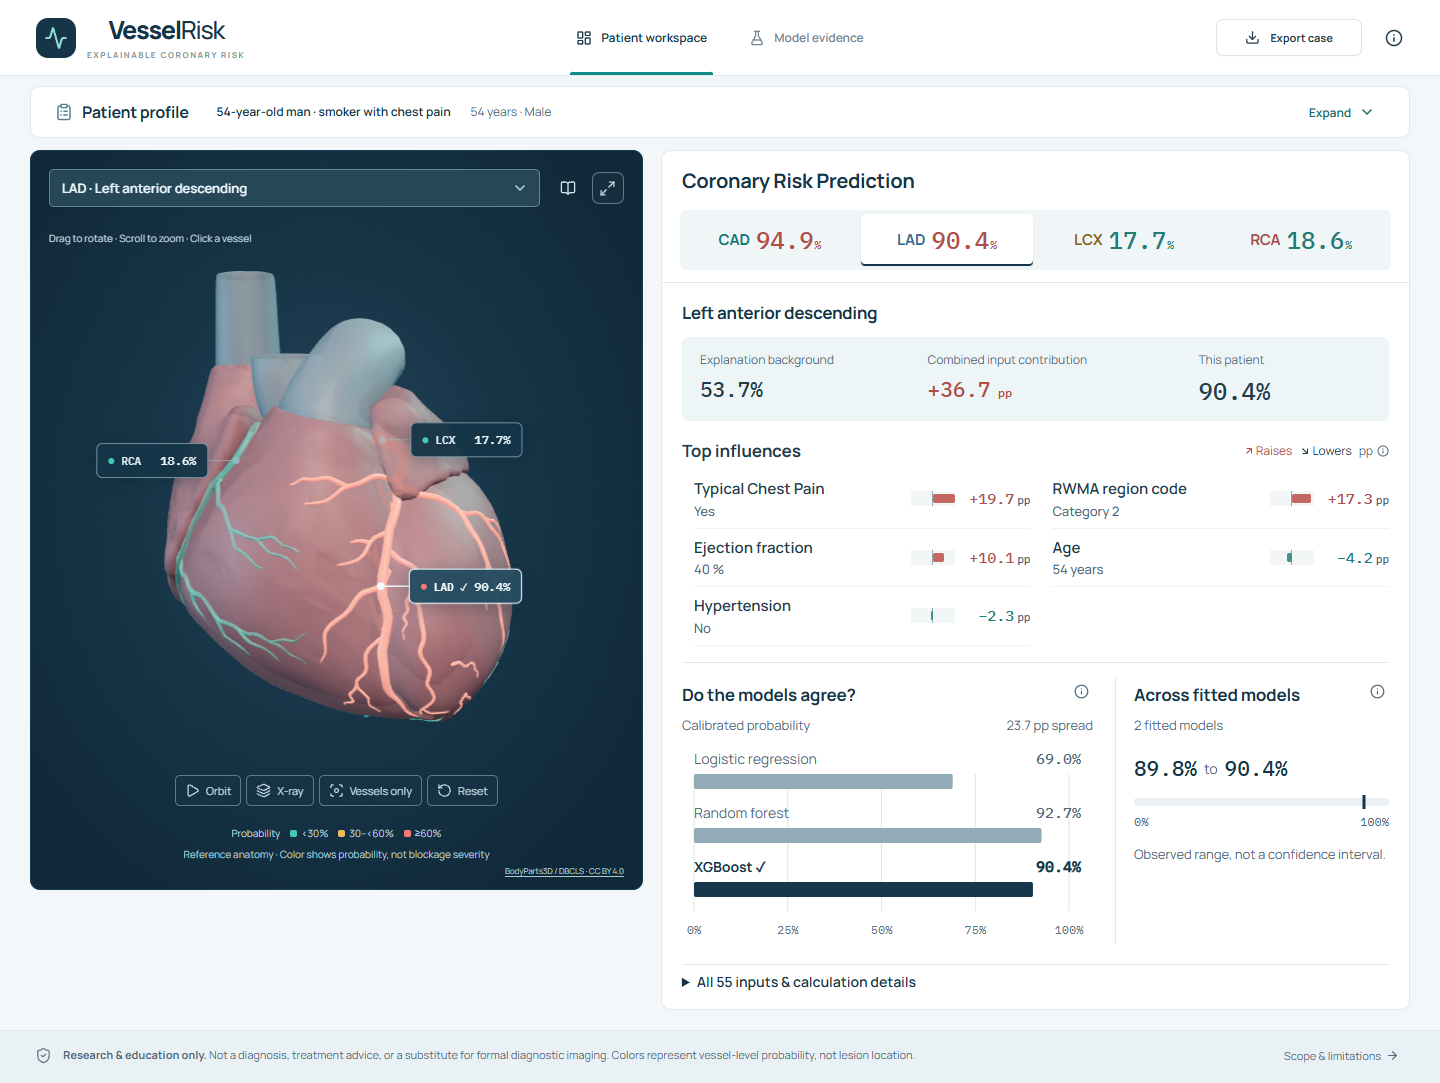
Patient workspace with coronary predictions and individual explanations.
-
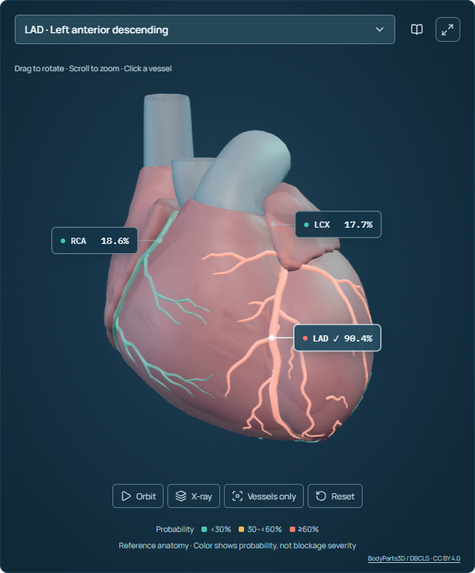
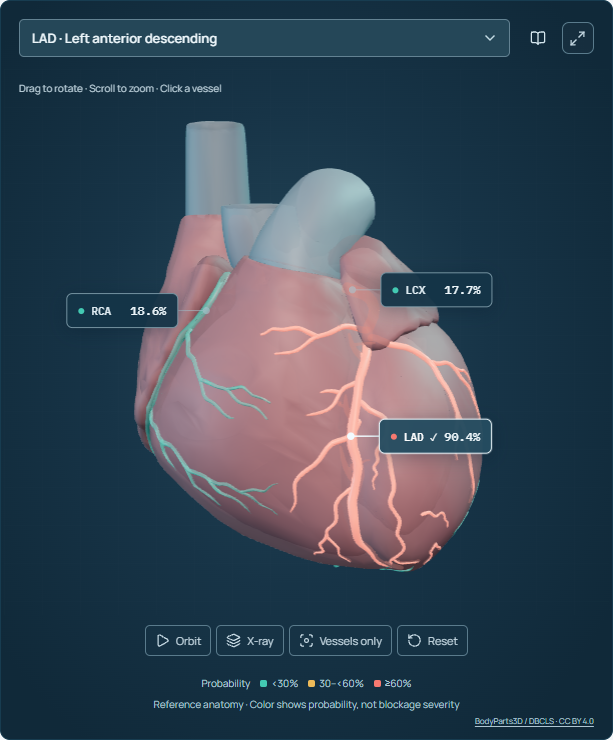
Interactive 3D coronary anatomy colored by estimated vessel probabilities.
-
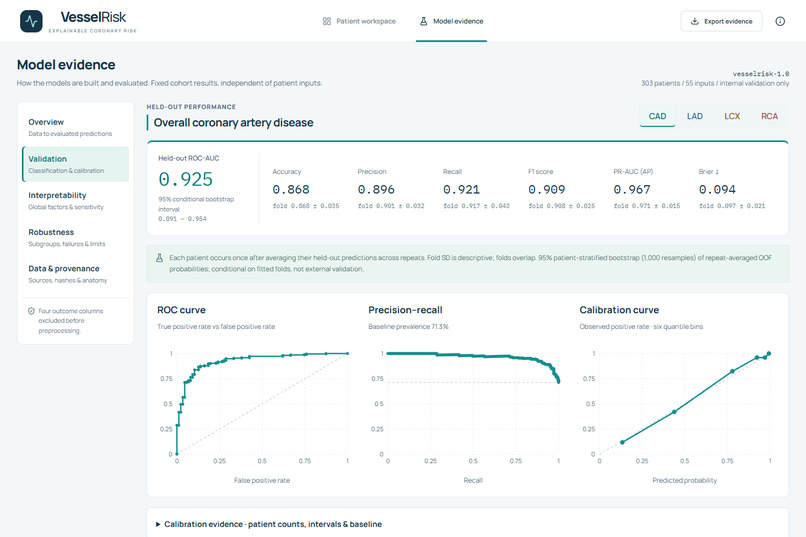
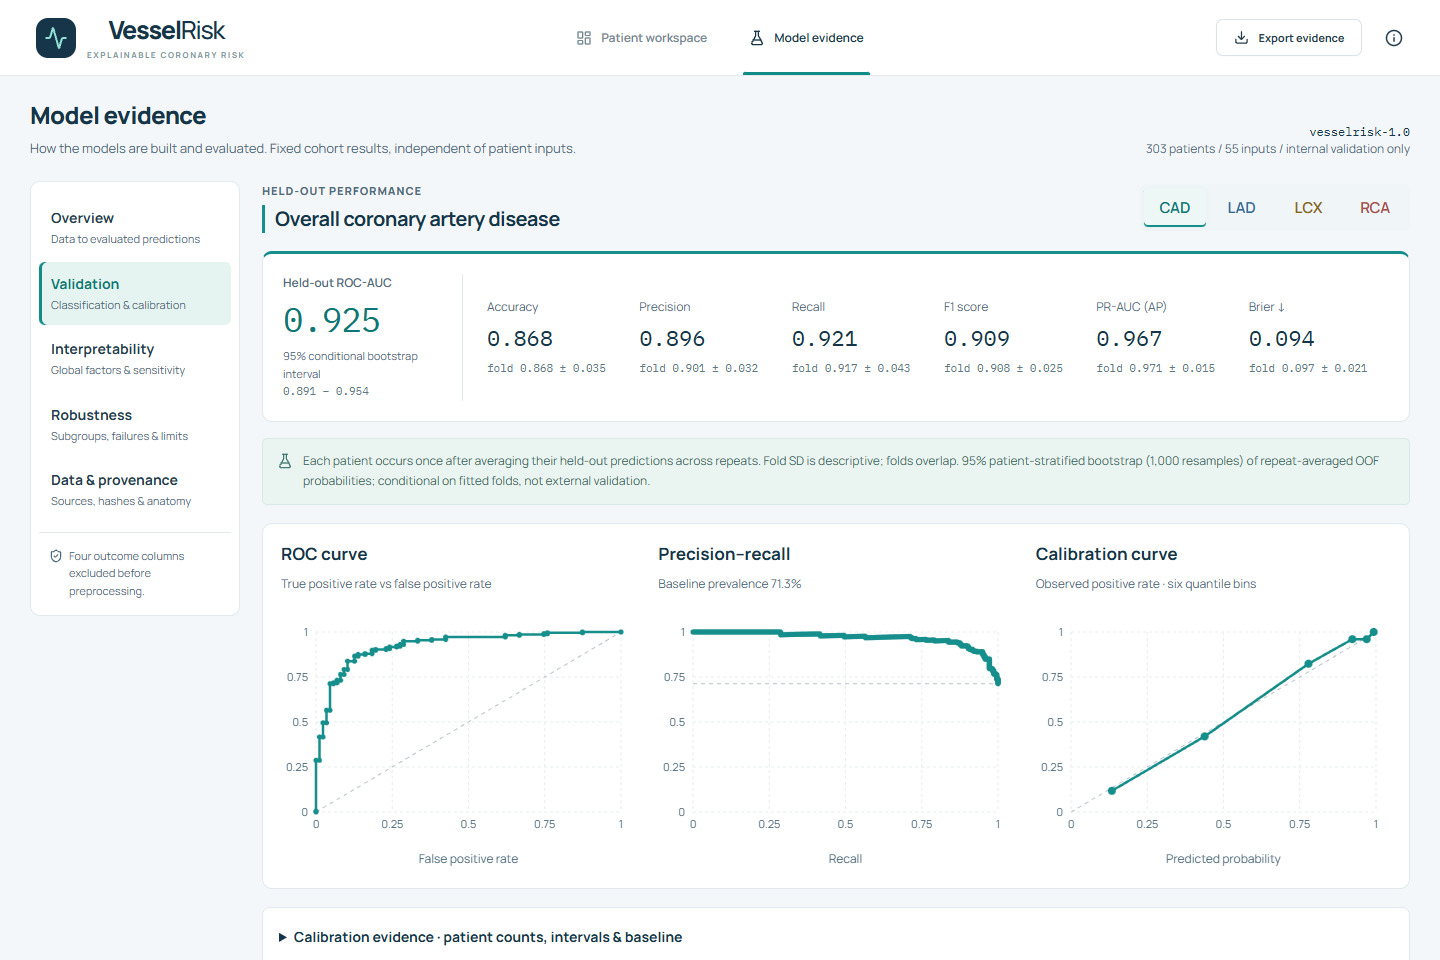
Held-out CAD performance with ROC, precision–recall, and calibration curves.
-
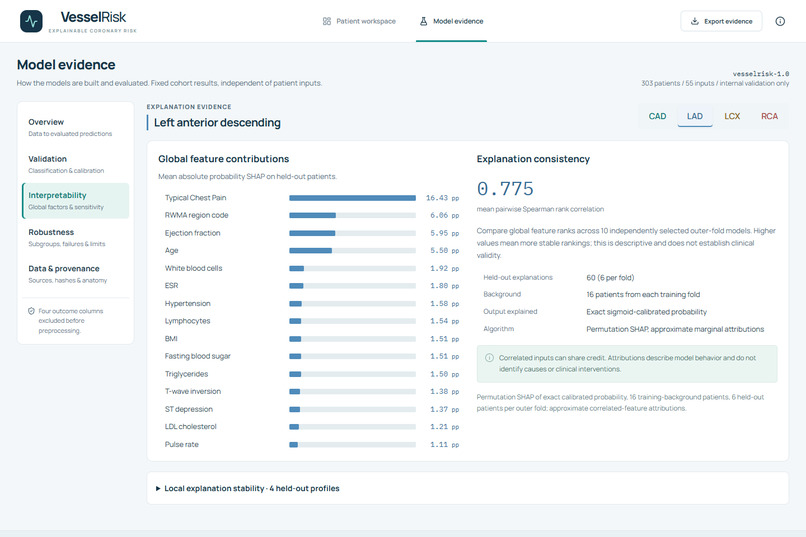
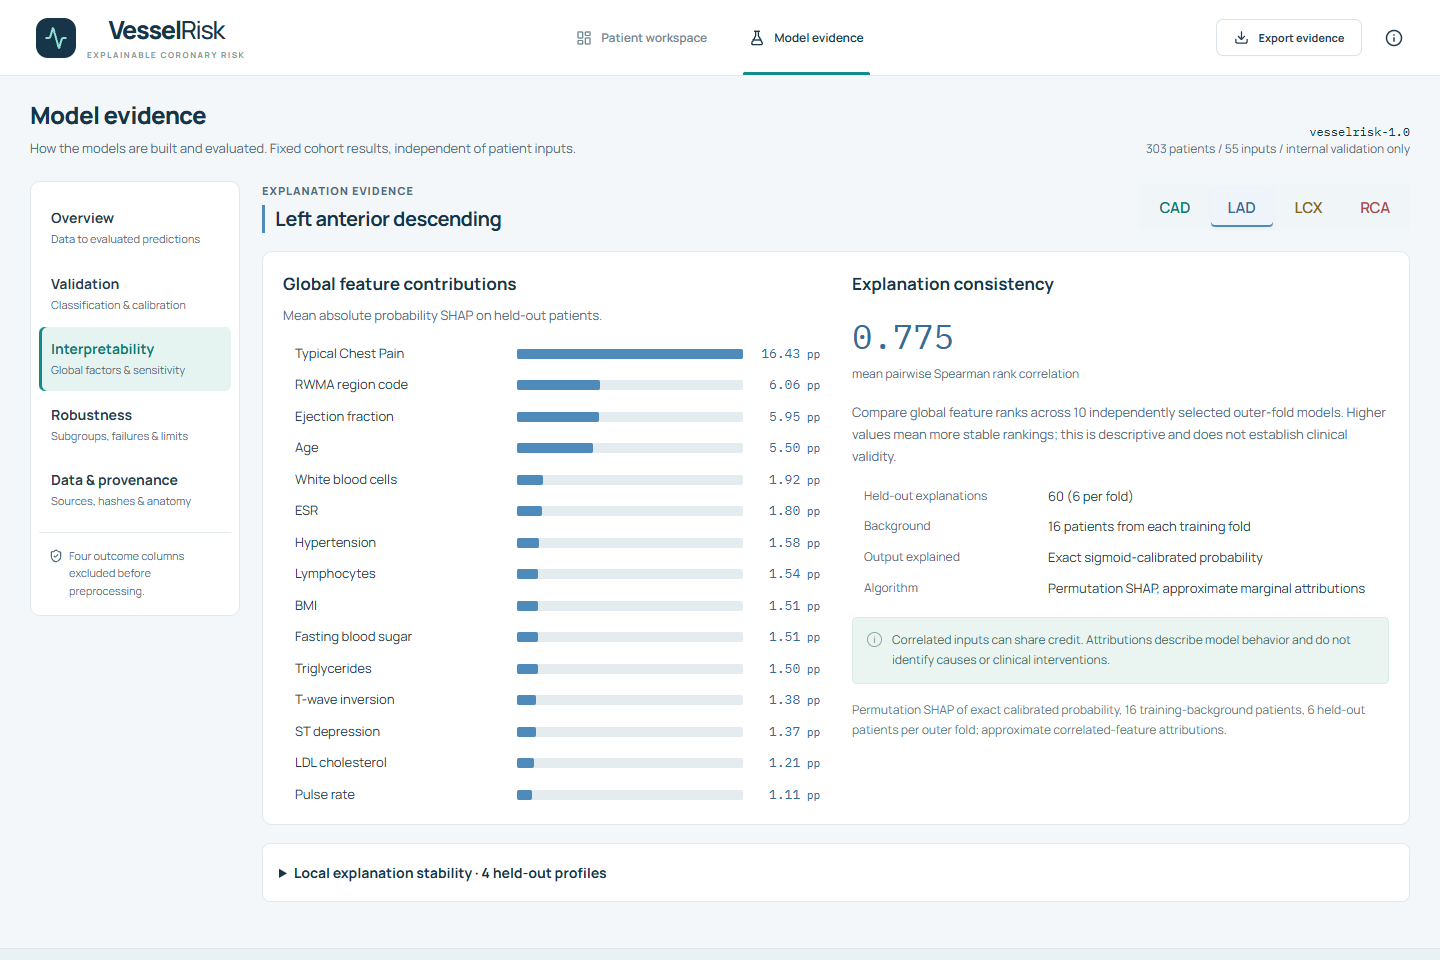
Global SHAP contributions and explanation consistency across fitted models.
-
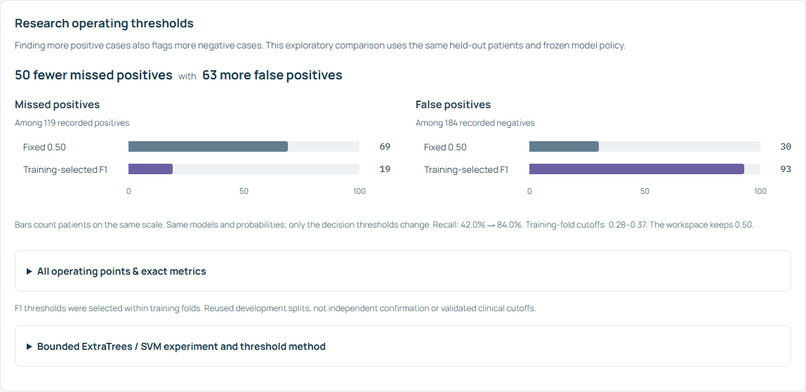
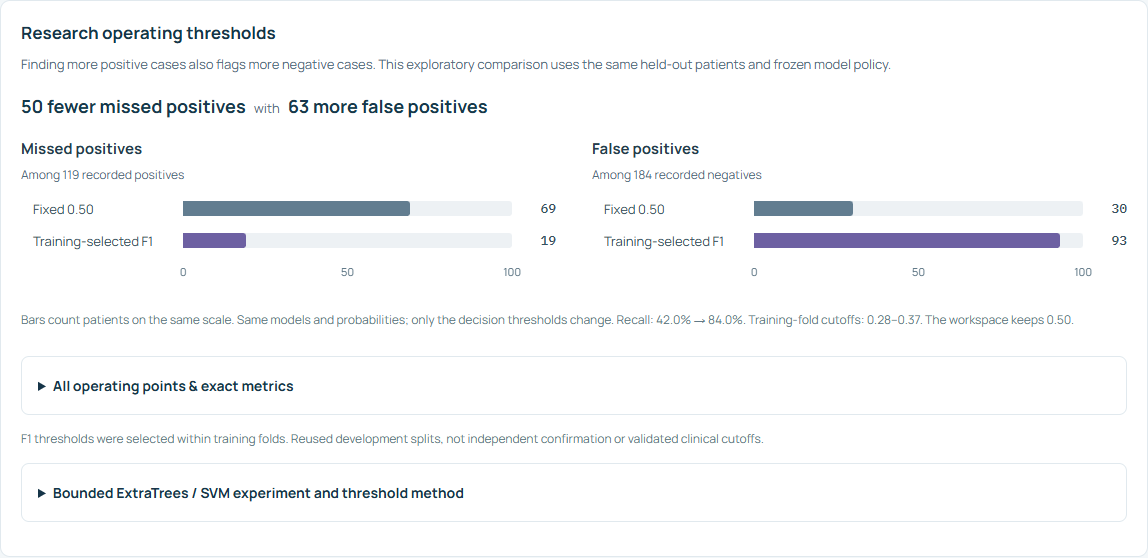
LCX threshold comparison: fewer missed cases come with more false positives.
Inspiration
I built VesselRisk to make coronary risk predictions easier to understand. It brings patient measurements, artery-level probabilities, and model explanations into one workspace, so users can explore a prediction and inspect the evidence behind it.
What it does
VesselRisk estimates overall coronary artery disease (CAD) and stenosis probabilities for the LAD, LCX, and RCA from 55 clinical inputs.
The application includes:
- Patient inputs: built-in examples, manual entry, field search, automatic BMI calculation, and JSON import.
- Interactive anatomy: a 3D heart with rotation, zoom, artery selection, transparency, vessel isolation, and anatomical guides.
- Prediction explanations: SHAP contributions alongside the patient's measurements, model comparisons, and unfamiliar-input warnings.
- Model evidence: validation curves, confusion matrices, calibration checks, threshold tradeoffs, explanation stability, subgroup results, and failure cases.
- Case export: patient inputs, their sources, predictions, and explanations saved as JSON.
Vessel colors represent estimated probabilities on reference anatomy. They do not show lesion locations or blockage severity.
How we built it
The interface uses Next.js, React, and TypeScript. Three.js and React Three Fiber render locally bundled BodyParts3D anatomy. A FastAPI backend calculates predictions using trained scikit-learn and XGBoost models.
The supplied UCI dataset contains 303 patients. All four outcome columns—Cath, LAD, LCX, and RCA—are excluded from model inputs.
Evaluation uses five-fold outer cross-validation repeated twice, with three-fold model selection inside each training partition. Logistic regression, random forest, and XGBoost are compared. Preprocessing and probability calibration use training data only.
Built-in examples use models trained without the selected patient.
AI assistance: OpenAI Codex assisted research, implementation, debugging, testing, UI development, and report drafting. Microsoft Edge TTS generated the demo narration. Statistical models produce the disease predictions.
Challenges we ran into
- Preventing data leakage: preprocessing, model selection, calibration, and explanation backgrounds had to stay within the correct training partitions.
- Uneven vessel performance: LCX and RCA miss many positive cases at the default cutoff. The dashboard shows these errors and the false positives that increase when thresholds are lowered.
- Consistent anatomical mapping: model outputs, meshes, labels, and explanations had to refer to the same artery throughout the application.
Accomplishments that we're proud of
The complete workflow runs locally with one startup command, with trained models and anatomical assets included:
python scripts/start.py --setup
After startup, users open http://localhost:3000.
Internal held-out ROC-AUC results are:
- CAD: 0.925
- LAD: 0.839
- LCX: 0.728
- RCA: 0.732
The project includes reproducible evaluation records, automated scientific and desktop browser checks, and a six-page technical report.
What we learned
Each vessel needs separate evaluation. Calibration, missed cases, and explanation stability matter alongside overall performance.
SHAP contributions can add up correctly while individual feature attributions remain sensitive to the background data. We included stability checks so users can inspect this limitation.
These are internal results from a small cohort, without external clinical validation. VesselRisk is for research and education, not diagnosis or a substitute for diagnostic imaging.
What's next for VesselRisk
The next priority is evaluation on an independent patient cohort. Further work would investigate vessel-level performance, test explanations with larger computation budgets, and gather feedback on how users understand the dashboard.
Clinical use would require additional validation beyond this prototype.
Built With
- bodyparts3d
- edge-tts
- fastapi
- next.js
- numpy
- openai-codex
- pandas
- playwright
- python
- react
- react-three-fiber
- recharts
- scikit-learn
- shap
- three.js
- typescript
- xgboost

Log in or sign up for Devpost to join the conversation.