-
-
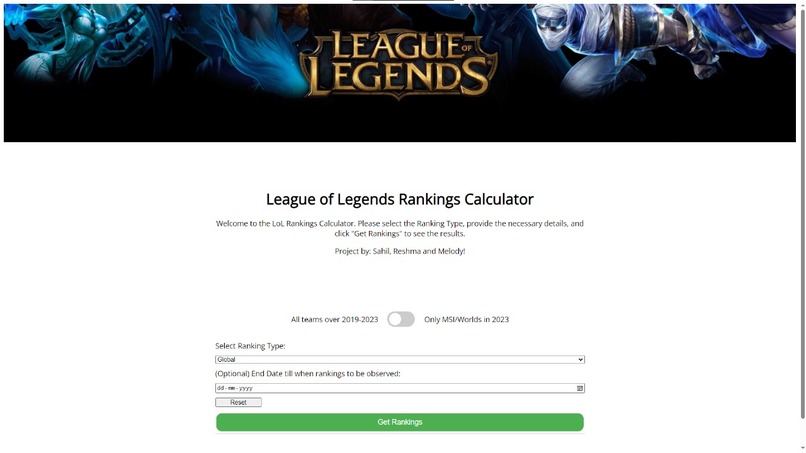
Website Homepage
-
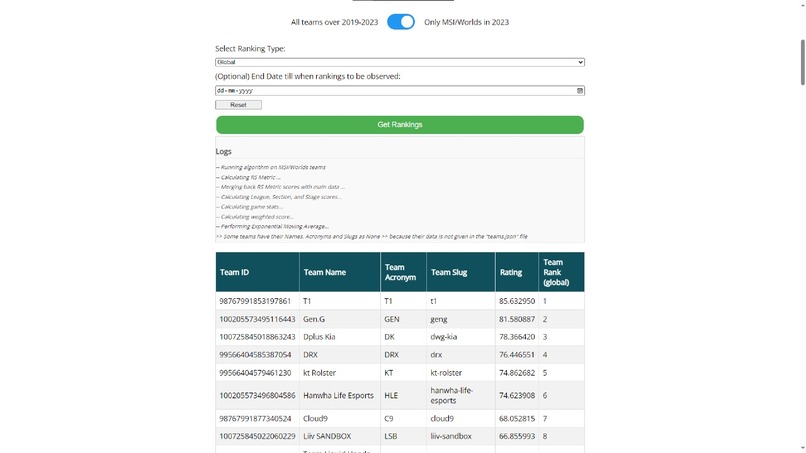
Sample Rankings


🚩Inspiration🚩
📄Research📄
To prepare for the hackathon submission, we start with reviewing all the rules and instructions laid out in DevPost, as well as the official document laying data structure and description of the data we are provided. Our goal was to develop a solid understanding of the ask which will guide our development direction and avoid being off track.
As League of Legends is the key to this hackathon, we spent time watching videos of actual tournaments and a beginner walkthrough of League of Legends. This helped us understand the basic game structure.
Also, it helps define a good performance in League of Legends. A good team collaborates with teammates in the earlier stage of the game. They strategically balance killing dragons, accumulating golds, defending and attacking towers, before ultimately leading to the winner team destroying the last tower (nexus) of the opposing team.
In short, League of Legends requires micro decision making skills, which should be put into consideration as we extract data fields from the database and use them as the metric in our models. This inspired us to create a model that is data-processing intensive and make sure that we get the most insights from the data.
Besides, to better understand how e-sport ranking works, we researched on the FIFA system, which gives us a formula that highlights that a rating is determined by their previous battle results and their current match result, which includes importance of the match multiplied by the difference between actual and predicted performance. This helps us in understanding the overall picture in e-sport ranking.
🚀What it does🚀
PixelPilots is an interactive webpage that provides global, tournament and team ranking based on win-ratio, metrics from in-game data and tournament types.
💡 You can try out the website here.
🛠️ Pre-Model Development + Model 1 🛠️
Goals
To download the data from the S3 bucket provided and identify the data that can be utilized. Construct a basic model from the data obtained.
🌐Downloading the data🌐
We modified the existing code given to download the game-level data such that we only read through relevant sections and attributes and extract them. Our extracted game data file was each 1KB instead of the original 100MB. This gave us a file size reduction by ~100,000 times per game file and allowed us to analyse every game.
👓Metrics👓
- Observed that
tournaments.jsonis the cleanest data files with minimal missing fields. - Identified that
tournaments.jsonalso has team IDs of the teams playing each game and that it can be used as our unique ID. - Understood the structure to access each game in the
tournaments.jsonfile.- League -> Stage -> Section -> Match -> Game -> Outcome
Used this to plot a very basic model having the ranking metric as the win/game ratio (referred as
wins_pct).wins_pct= (number of games won)/ (number of games played)
A secondary metric of number of games played was used for the teams with equal win/game ratio. Teams with a higher number of games played were given a higher ranking when there were teams with equal
wins_pct.
🎙️Drawbacks🎙️
- Using the
wins_pctas a metric for ranking did not work well since there were many teams with <10 games played and won almost all of them and obtained really high ranks.
🌞Model 2🌞
Goals
Find other factors within the game that can complement the wins_pct and judge the strength of the team well.
👓Metrics👓
As can be imagined, the win/game ratio is not a good indicator for the rankings due to the range of total games ranging between 1-500+. So, we decided to create a new metric that gives a different weightage to the number of games played and the wins_pct.
-
rs_metric= 0.25 *num_games+ 0.75 *wins_pct
🎙️Drawbacks🎙️
- This metric also gave relatively higher ranks for teams with <10 games played.
- Plotted the statistics to figure out that the 75th percentile of the number of games played stood at 55. It indicated that most teams have played less than 55 games and the weights need to be changed for the metric to be meaningful.
🤾Model 3🤾
Goals
Adjust the weights to accommodate all kinds of teams, frequent players/new players, skilled/unskilled in the ranking appropriately.
👓 Metrics👓
- Created different weights for different class of players as follows
| No. of games | No. of Games (weightage) | Wins Percentage (weightage) |
|---|---|---|
| 0-20 | 10% | 5% |
| 20-120 | 15% | 150% |
| >120 | 15% | 75% |
- The weights normalized the skew caused by teams that have played very high/ very less games.
🎙️Drawbacks🎙️
- We have saturated the information that can be obtained from the
tournaments.jsonfile and do not have enough factors to judge the strength of a team. - The in-game data needs to be processed to obtain useful information for ranking the teams.
⚽Model 4⚽
Goals
The goals for this model are to reference FIFA system to develop our model, include in-game data to develop more metrics for a more comprehensive ranking and employ AWS capabilities to optimize our model.
👓Metrics👓
The model is calculated by a weighted average of three main components:
Rating = RS-Metric * 50% + Game Weights * 30% + In-Game Data * 20%
- The
RS-Metricremains the same from previous models, considering of a roundedwins_pctand weightednum_games.
To sort out game weights, we have to understand the game structure of League of Legends first. Through our research, we found that within our database, section leads to stage, and then tournament.
These competitive games have various forms, for example League of Legends Worlds, the most competitive annual international tournament, or All-Star Exhibition, which is more casual and for an entertaining friendly match.
By understanding their differences, we have grouped the tournaments into the following categories (in descending order of importance):
- International Major Tournaments
- Regional Leagues
- Academy Leagues
- Amateur and Semi-Pro Leagues
- International and Minor Tournaments
- Local and National Leagues
- Community and Fun Tournaments
Similarly, we rank the stages and sections according to their relative importance. As a rule of thumb, we rank professional competitive games higher and games that cover a greater geographical area higher.
For the detailed weights breakdown, please refer to our excel sheets in the league_weights directory in the Github Repo.
In summary, the formula of game weights is:
league_score = 0.4 * tournament_wt + 0.3 * section_wt + 0.3 * stage_wt
By applying this formula, we have successfully considered the case of teams playing and winning many matches in the lower ranked leagues to have a lower ratings, creating difference between advanced players and others.
- For in-game data, we have identified and extracted the following from the dataset as important metrics.
| Metric | Description | Point Allocation | Weight |
|---|---|---|---|
XP |
XP is the experience of the champion. The higher the XP, the better the performance. |
XP < 9000 : 15.5 pts 9000 <= XP < 19000 : 22.5 pts XP >= 19000 : 32.5 pts |
32.5% |
Attack Speed |
Attack speed is the time taken to activate a move and target on the opposing team. The higher the accuracy, the better the performance. *It should be noted that accuracy of moves may be another influencing factor. |
Attack_Speed < 140 : 0.75 points 140 <= Attack_Speed < 210 : 1.5 points Attack_Speed >= 210 : 2.5 points |
2.5% |
Champion Kills |
Champion kills is the number of opposing team champion(s) being eliminated by the team. The higher the number of champion kills, the better the performance. As champion killing is considered as a strategic move to hinder the opposing team champions from developing and create a competitive edge for their own team. |
0 < Champion_Kills < 10 : 7.5 points 10 <= Champion_Kills < 30 : 15 points Champion_Kills >= 30 : 25 points |
25% |
Total Gold |
Total gold is the number of gold that the team has collected throughout the game. The higher the number of total gold, the better the performance. Gold is a virtual currency in League of Legends, which can be collected through killing non-playable characters. Gold is a crucial part of the strategic play, as it allows player to purchase items during the game which may help them gain a competitive edge. |
40000 > Gold : 7.5 points 40000 <= Gold < 80000 : 15 points Gold >= 80000 : 25 points |
25% |
Average Level of the Team |
Average Level of the Team is the mean of level of all players in the team. The higher the average level of the team, the better the performance. Average level of the Team indicates the development progress of each champion which is a key strategy in League of Legends gameplay. |
Level < 11 : 1 point 11 <= Level < 13 : 2 points 13 <= Level < 15 : 3 points 15 <= Level < 17 : 4 points 17 <= Level : 5 points |
5% |
Difference in Level of the Team |
Difference in Level of the Team calculates the difference between both teams' the Average Level of the Team. A higher difference in level of the team indicates a less equal match. This predicts a better performance of the team with the positive difference. Meanwhile, a lower difference in level of the team indicates a more equal match. Thus, we would like to reward the weaker team in the case of having a high difference in level of the team and still manage to win the game. |
One-sided Match (difference >= 2) -> Better Team (d >= 2) and I lose -> 1 points -> Better Team (d >= 2) and I win -> 6 points -> Worse Team (d <= -2) and I lose -> 4 points -> Worse Team (d <= -2) and I win -> 9 points Creating a 2 points or 8 points difference. Neutral match (difference < 2) -> If you win -> 8 points -> If you lose -> 5 points Creating a 4 points difference. |
10% |
- We arrived at these buckets and weights by plotting and analyzing the distributions of these variables on the overall game data.
🎙️Drawbacks🎙️
- Metric weightings are based on relative importance of different metrics, which will need more data to justify.
- Edge cases like outlier input, are not addressed in this model.
🥁Model 5🥁
Goals
The goals are to address edge cases and migrate our model to be an interactive webpage, hosted via AWS.
👓Metrics👓
We have created a user interface for our model that asks for the following input:
Ranking Type (Global, Tournament, Team),Tournament ID,Team IDandEnd Date(Optional).With
End Dateas an input, our ranking will filter to only include related teams and all games up until theEnd Datestated. This allows users to query the ranking of teams up to a specific point in time.We implemented an Exponential Moving Average (EMA) on the final score calculated so that more weight is given to a team's recent performance and consistency rather than a mean of all their games.
We edited the Tournaments Rating system such that it now considers all historical games played by the teams playing in that tournament, up to the tournament's end date. In other words, if two teams are part of a tournament held during January 2023, our ranking system will consider all available games by these two teams up to the end of the tournament in January 2023. This ensures we accommodate the historical performance of the teams in the rankings
5 . We are aware that with input fields, we are prone to input errors, which create edge cases. To accommodate these cases, we have coded a response. These responses are printed on the webpage. A detailed version can be found on our Github repo under the ranking_code directory
🔥Implementation of AWS EC2🔥
We have used EC2 to deploy our Python code. AWS is one of the most popular cloud services available today, providing amazing solutions for many different problems that businesses face. Amazon Elastic Compute Cloud (Amazon EC2) provides on-demand, scalable computing capacity in the AWS Cloud. We use Amazon EC2 in the free tier. EC2 allows us to develop and deploy applications faster. EC2 also allows us to launch many virtual servers as required, while allowing us to configure the security settings.
💪Steps followed to use EC2 in our application💪
- Create an Ubuntu EC2 on AWS. Tagged this EC2 instance with
key: power-rankings-hackathonvalue: 2023 - SSH into Ubuntu EC2
- Create our Flask app inside EC2
- Run Gunicorn WSGI server to serve the Flask Application
- Use systemd to manage Gunicorn
- Run Nginx Webserver to accept and route request to Gunicorn
😁Accomplishments that we're proud of😁
- Our ranking model is unique because it also factors in the time frame of the games played. Although the entire game log of each team was processed for the ranking, more priority is given to the recent games played by the team while calculating their score. This ensures that the score includes the consistency and the growth in strength of the team.
- We have an exhaustive error log that covers almost all edge cases that may arise during execution and we have implemented appropriate error messages for the same.
- The ranking system takes into account in-game performance and player moves like kills, gold earned, xp earned, level obtained, etc.
- The score is well-rounded since it is composed of three components:
- Team-level factors
- Game-level factors
- Tournament-level factors
- We came up with an interactive UI/UX page in a short time and released it to the public.
- We were able to code an extraction script that would only extract relevant fields from the huge game files (in TB) such that our final data table holding all 24000 games across 4 years is only 2 MB.
- The final model is the 6th iterated model and we are proud of the thinking process that went into ideating and building them from scratch.
- The optional
End Dateparameter allows the user to view the rankings as of that day. It can also be used to review the team's performance over time.
⚡What we learned⚡
For our model, we have used data from the
tournaments.jsonfile since it is the cleanest file with a lot of game entries. It also specifies the tournament type and helps us classify the importance of the game. We also included the in-game data to observe the gameplay of the teams in the game.We observed that we had 248 tournaments, 599 global teams and 55 global leagues that we could analyze. We have processed more than 24000 games in our ranking model.
We noticed that only 182 teams had participated in a Worlds/MSI event from a qualifying region in 2022-23.
We learnt how to integrate flask with our python code to build a website
✈️What's next for PixelPilots✈️
🏎️Future Development🏎️
For future development, we have two general directions:
- Optimizing weightings:
- The first way to do it is to conduct more research and collect more game data to test and justify our weightings.
- With access to existing rankings issued by League of Legends, our model can be refined to be more accurate.
- Another way is to create a clustering model with in-game data to see the distribution of datapoints and derive the weights from that.
- Developing more metrics:
- The first way is to manually brainstorm more complex metrics.
- This includes
assist kill ratio, which rewards those who have a low kill but high assist. This is under the rationale that different champions have different roles and they are supposed to work together strategically, thus some champions will die more often than others and have less kills, yet they have high assists. - Thus,
assist-kill ratiocan be another indicator of good performance, and avoids the team rating being pulled down due to lower individual kills despite a team wise collaboration effort.
- This includes
- Another way to develop more metric is by training an ML model to find correlations between in-game data and team performance.
- For example,
average respawn timecan be an indicator for team performance. Yet when we try to analyze it manually, we have found that for weaker players, therespawn timecan be low as theirchampion levelis low. - For general players,
respawn timecan be high due to advancement towards later game stage, for example the player dies more towards the end of the game, which leads to a higheraverage respawn time. For strong players, theiraverage respawn timecan be high due to theirchampion levelbeing high; or low due to no death or a few death only; or low due to killing the dragon strategically and get the team-wide buff for shorteningrespawn time. - The
average respawn timemay also co-relate with other data likechampion levelanddragon kills, which can be verified through training an ML model to analyze inter-field relationships, in order to create more complex metrics to accurately reflect team performance.
- For example,
- The first way is to manually brainstorm more complex metrics.
- Clustering similar teams:
- Grouping together similar teams helps us build stronger in-game recommendation engines to the players.
- Similarly, newer and customized leagues can be set up for teams falling in the same category.
📌Sample Inputs to the web application📌
- Sample Tournament IDs: 108998961191900167 (World's 2022), 105562822074055437 (TCL Winter 2021)
- Sample Team IDs: 107581212180071788, 99566404585387054, 106857761435870473
Built With
- amazon-ec2
- amazon-web-services
- css
- flask
- gunicorn
- html
- matplotlib
- nginx
- numpy
- pandas
- parquet
- python
- zip


Log in or sign up for Devpost to join the conversation.