-
-

Cyanobacteria cells under the microscope: the harmful algal blooms Verdant helps rangers find, built for the OneAquaHealth hackathon.
-
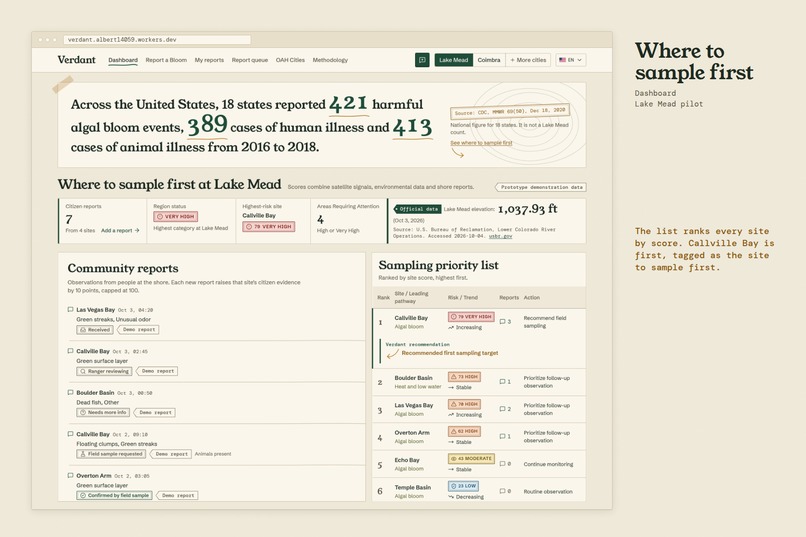
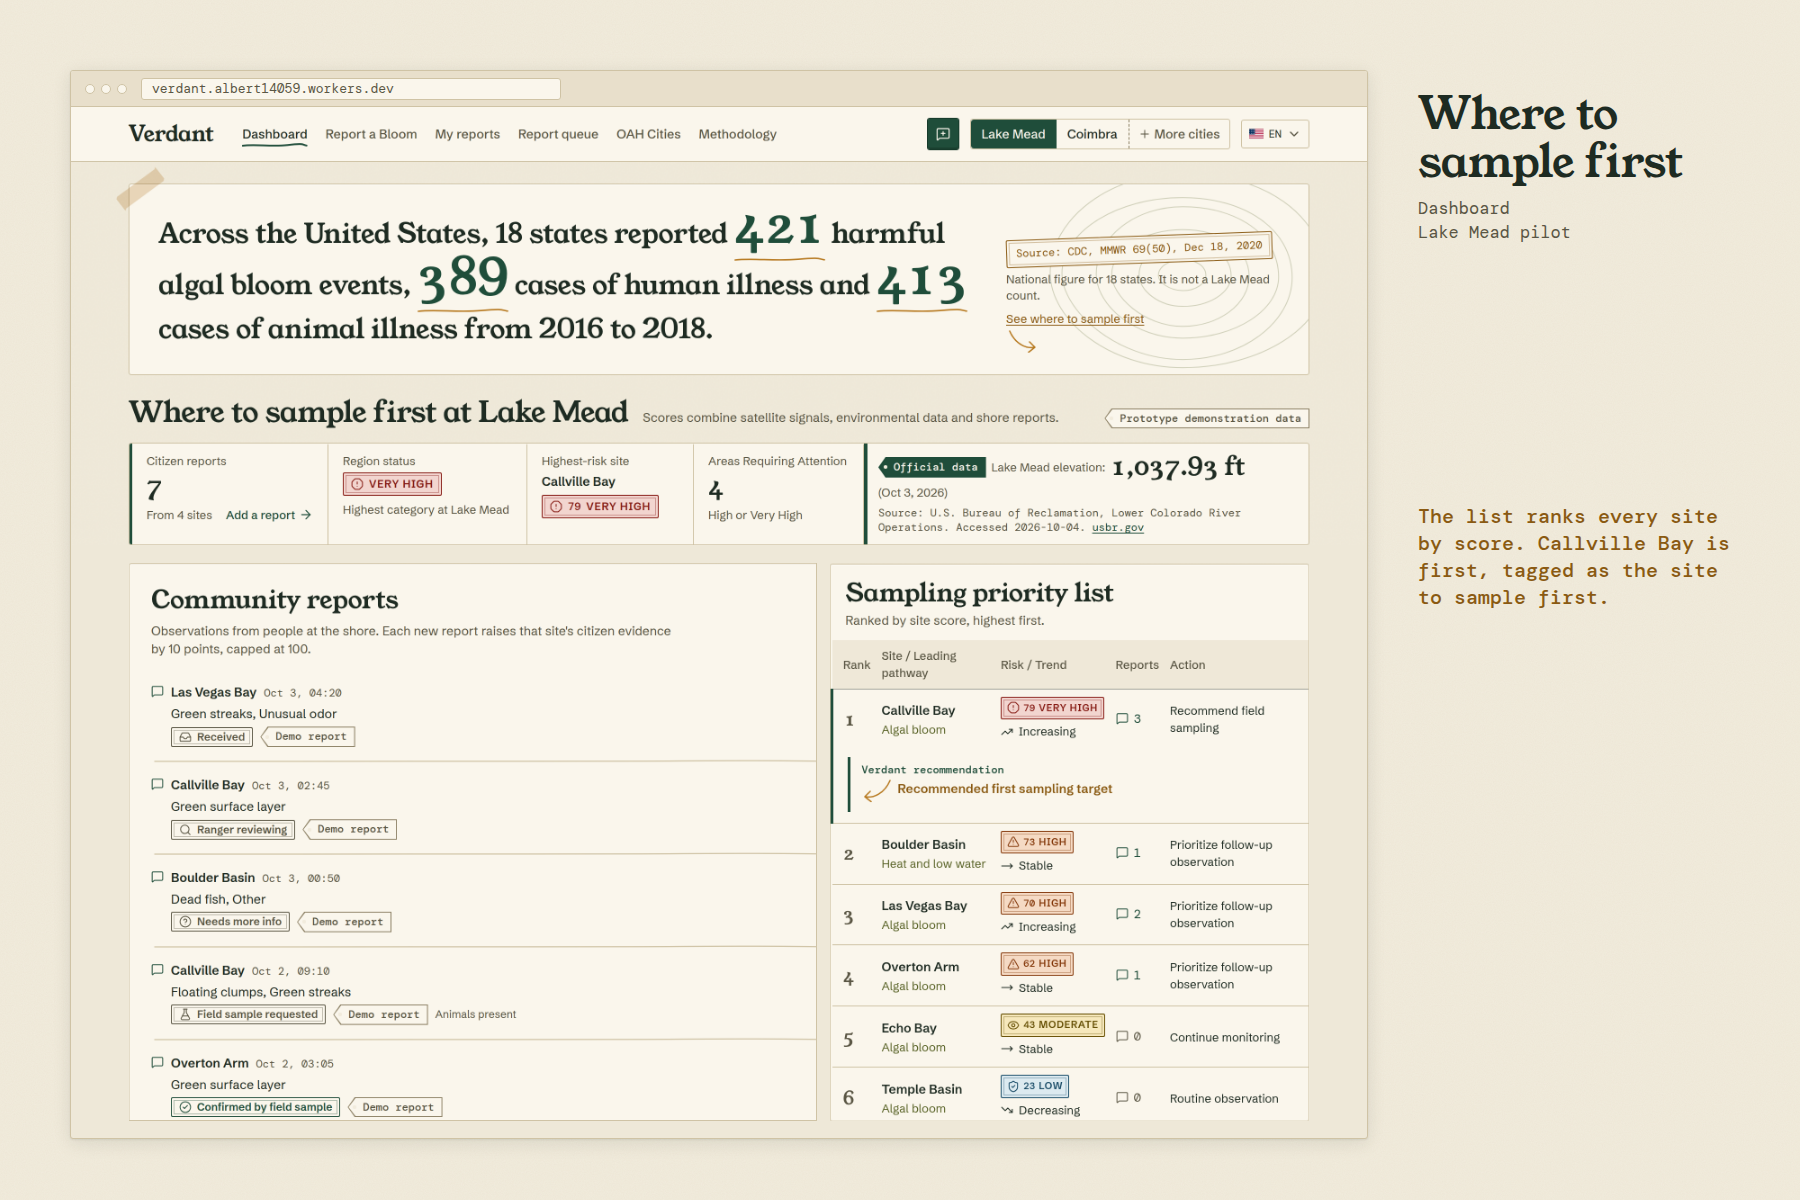
Where to sample first at Lake Mead: the CDC count, a ranked sampling list and shore reports. Prototype demonstration data.
-
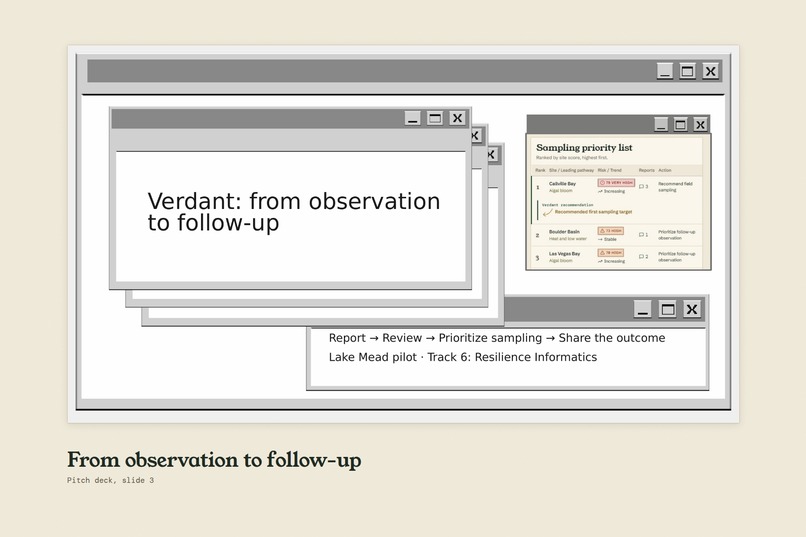
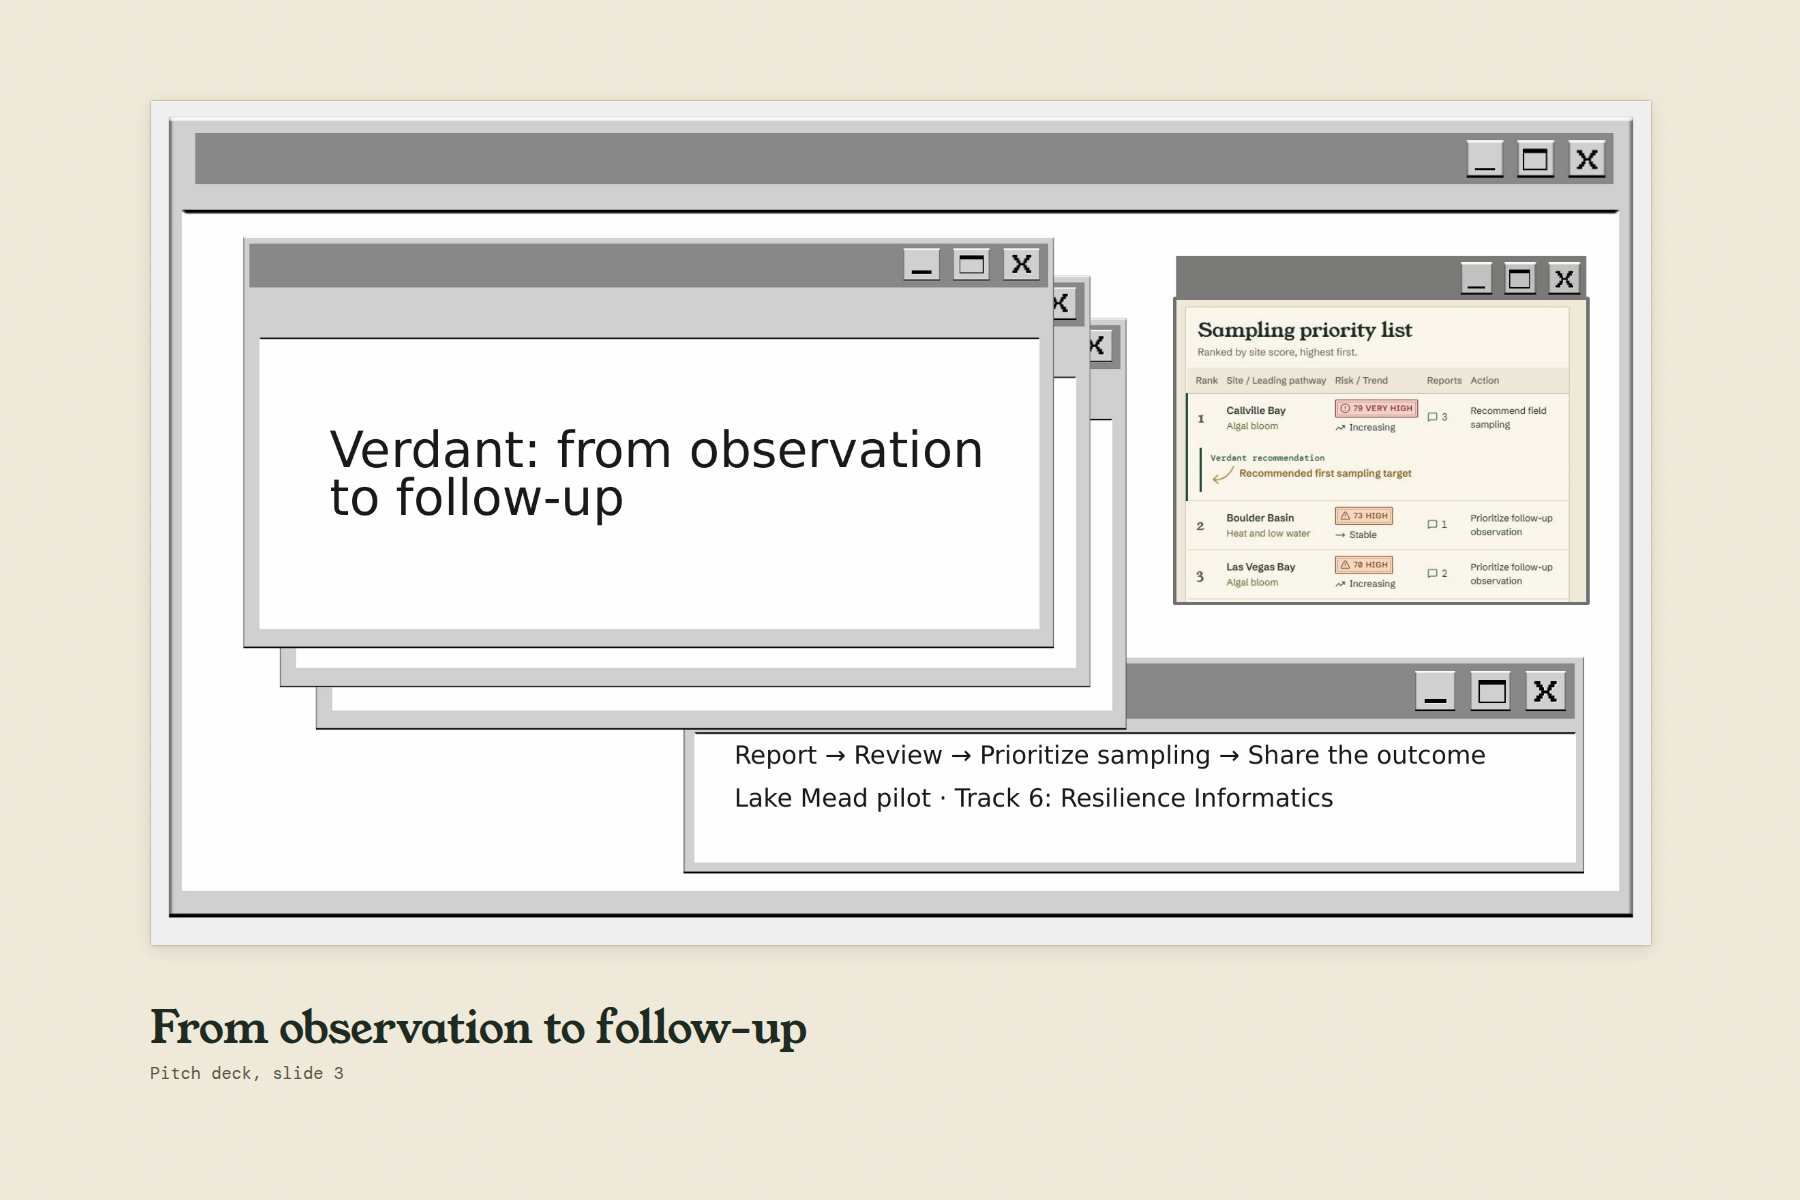
The Verdant loop: report, review, prioritize sampling, share the outcome. Lake Mead pilot, Track 6 Resilience Informatics.
-
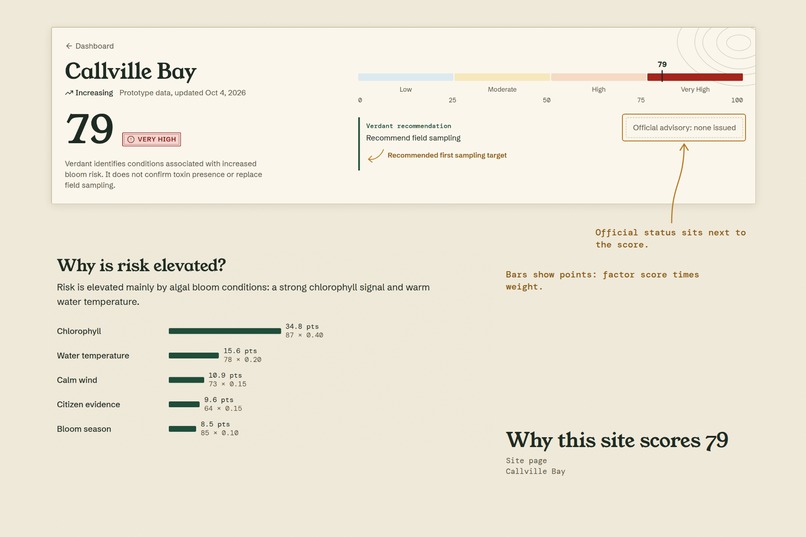
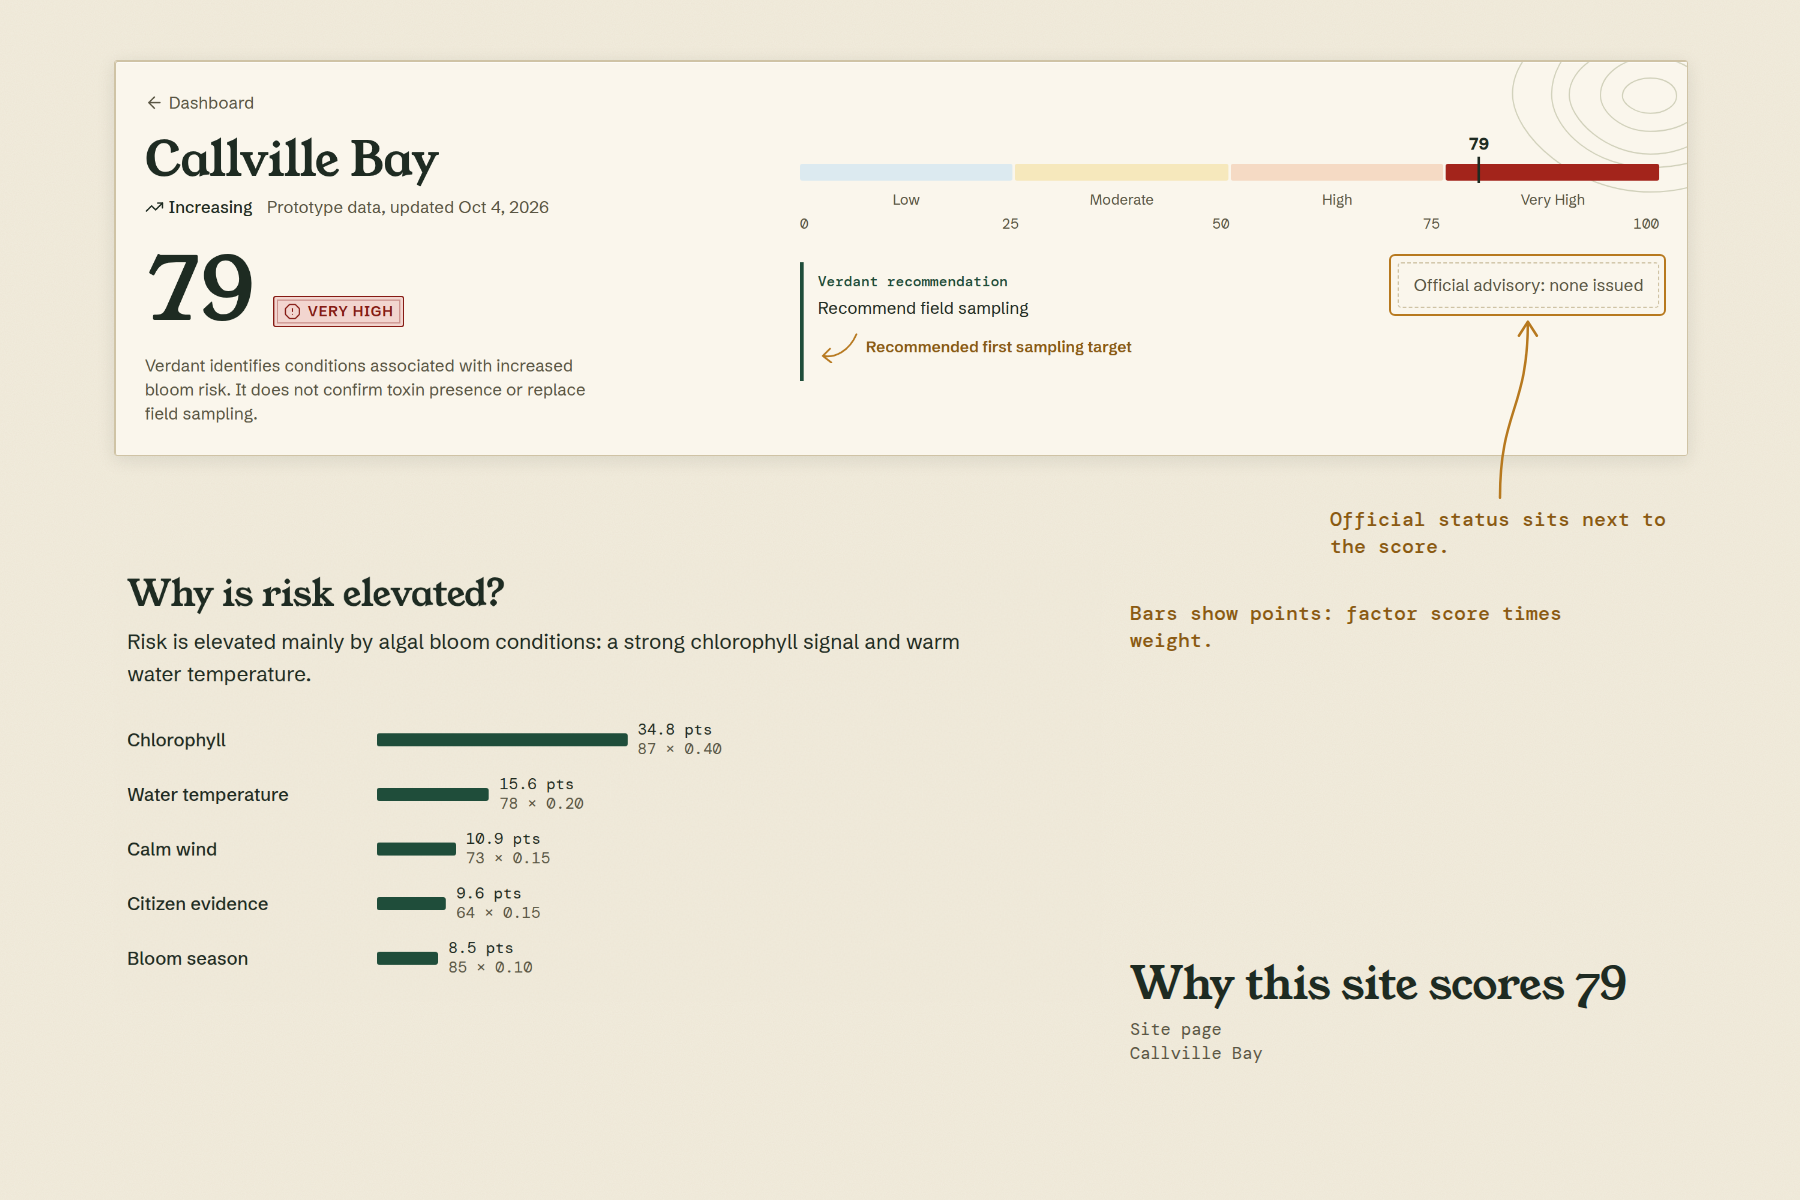
Every score explains itself. Callville Bay is 79, Very High, with factor bars. It shows where to look, not an official advisory.
-
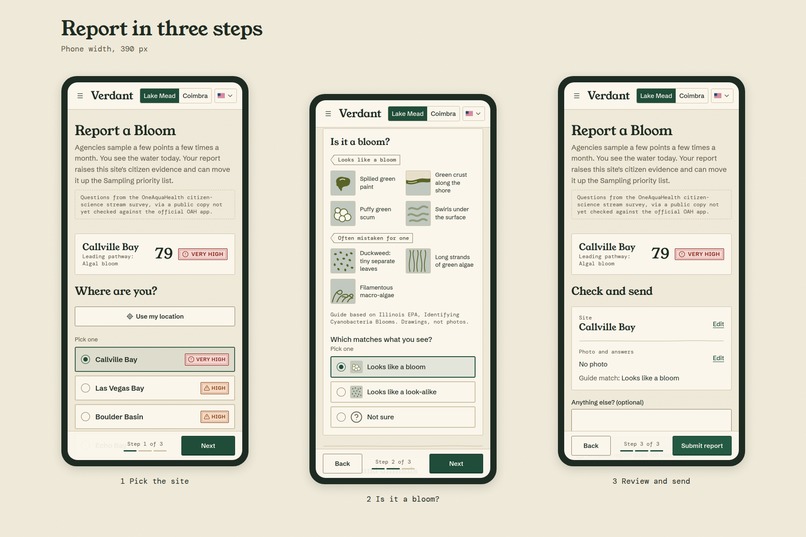
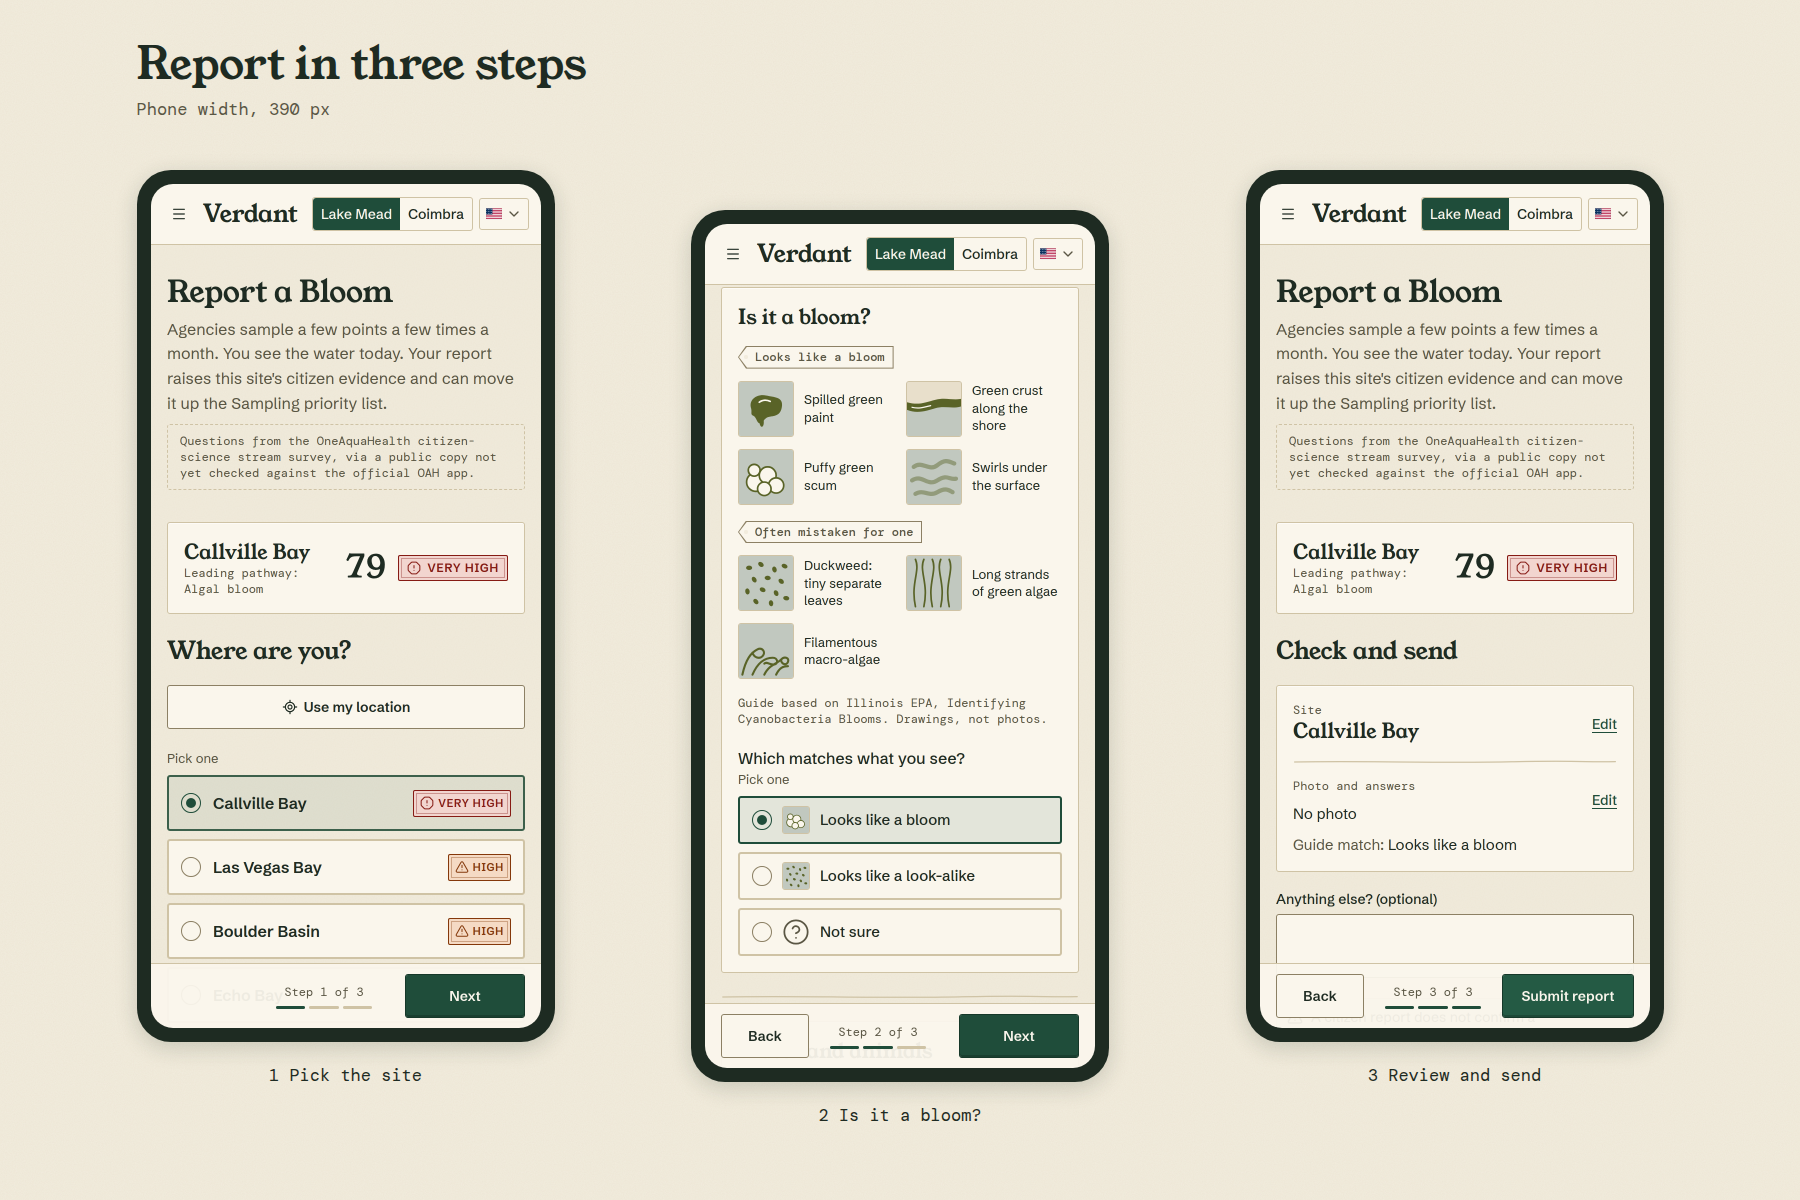
Reporting takes three steps on a phone: pick the site, compare with the "Is it a bloom?" guide, then check and send.
-
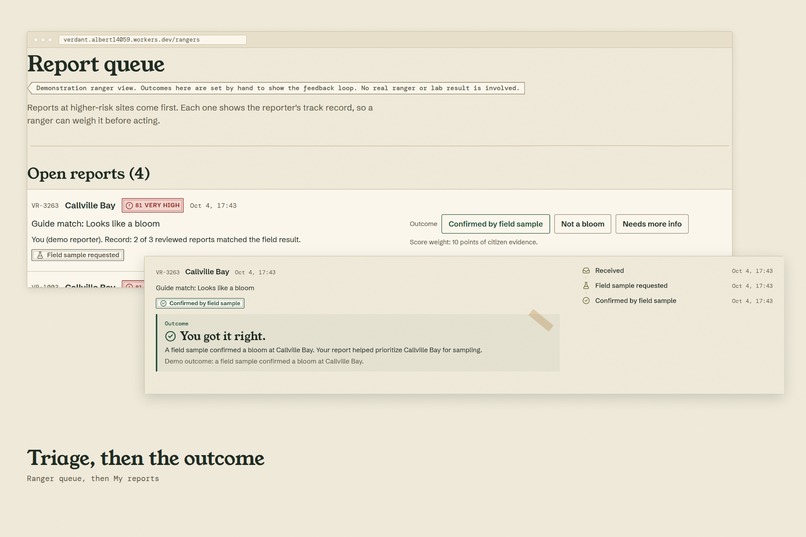
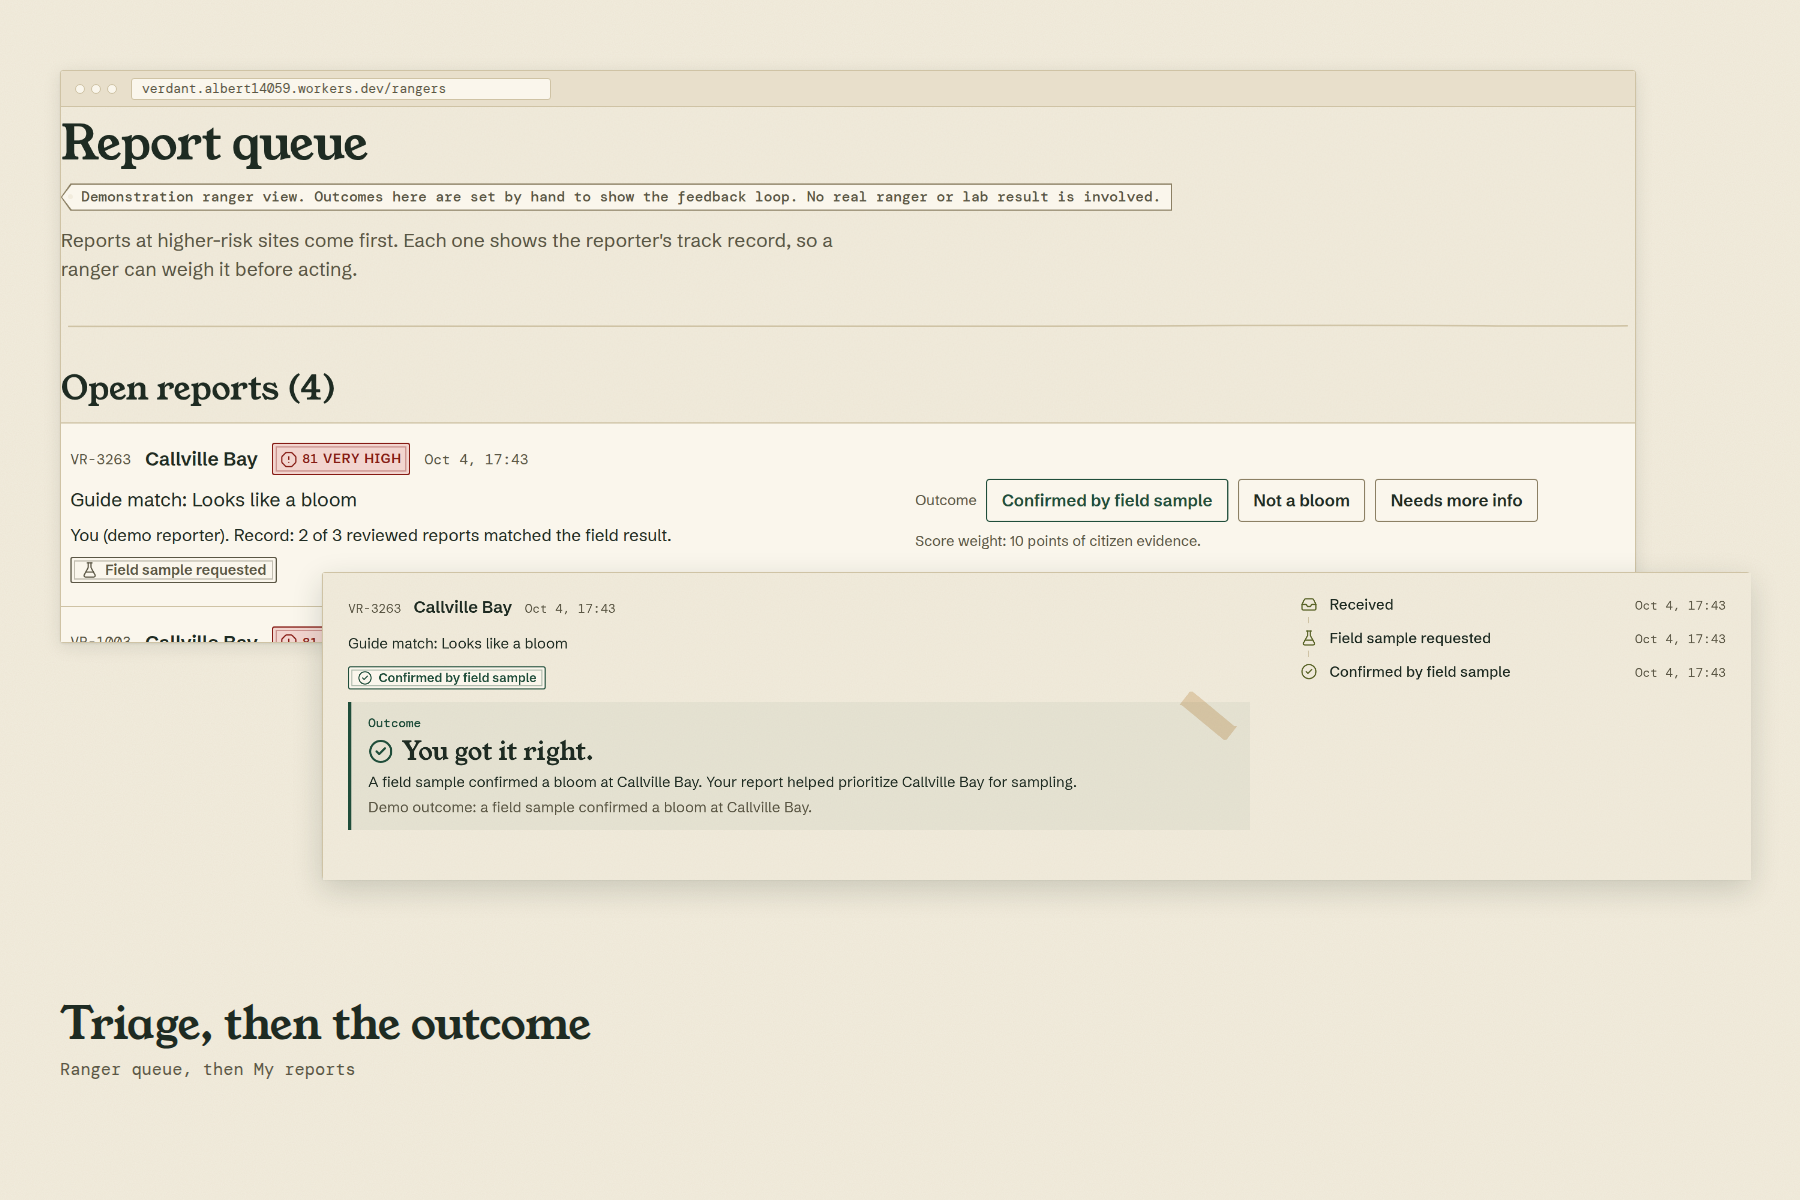
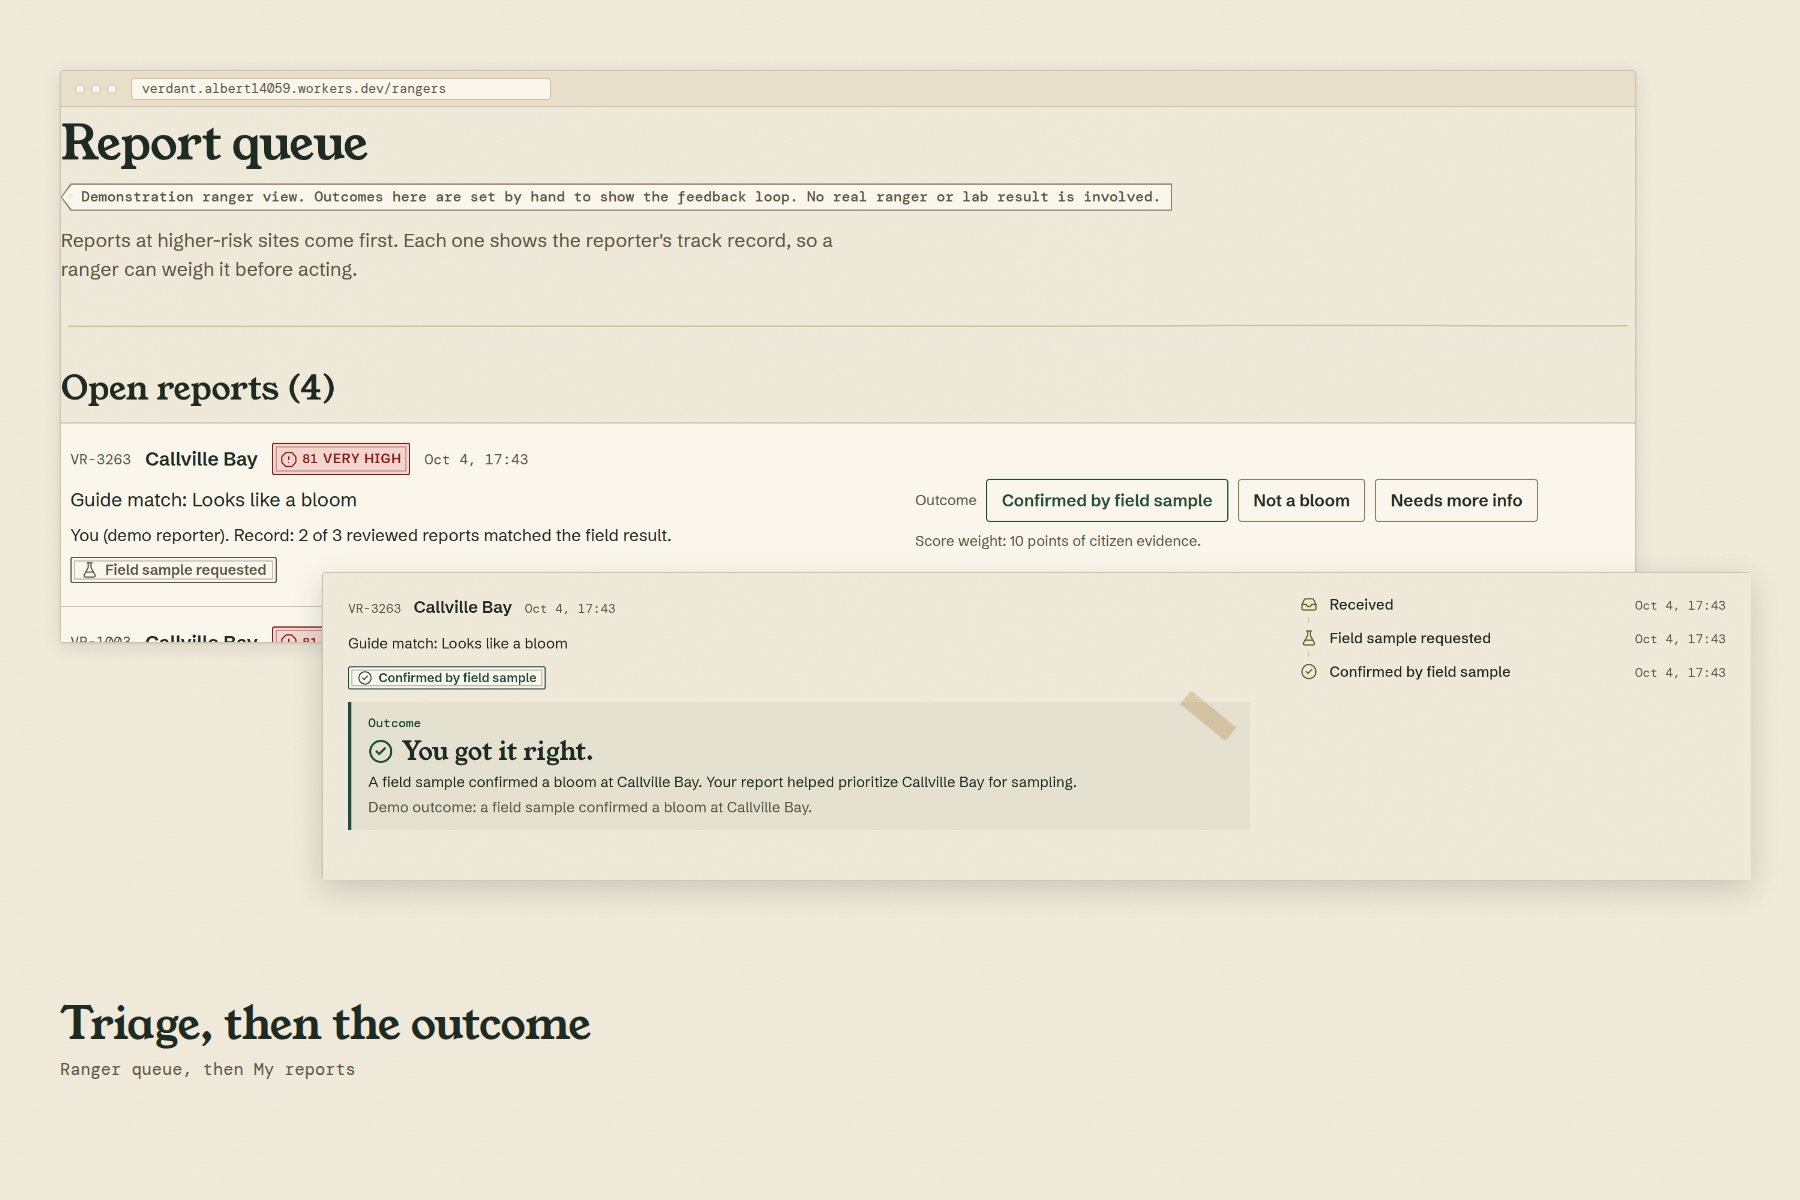
Rangers triage each report, then the reporter sees the outcome: "You got it right." The ranger review shown is simulated.
-
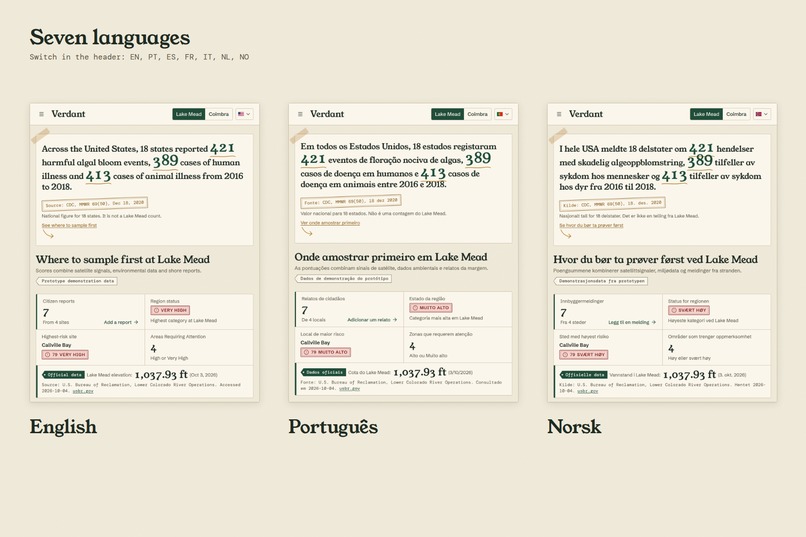
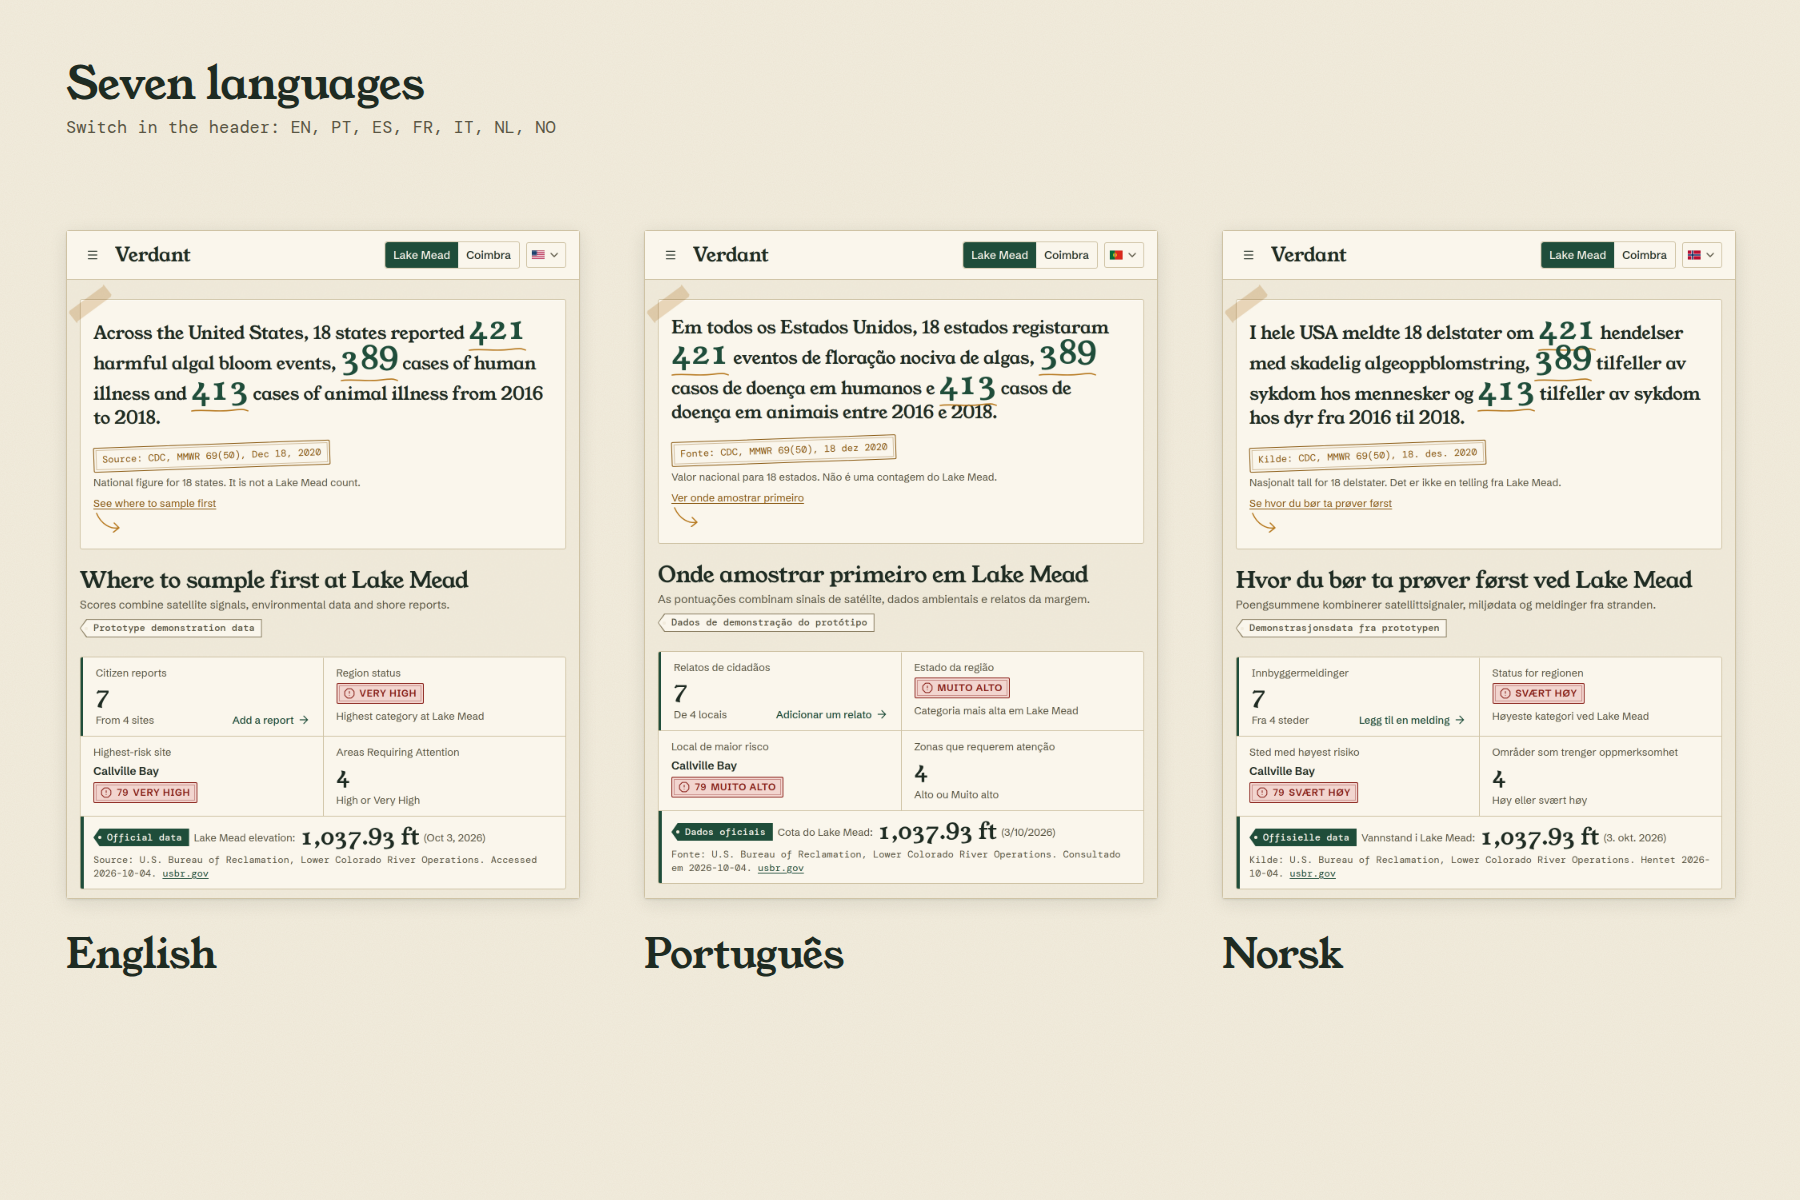
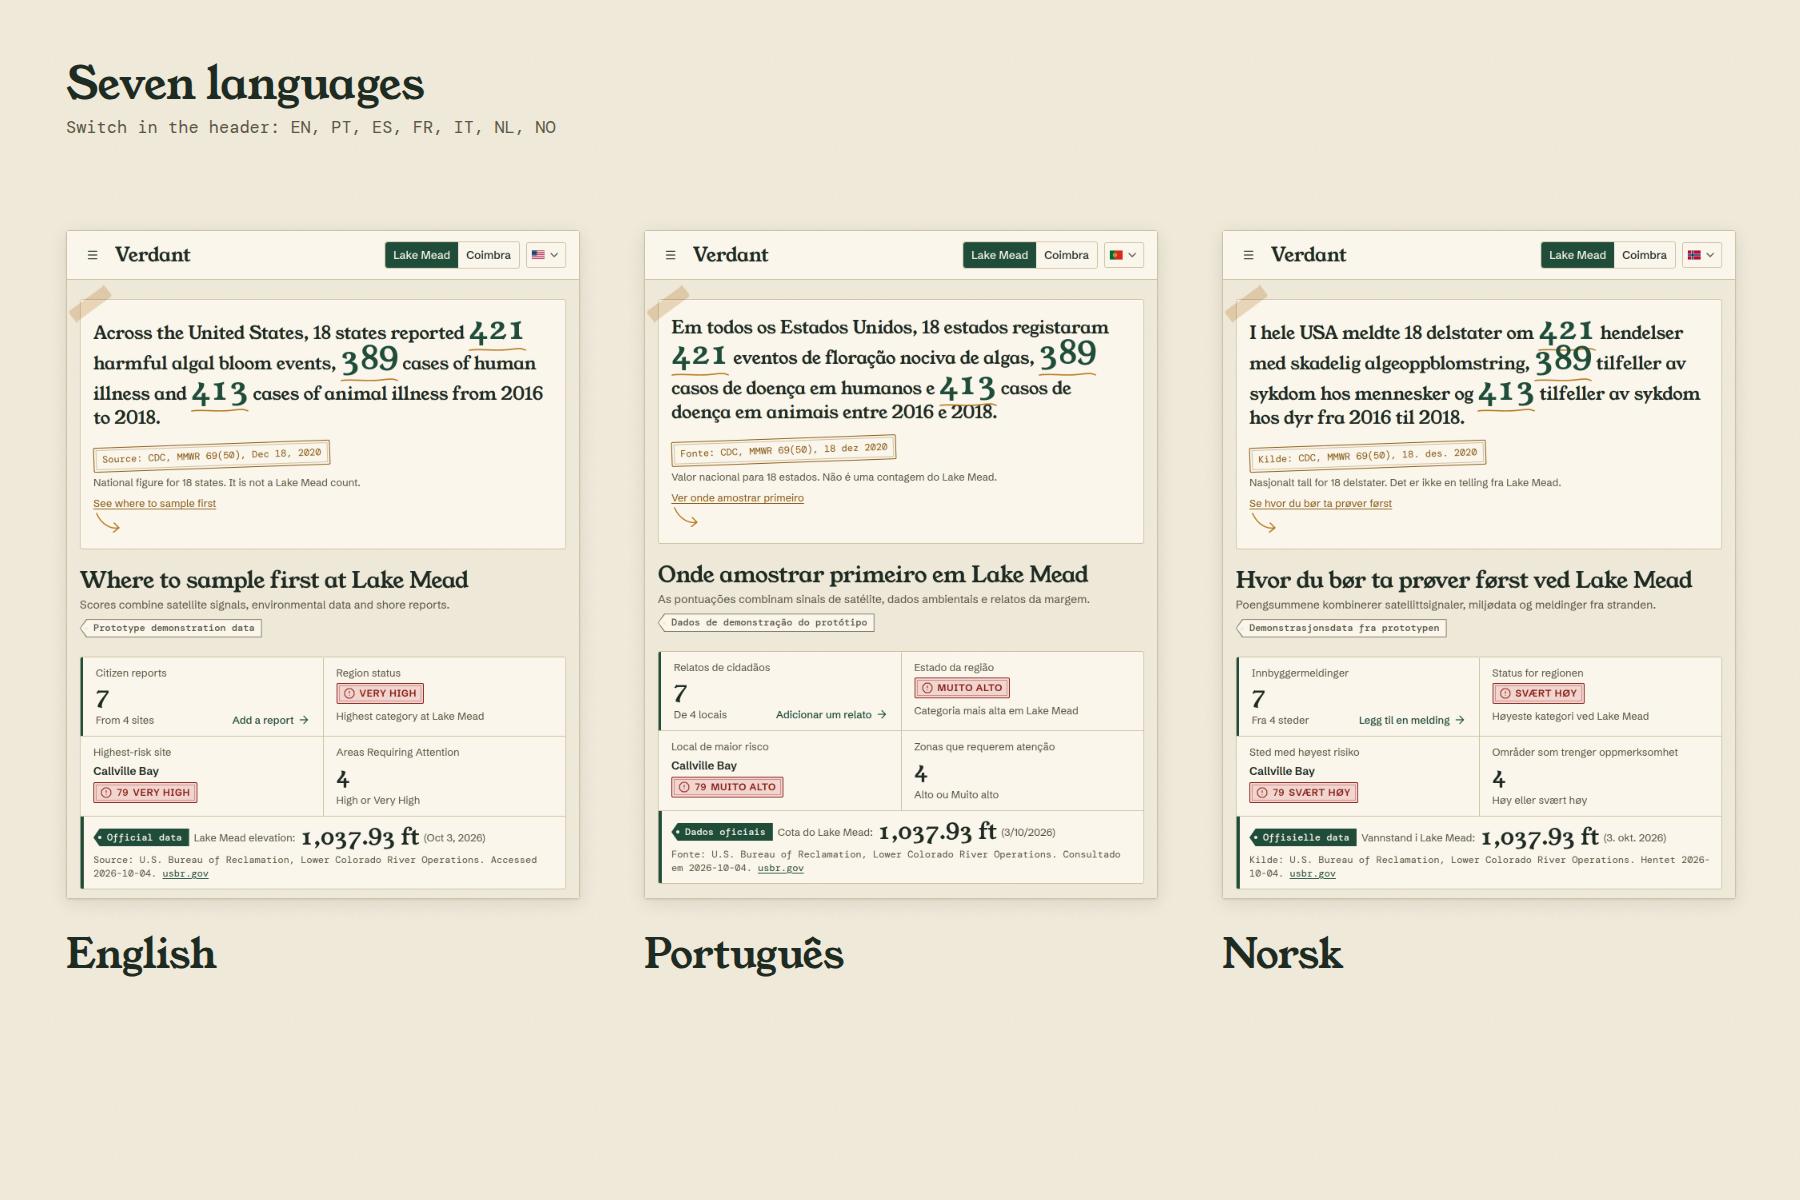
Seven languages from one header switch: English, Portuguese, Spanish, French, Italian, Dutch and Norwegian.

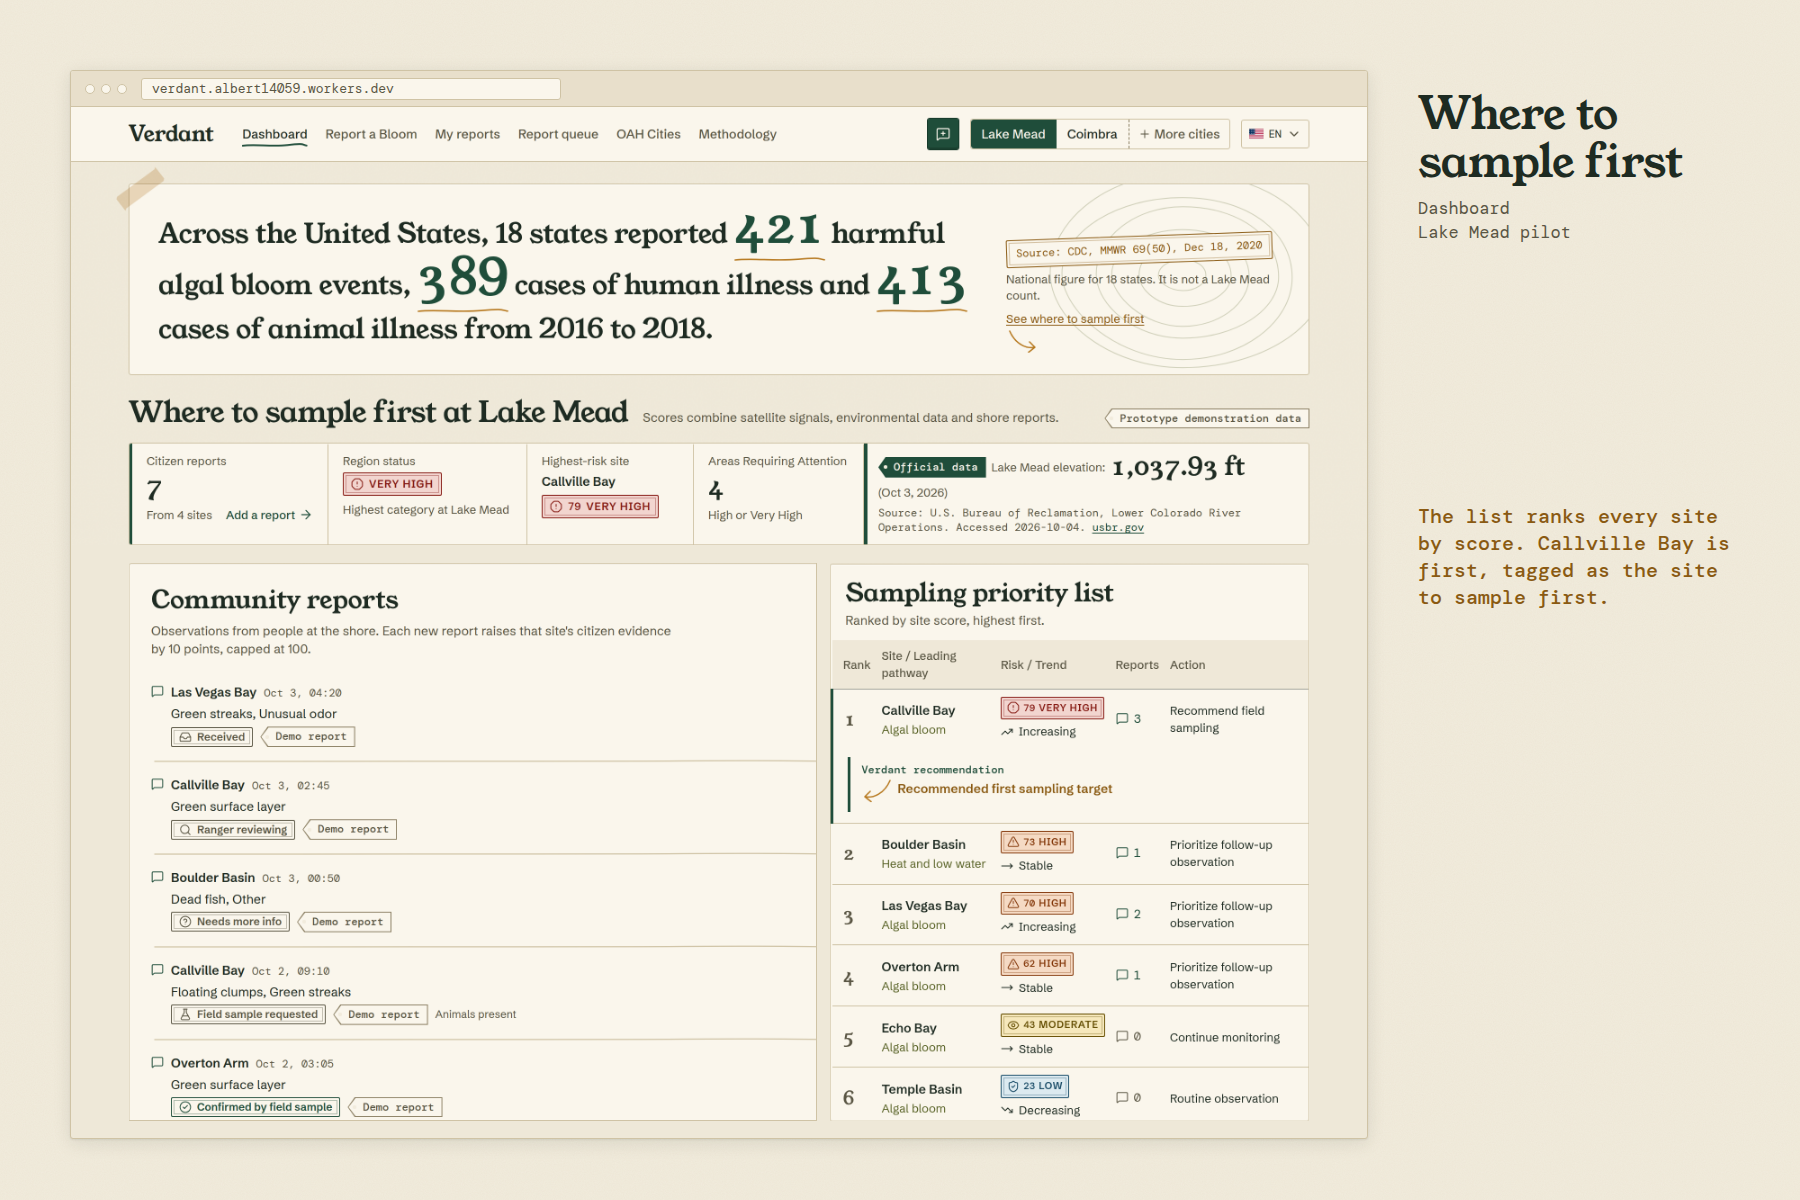
In three years, 18 US states alone reported 389 human and 413 animal illnesses from harmful algal blooms. Verdant shows water managers where to sample first, so a sighting at the shore can become an earlier warning for people and pets. A guided citizen report goes to ranger review, and the reporter sees the outcome.
Inspiration
Water ecosystem health connects people, animals, and the environment. Across eighteen U.S. states, 421 harmful algal bloom events were reported during 2016–2018, alongside 389 human illnesses and at least 413 animal illnesses. These are national figures, not Lake Mead counts (CDC, MMWR 69(50)). Agencies everywhere face the same gap. They cannot watch every shoreline, and the people near the water rarely hear whether their report helped.
We built Verdant to connect those steps: people report, rangers prioritize follow-up, and reporters see the outcome.
What it does
Verdant is a working demonstration of a report-to-outcome workflow, with six pages and an interface in seven languages (English, Portuguese, Spanish, French, Italian, Dutch, Norwegian).
| Step | What happens |
|---|---|
| 1. Find a site | A risk map (Satellite or Map basemap) and a sampling priority list show where follow-up is recommended. |
| 2. Understand the score | Each site breaks its score into factor contributions and names its hazard pathway. |
| 3. Report | A three-step form with a bloom and look-alike guide. Every question and the photo are optional, and the photo can come from the camera or the phone library. |
| 4. Review | A demonstration ranger queue lets users request sampling and record a simulated outcome. |
| 5. See what happened | My reports shows the same report with its status history and outcome. |
Review changes how much a report counts. A new report adds 10 citizen-evidence points, a confirmed one adds 20, and one ruled not a bloom adds 0. Here is Callville Bay:
| Event | Overall score |
|---|---|
| Starting score | 79 |
| Report submitted | 81 |
| Simulated confirmation | 82 |
| Ruled not a bloom instead | back to 79 |
These weights are demonstration rules, not validated. A citizen report never confirms a bloom, and every ranger outcome here is simulated. Verdant flags conditions associated with higher bloom risk. It does not confirm toxins or replace field sampling, and its scores are not an official advisory.
Who it's for
- Reporters: visitors, residents and boaters at a lake or stream, who get a guide for what they see and a status for what they send.
- Rangers and water managers: the staff who decide where to sample first and need reports they can act on.
- Researchers and public-health partners: OneAquaHealth teams who could use consistent, reviewed observations alongside monitoring data.
What is real and what is demonstration data
| Item | Status |
|---|---|
| Lake Mead scores and reports | Demonstration data |
| Lake Mead elevation (1,037.93 ft on 2026-10-03) | Official U.S. Bureau of Reclamation snapshot, labelled separately |
| Coimbra satellite chart | Real Resilience Map export (monthly NDVI and NDWI area means) |
| Coimbra site scores | Synthetic; the chart does not drive them |
| Review outcomes | Simulated |
| Translations (pt, es, fr, it, nl, nb) | Machine-drafted, pending native-speaker review |
| FHIR-shaped JSON export | Demonstration format, not validated against the OneAquaHealth guide |
How we built it
React, TypeScript and Vite, with Leaflet maps, Recharts charts, PapaParse for CSV parsing and Tailwind with shadcn components. The scoring engine is tested TypeScript with fixed, published weights, and a separate tested module applies the review weights. A tested parser reads Resilience Map CSV exports. Each region is one config object, so the same app runs Lake Mead and Coimbra. The interface strings live in one typed dictionary per language. The project has 151 automated tests in 20 files. There is no backend: reports stay in the browser's local storage.
Challenges
- Area-level data. The Coimbra export holds monthly area means, not the site-level measurements scoring needs. We kept the real chart and gave the 20 sites real Resilience Map names with synthetic scores, labelled as such.
- Recommendation versus advisory. A sampling priority is not a confirmed hazard or an official advisory. We worded every score as "where to look first" and put the disclaimer next to it.
- Seven languages. Each language is a typed copy of the English dictionary, so a missing key fails the type check. The six translations are still machine drafts, and some phrasing needs native review.
- Open verification. We could not retrieve the official OneAquaHealth survey fields, so some report questions are placeholders, and the FHIR guide's profile ids are unverified. Duplicate and malicious reports are unsolved.
Accomplishments
- A full loop from guided report to simulated ranger review to the reporter's status history.
- Review-weighted evidence with a tested example: 79, 81, 82, and back to 79.
- Scores that explain themselves, factor by factor.
- One engine for Lake Mead and Coimbra, switched by config.
- A tested seven-language interface, a Satellite or Map basemap that remembers its setting, and a layout that works on a phone.
What we learned
A score is more useful when people can see why it is high. A report is worth sending when the reporter sees what it led to. Weighting evidence by review status also made us decide what a citizen report is worth, and that choice needs field data before anyone should rely on it. A working demonstration is the first step, and testing with citizens and rangers comes before operational use.
What's next
- Test with citizens and rangers: reporting completion, clarity, and usefulness for review.
- Validate scores against field measurements and revise the weights.
- Add shared storage, ranger accounts, and privacy controls.
- Handle duplicates, location uncertainty, and malicious reports.
- Verify OneAquaHealth fields, add live satellite and weather feeds, and validate exports with partners. None of these exist today.
- Have native speakers review the translations.
Impact & Alignment with the OneAquaHealth mission
Verdant supports OneAquaHealth and Track 6: Resilience Informatics. It turns scattered citizen and environmental signals into explainable monitoring priorities for freshwater sites, and it supports monitoring, protection and awareness by keeping water, human, animal and environmental health on one screen.
Expected impact on ecosystems and human health. Blooms threaten the water that people, pets and wildlife depend on. Verdant aims to shorten the time between someone seeing a bloom and someone qualified deciding whether to sample: clearer reports, a ranked list of sites, and visible follow-up. Earlier sampling can mean earlier warnings for people and animals, and a record that links water conditions to human and animal health, the One Health idea behind the program. We have not measured any of this, and field validation comes first.
Lake Mead is the US pilot and Coimbra, Portugal, is a OneAquaHealth case-study city. Benevento, Ghent, Oslo, and Toulouse are configured and need site data. The header already shows "More cities soon".
Innovation & Creativity
Citizen science often ends when the report is sent. In Verdant the report keeps going. An observation enters review, its review status changes its weight in the score, and the reporter sees the outcome. The bloom guide, score explanations, and status timeline make that loop readable to both reporters and rangers.
Architecture
The engine combines pathway factors with fixed weights, handles partial data, and explains each contribution. Separate modules cover the report lifecycle, the CSV parser, the basemap choice, and a FHIR-shaped JSON export. Everything is typed, and the logic is covered by the 151 tests. It draws on CDC counts (cited), a U.S. Bureau of Reclamation elevation snapshot, a Resilience Map CSV export for Coimbra, and Esri map tiles. The next milestone is a shared service for citizens and rangers in place of one browser.
UX
The path is map, explanation, report, outcome. The interface offers a header language switch with flags and a Satellite or Map toggle. The report form has three steps and optional answers. Controls carry screen-reader labels, the switches work from the keyboard, and layouts adapt to phone screens. We have not tested accessibility or usability with intended users yet.
Scale
The region config is the unit of reuse. A new city needs site coordinates, suitable data (such as a Resilience Map CSV and a column map), a validated scoring model, and a local review process. Existing systems connect through the CSV import and the FHIR-shaped export, and both need validation with partners. There is no server to run today. We would start with a small agency-supported pilot, measure report quality and ranger workload, and expand from there.
With appreciation to the OneAquaHealth team and the hackathon organizers, whose challenge shaped this project, and to the CDC, the U.S. Bureau of Reclamation, Esri and the Resilience Map, whose data it runs on:
Thank you!
Made by Albert Dang, Michu Zaki, & Nathan Diep.
Live prototype · Methodology and sources · GitHub repository
Built With
- cloudflare-workers
- fhir
- leaflet.js
- papaparse
- react
- react-router
- recharts
- shadcn-ui
- tailwindcss
- typescript
- vite
- vitest


Log in or sign up for Devpost to join the conversation.