-
-
system_architecture
-
scientific_pipeline
-
stoichiometric_coverage
-
deployment_architecture
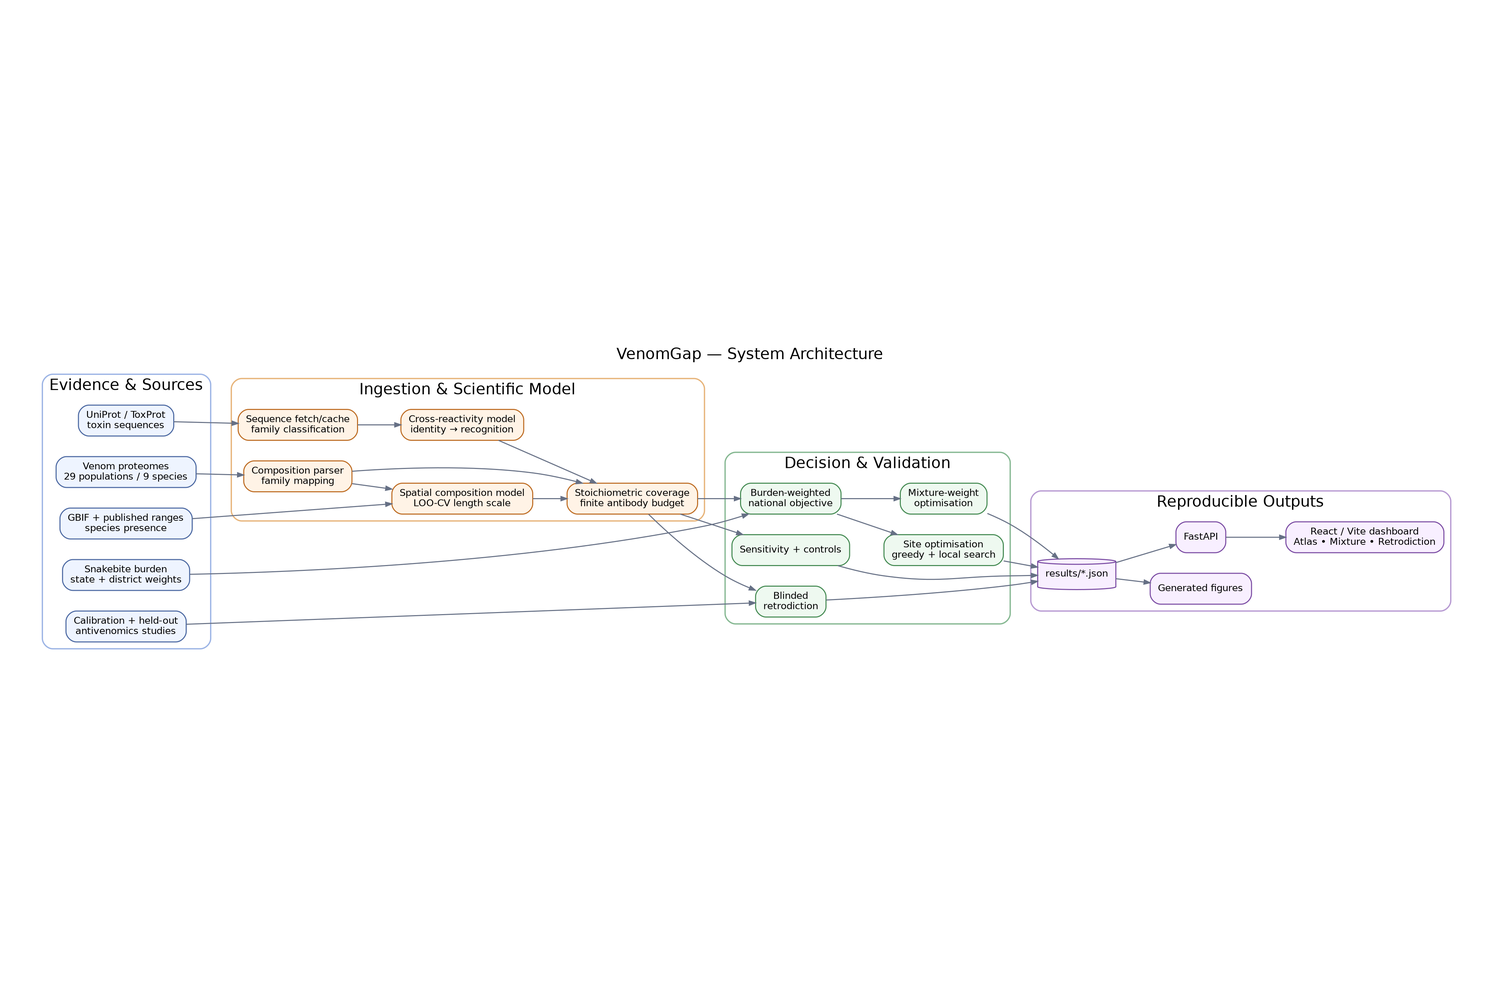
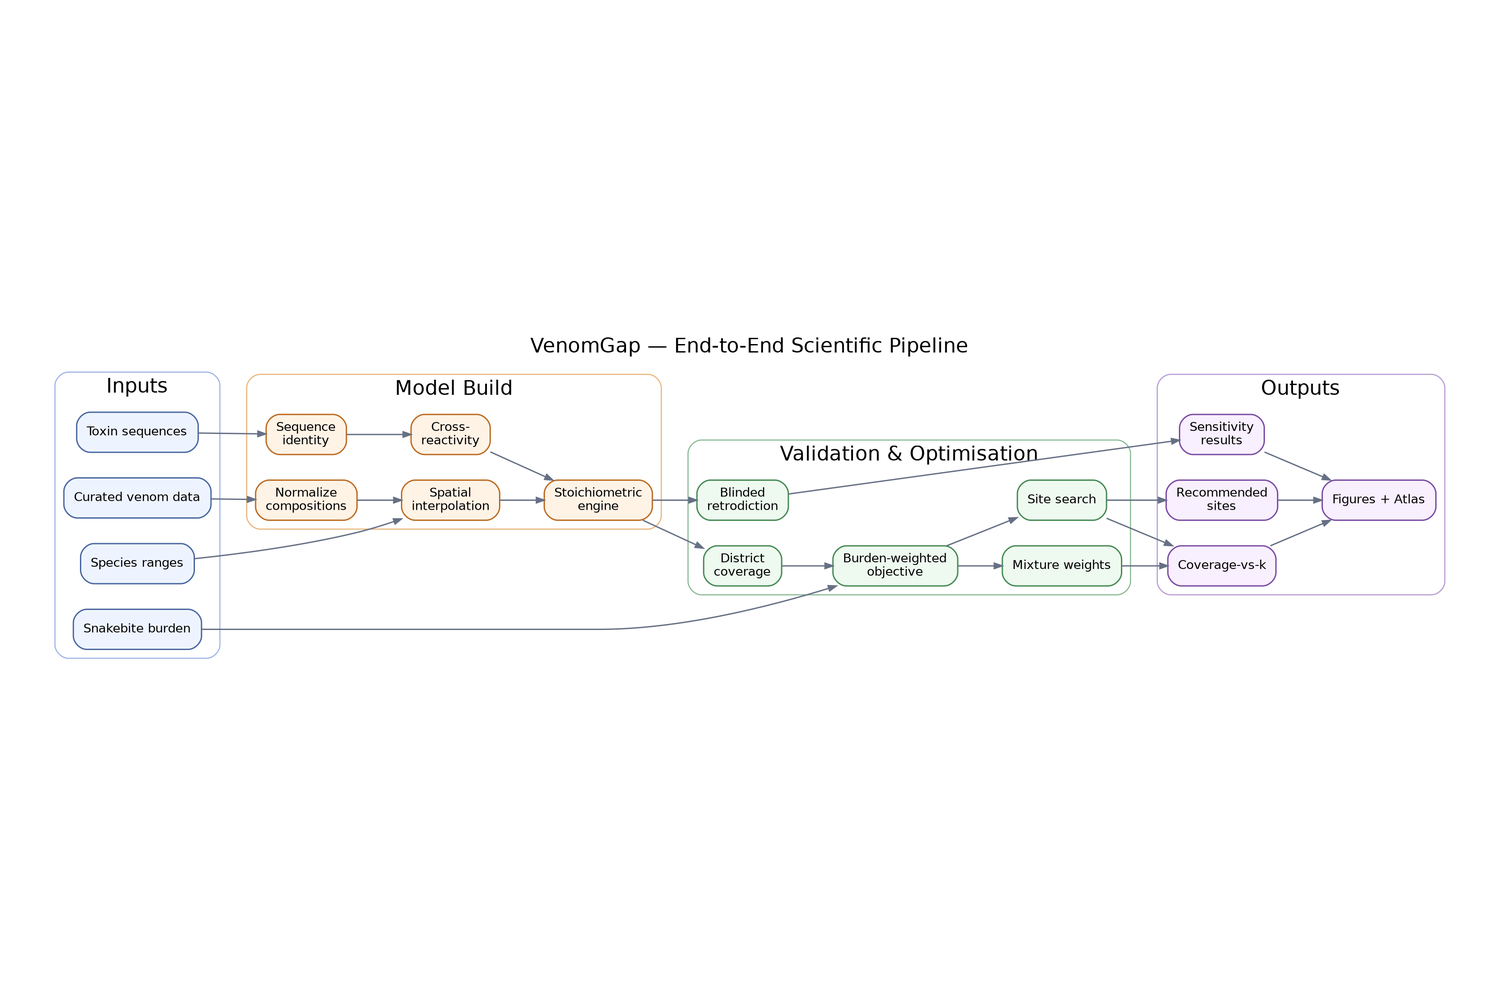
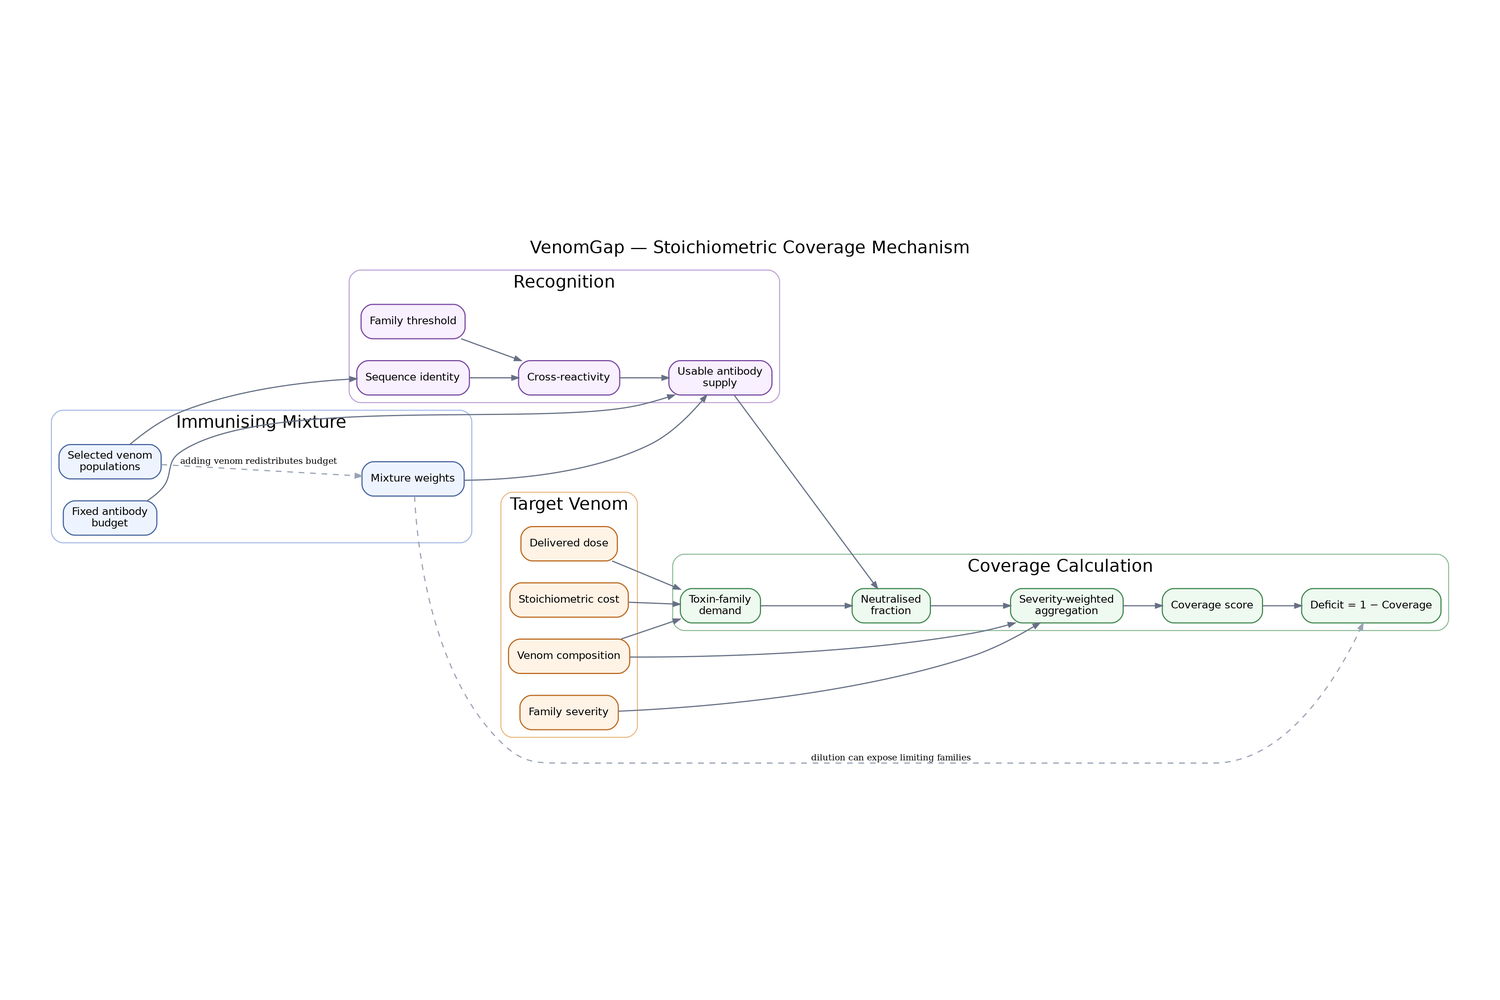
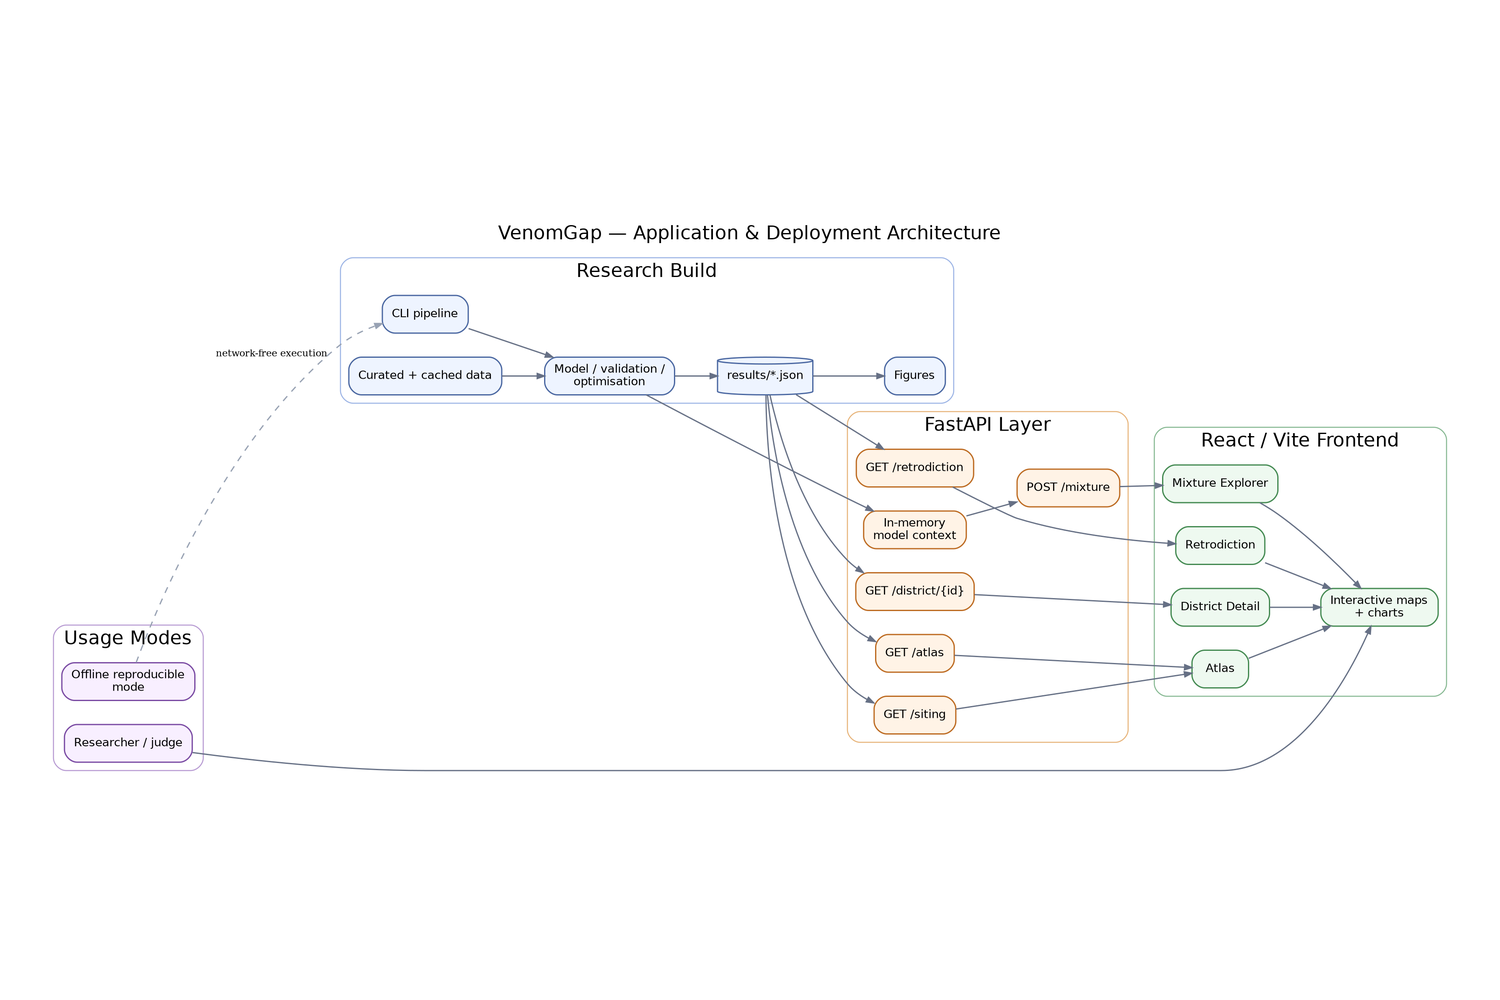
Inspiration
India loses roughly 58,000 people a year to snakebite. Its only antivenom is raised on venom pooled from four species collected almost entirely from one cooperative in Tamil Nadu, while the country has eight manufacturers and essentially one venom source.
The thing that got us started was noticing that this is a shape of problem machine learning already has a vocabulary for. The immunogen mixture is a training distribution. The snake that actually bit the patient is the test distribution. Clinical treatment failure is generalisation error. Nobody had written it down that way, and covariate shift is a measurable, solvable thing.
The existing literature scores antivenom-venom match by cosine similarity between composition vectors. That bothered us, because neutralisation is a binding problem with a finite reagent, and a geometric metric has no supply constraint. It physically cannot represent the fact, experimentally reported in 2021, that adding venoms to an immunising mixture can make an antivenom worse.
What it does
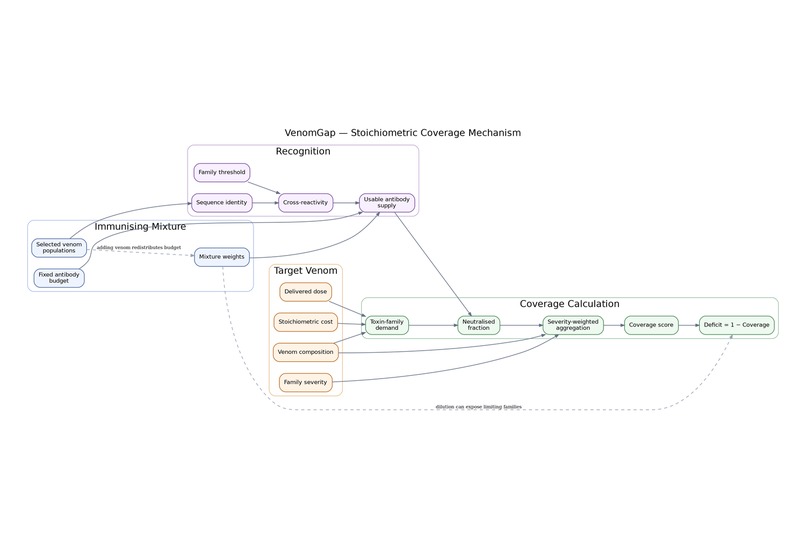
VenomGap models neutralisation as a limiting-reagent problem. A vial holds a fixed mass of antibody, partitioned across toxin families in proportion to what was injected into the horse:
supply_f = B · Σ_q w_q · a_qf antibody allocated to family f eff_f = B · Σ_q w_q · a_qf · x_f(q→p) of which is usable against this venom demand_f = D · a_pf · κ_f what the incoming venom needs n_f = min(1, eff_f / demand_f) C = Σ_f σ_f·a_pf·n_f ⁄ Σ_f σ_f·a_pf
Three properties fall out of that form with nothing fitted to produce them: it is non-monotone in mixture size, dose-dependent, and saturating.
It ships three things:
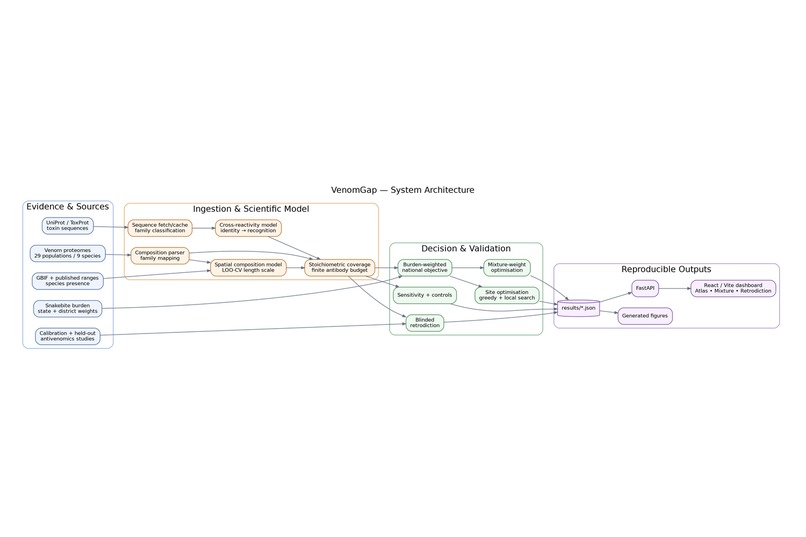
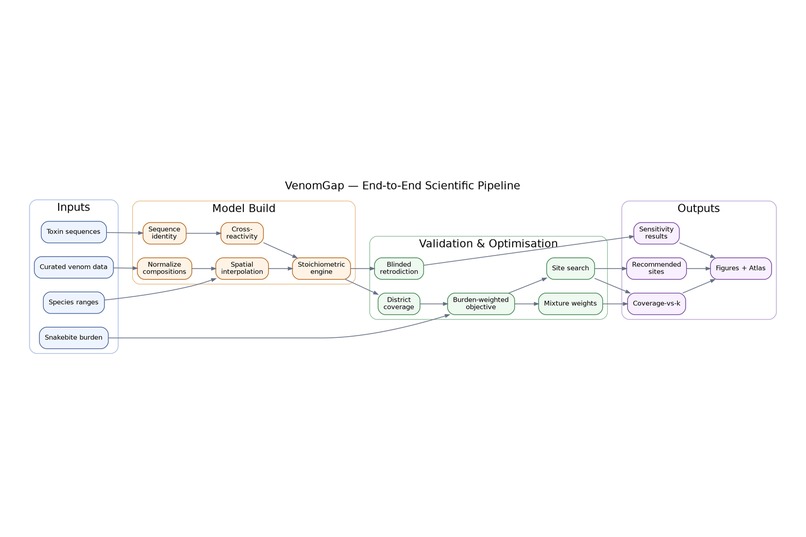
A deficit atlas. 594 Indian districts scored from 29 published venom proteomes and UniProt/ToxProt sequences. National burden-weighted coverage is 66.2%. Districts with no usable nearby proteome are grey and labelled unknown, never green. A blinded retrodiction. Four published antivenom-failure findings held out before any parameter was fitted, with a guard in the calibration code that raises if a held-out row reaches a fit. A siting optimiser. Given budget for k new collection centres, where do they go to maximise burden-weighted national coverage.
The live page recomputes everything in the browser. Tick two venoms into the mixture and watch coverage fall from 66% to 55.5%.
How we built it
Strict build order, because the model had to earn its place before any data work.
The model first. coverage.py plus 24 tests that check closed-form consequences, not that the code runs. The load-bearing one: adding a venom sharing no families with the target halves the antibody raised against it, so coverage must drop. A companion test shows the penalty vanishes once the budget is unlimited, proving it's a budget effect and not a penalty on mixture size for its own sake.
Pre-registration before fitting. experiments/preregistration.md fixes the model form, the split and the exact pass criteria for R1 to R4, committed at a3cb96c with the hash recorded in the results.
Then the data. 29 population-level proteomes, 9 species, 14 states, 6 studies, every row carrying a DOI, a table reference, an access date and a method. Cross-reactivity from 82 between-species sequence identities computed by Needleman-Wunsch over ToxProt entries. Burden weights from the Million Death Study.
Parameters. σf frozen a priori with a written rationale per family. κf's shape fixed by molar equivalence: a 7 kDa three-finger toxin costs about 7 times more antibody mass per mg than a 47 kDa metalloproteinase. Only a single global scale was ever fitted.
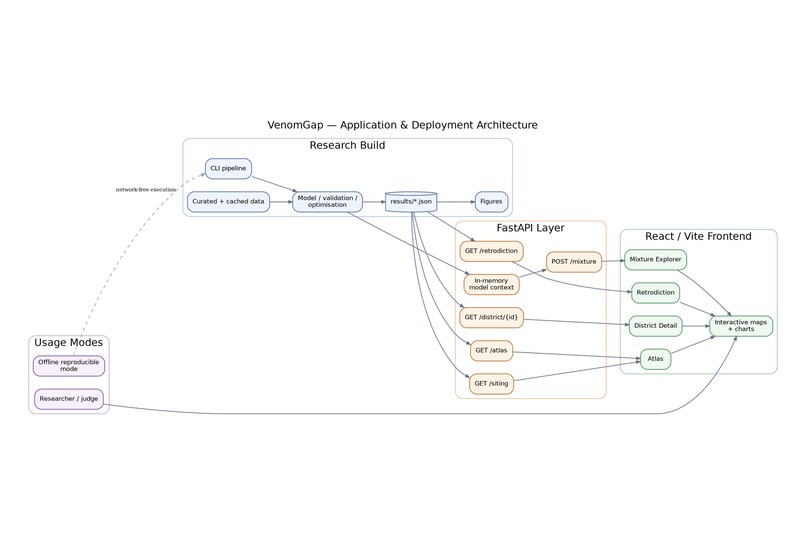
Stack. Python (NumPy/SciPy/pandas/pydantic/Biopython) for the model, FastAPI plus React/TypeScript for the local app, and a port of the model to JavaScript so the hosted page needs no backend at all.
Challenges we ran into
The data is in supplementary Word documents. Family-level proteome tables aren't in any API. We wrote parsers for PLOS .docx supplements and MDPI PDFs, and hit a case where PDF extraction was inserting newlines between individual characters and truncating decimals.
Two studies flatly disagree. Rajasthan Echis carinatus sochureki is reported at SVMP 55% to 67% by one paper and 3% by another. We curated both, wrote a test asserting the conflict still exists, and filed a pre-registration amendment defining how R1 is evaluated across them, rather than quietly picking the one that suited us.
A parameter we pre-registered as fitted turned out to be unfittable. θ_f, the sequence-recognition floor, has a data sensitivity of exactly zero. The calibration targets are populations of species already in the immunogen set, where cross-reactivity is 1 by construction, so θ has no purchase. Our first identifiability probe reported everything as identified, because it was measuring the L2 regulariser rather than the evidence.
Two bugs that would have silently produced wrong results. Limiting families were tie-broken alphabetically, so when cross-reactivity zeroes out and many families sit at exactly n_f = 0, the alphabet decided the answer. It reported CTL where SVMP contributed 76% of the deficit. And k was selecting k sites total instead of k new sites, so k=1 scored below k=0. That one was invisible in a JSON file and obvious the second we plotted it.
Our own ablation was a straw man. The first cosine baseline used a weighted-mean form that declines with mixture size for a purely arithmetic reason. It looked like the baseline reproduced the dilution effect. We rewrote it in the best-match form the literature actually uses, the strongest version of the comparison, and it is monotone non-decreasing, exactly as the criterion needed.
Accomplishments that we're proud of
The mechanism works. Coverage peaks at |S| = 4 and falls 0.027 thereafter. The cosine baseline, on identical inputs, rises monotonically from 0.729 to 0.949 and has no interior maximum at all. We reproduced an experimentally observed phenomenon the model was never told about.
One parameter was fitted. κscale = 0.784. σf, the κf shape and every θf keep a priori values. An unfitted consistency check passes on top: the molar-equivalence κ shape alone reproduces the published ordering of well- against poorly-recognised toxin families across all 8 pairwise checks, zero violations.
We reported 1 of 4 and diagnosed the misses in numbers. θ = 0.65 exceeds 92.7% of the 82 measured between-species identities, so cross-reactivity is forced to zero almost everywhere. The sharpest case is R2b: the sequence data does rank N. kaouthia closer to N. sagittifera (0.388) than N. naja is (0.278), independently recovering the held-out paper's phylogenetic claim, but the recognition floor discards that ordering before it can act. A specific, fixable diagnosis, not a shrug.
A publishable negative result. The kernel length scale fits to 1600 km with a plateau running past the length of India. At current sampling density, geographic distance carries almost no predictive power for venom composition. You cannot infer regional venom composition from what has been published. You have to go and measure it.
It's reproducible to the byte. 95 tests, mypy strict on 30 files, the full pipeline runs offline with VENOMGAP_OFFLINE=1, and every results file and figure regenerates byte-identical. Every number in the README is generated from results/*.json by a script that CI runs with --check.
What we learned
Implement your ablation in its strongest form. A straw man that fails proves nothing. The comparison is only worth making against the version a critic would defend.
Measure identifiability; don't assume it. An unidentified parameter sitting at its prior looks exactly like a tuned one unless the report distinguishes them. And probe the data term alone. Probing the full objective just measures your own regulariser.
Plot the headline curve early. A number in a JSON file can be wrong in a way a chart makes obvious in one second.
Extend the grid past the plausible range before reporting an optimum. An edge solution and a plateau are indistinguishable from inside a short grid.
An honest 1/4 with a diagnosis is a stronger scientific object than a 4/4 that arrived after tuning. That was the pre-registration's whole point, and we only found out it was true by having to use it.
What's next for VenomGap
Fix the identified failure, pre-registered. Replace mean-pairwise identity with best-match identity across a family, the mechanistically correct statistic for a polyclonal antivenom, and on the same scale as the θ prior. We deliberately did not make this change after seeing the retrodiction; it goes in a fresh pre-registration so the second test is as blind as the first.
Close the krait gap. Only two Bungarus caeruleus proteomes exist, and one of them is the R3 target, so the interpolated immunogen is built partly from the population under test. No amount of modelling fixes that. It needs a South Indian krait proteome.
Publish the proteome at the source. No complete family-level proteome exists for any Big Four species at the locality the venom is actually collected from. That absence is measurable, and it is the single cheapest experiment on this list.
Wet-lab validation of the dilution curve. The turnover point is a falsifiable prediction. An antivenomics series over mixtures of increasing size would confirm or kill it.
Submit it. Target is PLOS NTD or Toxins, both open access, both already publishing the primary literature this builds on. experiments/paper_skeleton.md maps every section to the result file and figure that supplies its numbers.

Log in or sign up for Devpost to join the conversation.