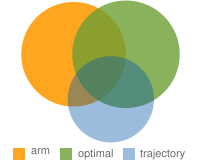
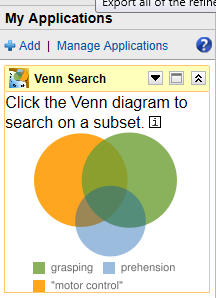

Venn diagrams, conceived by John Venn around 130 years ago, are a way of showing all possible combinations of a number of sets. When performing an academic literature search on a new topic, it is often not easy to understand how the terms interact with each other. A Venn diagram is an ideal way of visualizing this relationship. When searching using two or three terms on "Sciverse Hub" or "Scopus" with the application installed, a Venn diagram will automatically be shown with the selected search terms. The diagram is clickable - click on any of the regions to perform a new search with a particular subset of your search terms. This tool can be help broaden your search, as well as provide a useful visualization of the overlap between different fields, techniques or findings.
Venn Search
Updates

Leave feedback in the comments!
Log in or sign up for Devpost to join the conversation.