

Inspiration
VeloViz is inspired by the intersection of data and urban mobility trends, bringing clarity to how people like to travel across their cities. Insights from VeloViz can guide better infrastructure, policy changes, and sustainability initiatives.
The rise of bike-sharing systems worldwide has transformed urban mobility. The data generated from usage will help optimize stations, improve accessibility, and encourage cycling culture. Cities often rely on raw numbers, but visualizing movement patterns makes data actionable. But by merging real ride data with survey responses, VeloViz captures both quantitative trends and qualitative information like user requirements.
At its core, VeloViz is about making bike data more than just numbers—it’s about telling the story of movement, choice, and city life. 🚲✨
What it does
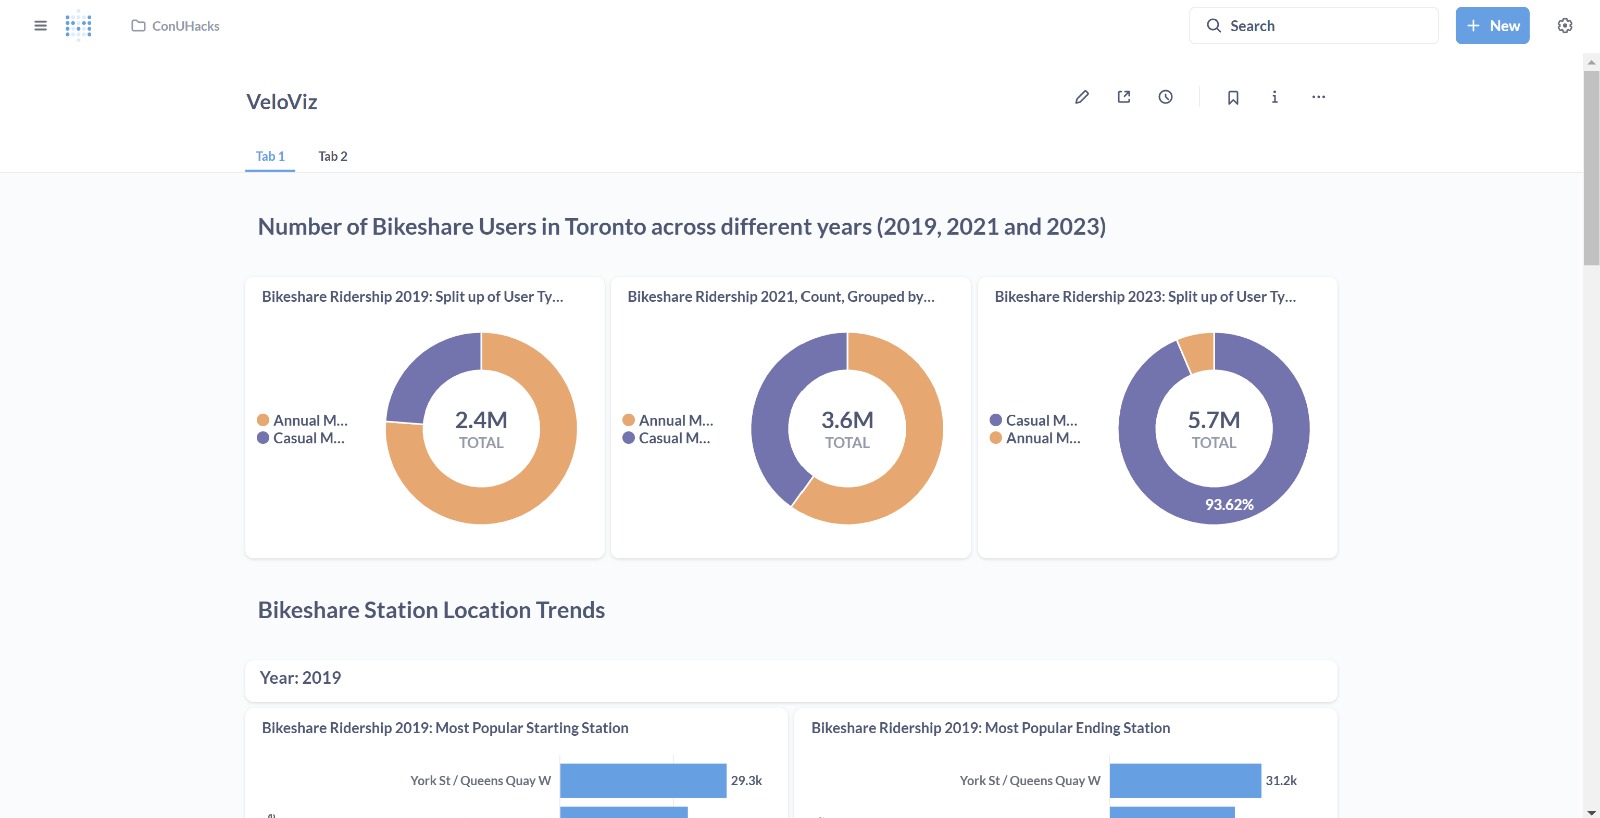
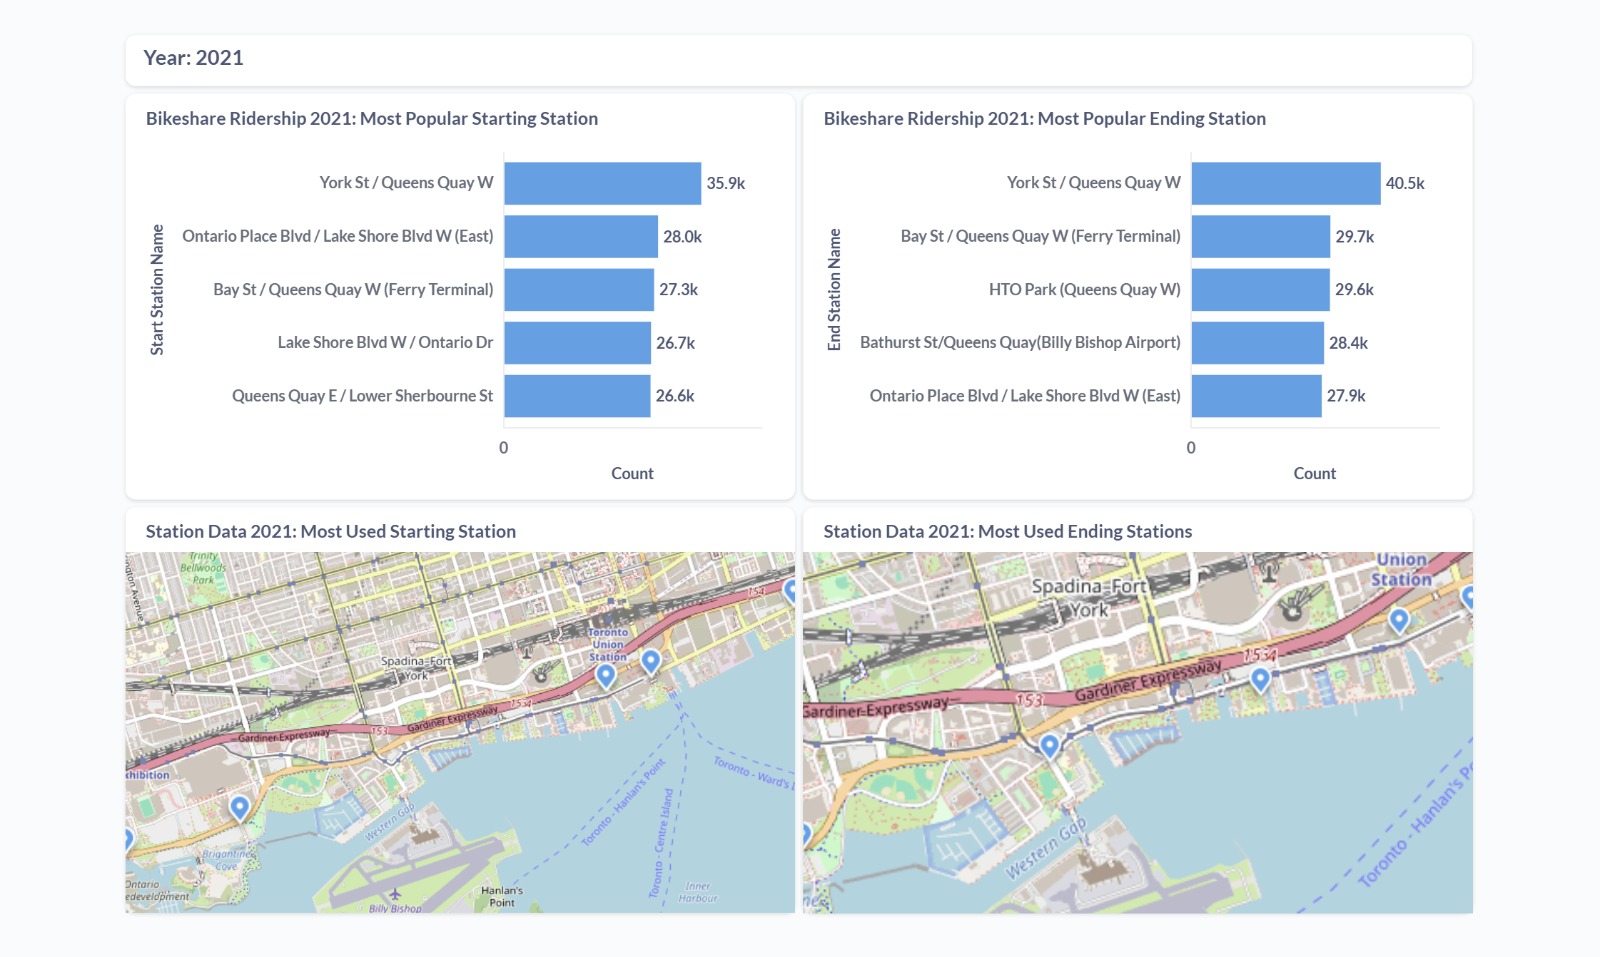
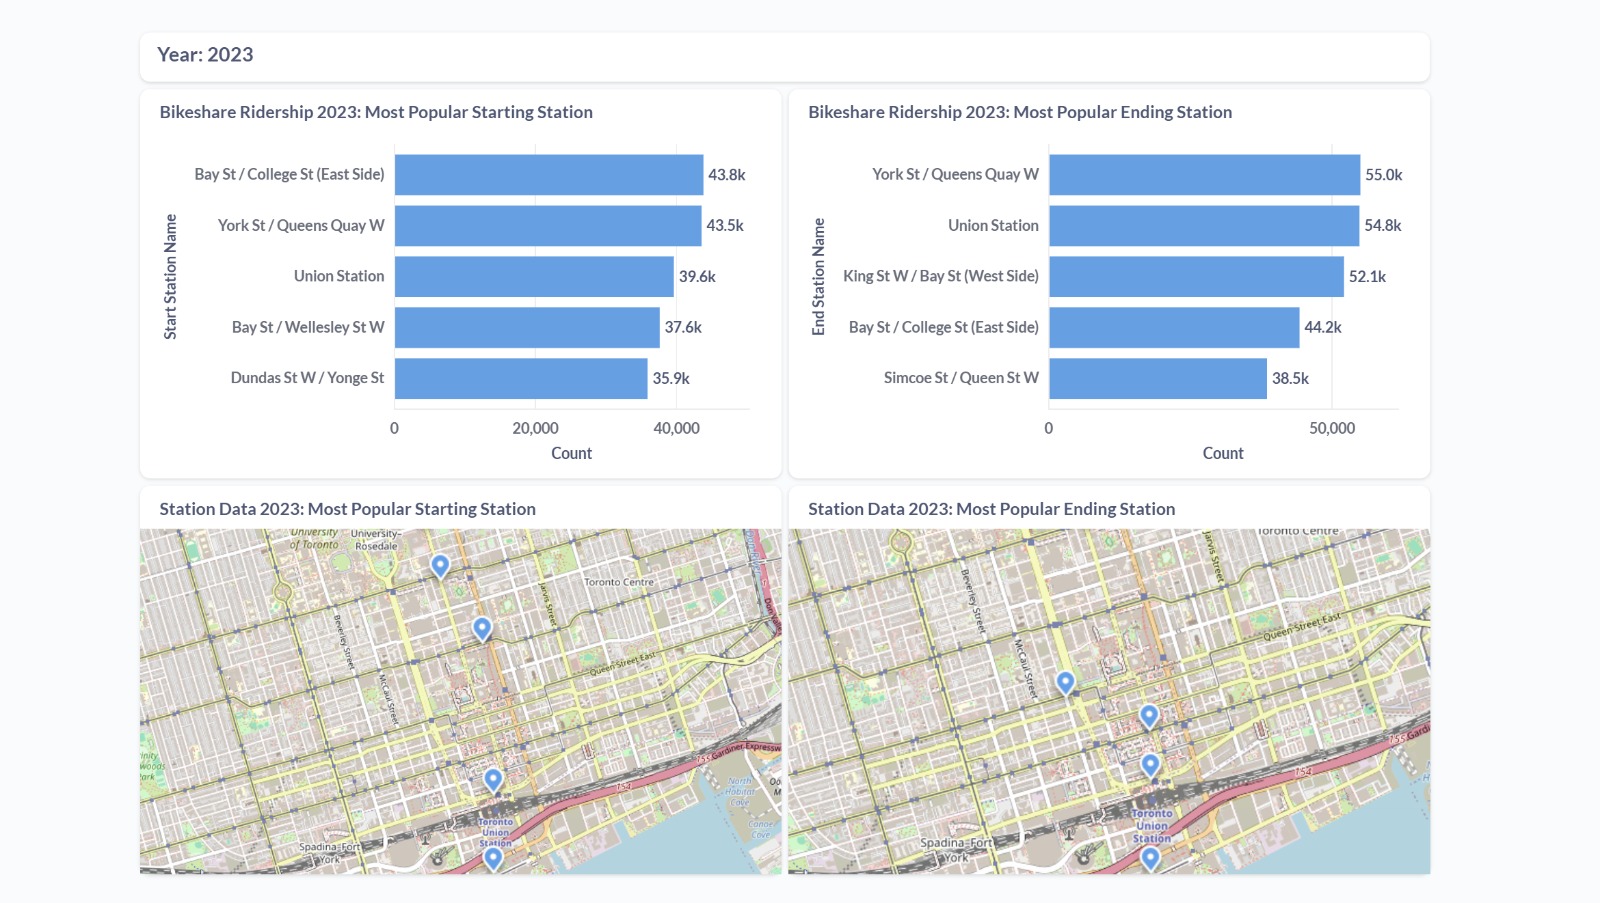
VeloViz brings bike sharing data and mode share transport data to life. Bikeshare in Toronto has 9000+ bikes and 800+ stations. Information collected from bikeshare is published by Toronto as open data, from which we gathered some significant insights such as:
- In the past 6 years, there is a significant increase in the casual membership, accounting for the doubling of total annual rides taken.
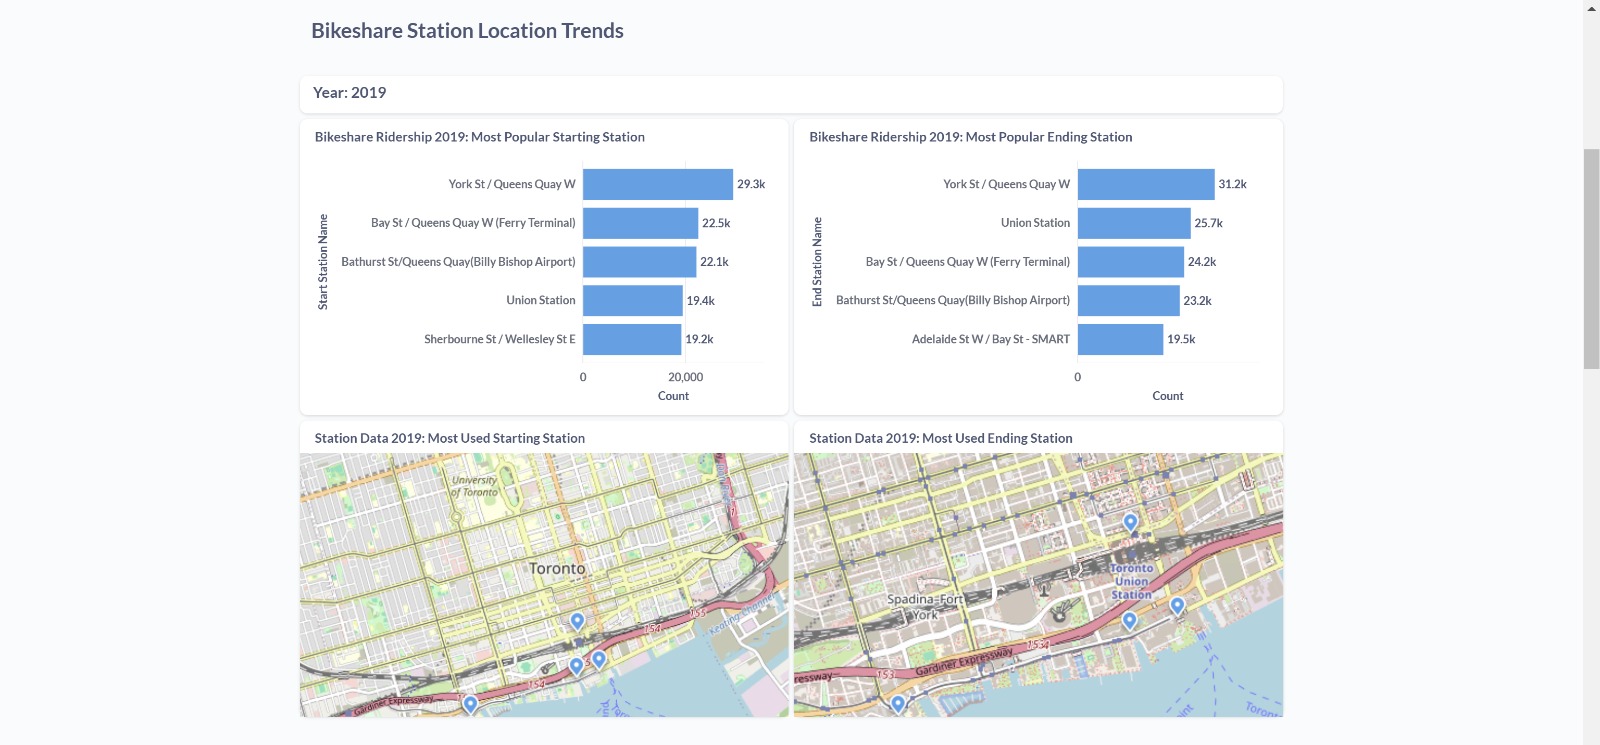
- We were able to identify the most popular station for starting and ending rides, which was York St/Queens Quay W Station. We observe this trend likely because of the station's prominence in the city.
How we built it
Using the Toronto Open Data website, we used the following datasets:
- E-Bike Survey Response Results - CSV of survey results
- Bike Share Toronto Ridership Data - CSV of Ridership data
- Bikeshare station information - JSON file of station information.
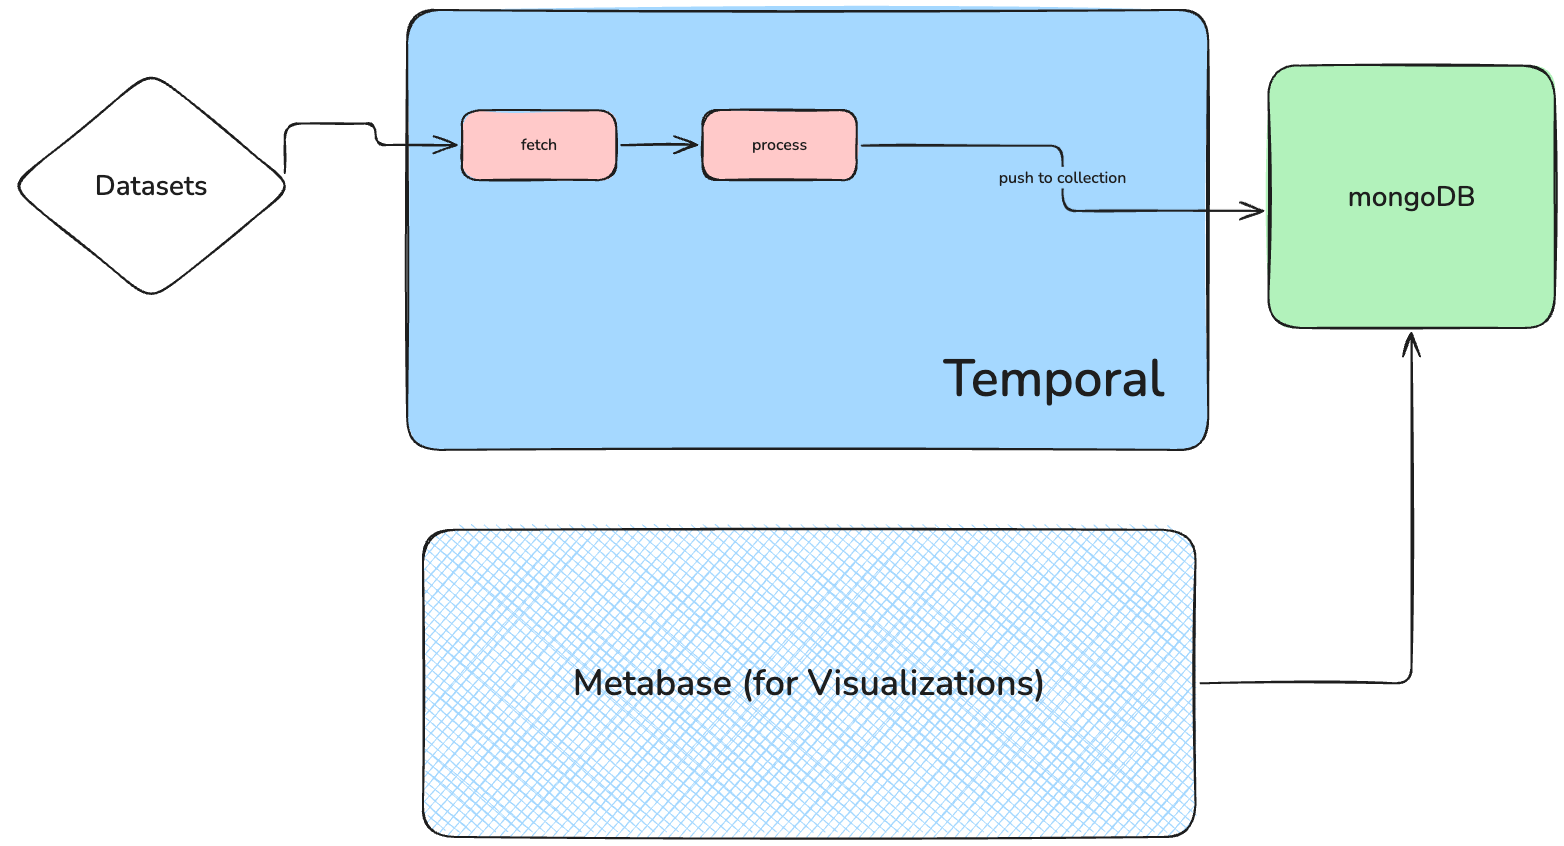
This data was then processed and uploaded to MongoDB using a temporal workflow. Metabase was connected to MongoDB as a data source. This enabled Metabase to gain access to our data for visualization. The entire platform is built, deployed and tested on Docker. We finally explored the information and gained some insights by creating some cool visuals. 😃
Challenges we ran into
- Inconsistent Datasets – We faced issues with incomplete or mismatched data, making it difficult to ensure consistency across our visualizations and analyses.
- Learning Curve with Metabase – While powerful, getting comfortable with Metabase’s features and integrating it effectively into our workflow took some time.
- Temporal Workflow Configuration - Making API calls through workflows posed a challenge.
Accomplishments that we're proud of
We used Metabase and Temporal for the first time in this project. Metabase helped us create clear, insightful visualizations, while Temporal gave us a robust framework for handling complex workflows. Both tools have made a significant impact on the project’s effectiveness and reliability.
What we learned
- Building an end-to-end solution with new tools within a short timeline.
- Gleaning insights from a wide variety of open source data
What's next for VeloViz
- Better Temporal workflow with advanced processing
- Support for GeoJSON datasets
- Inclusion of AI driven-insights
Built With
- docker
- metabase
- mongodb
- postgresql
- python
- temporal


Log in or sign up for Devpost to join the conversation.