Inspiration
Velocity report in Jira provides important information to Scrum teams about their plans, achievements, and trends. We created Velocity Chart macro that can be added to Confluence Cloud pages.
What it does
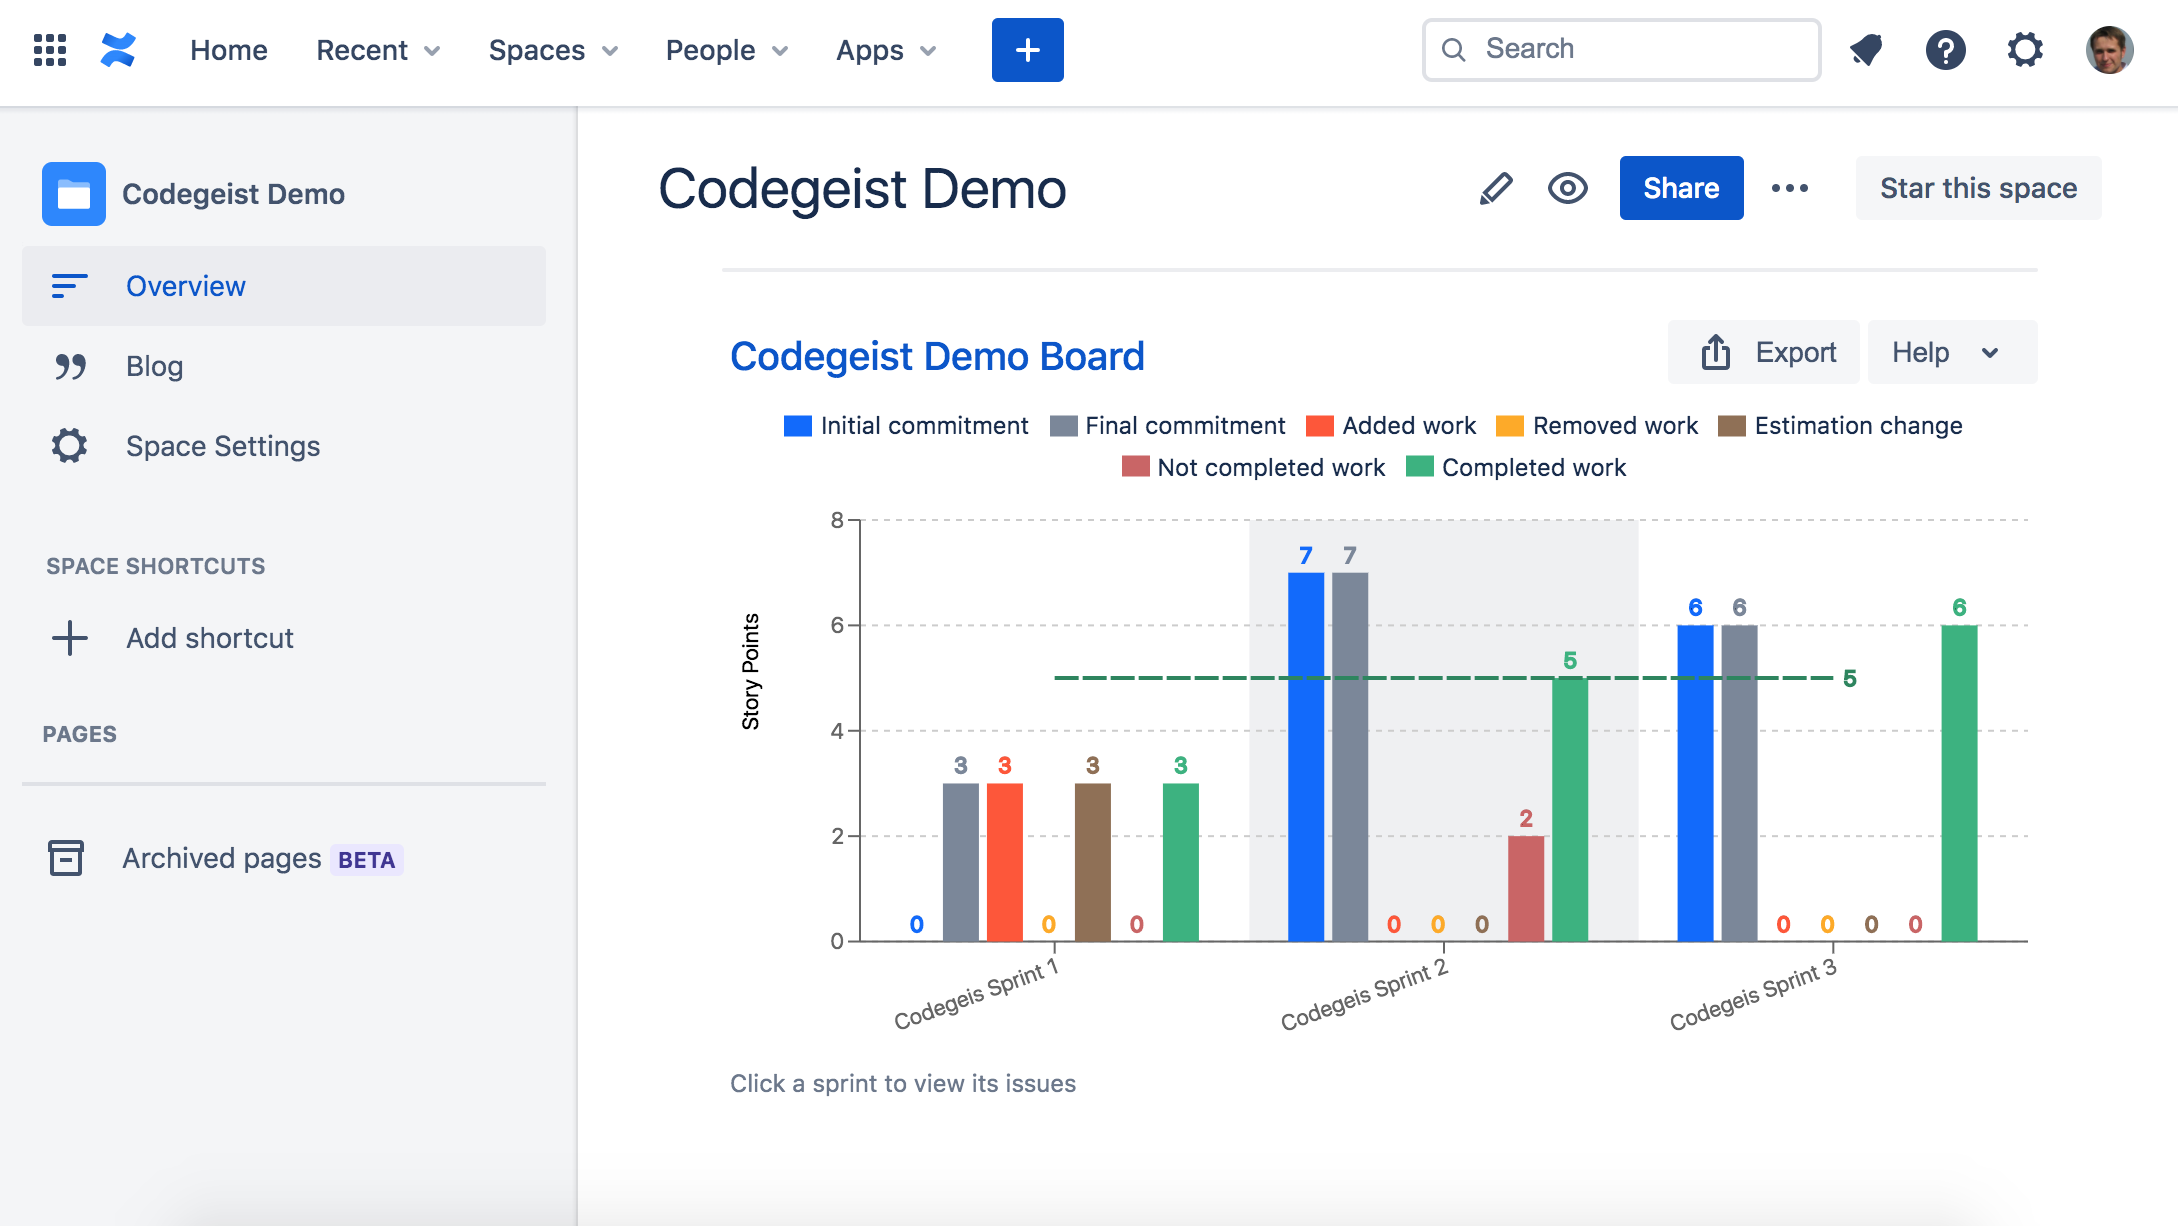
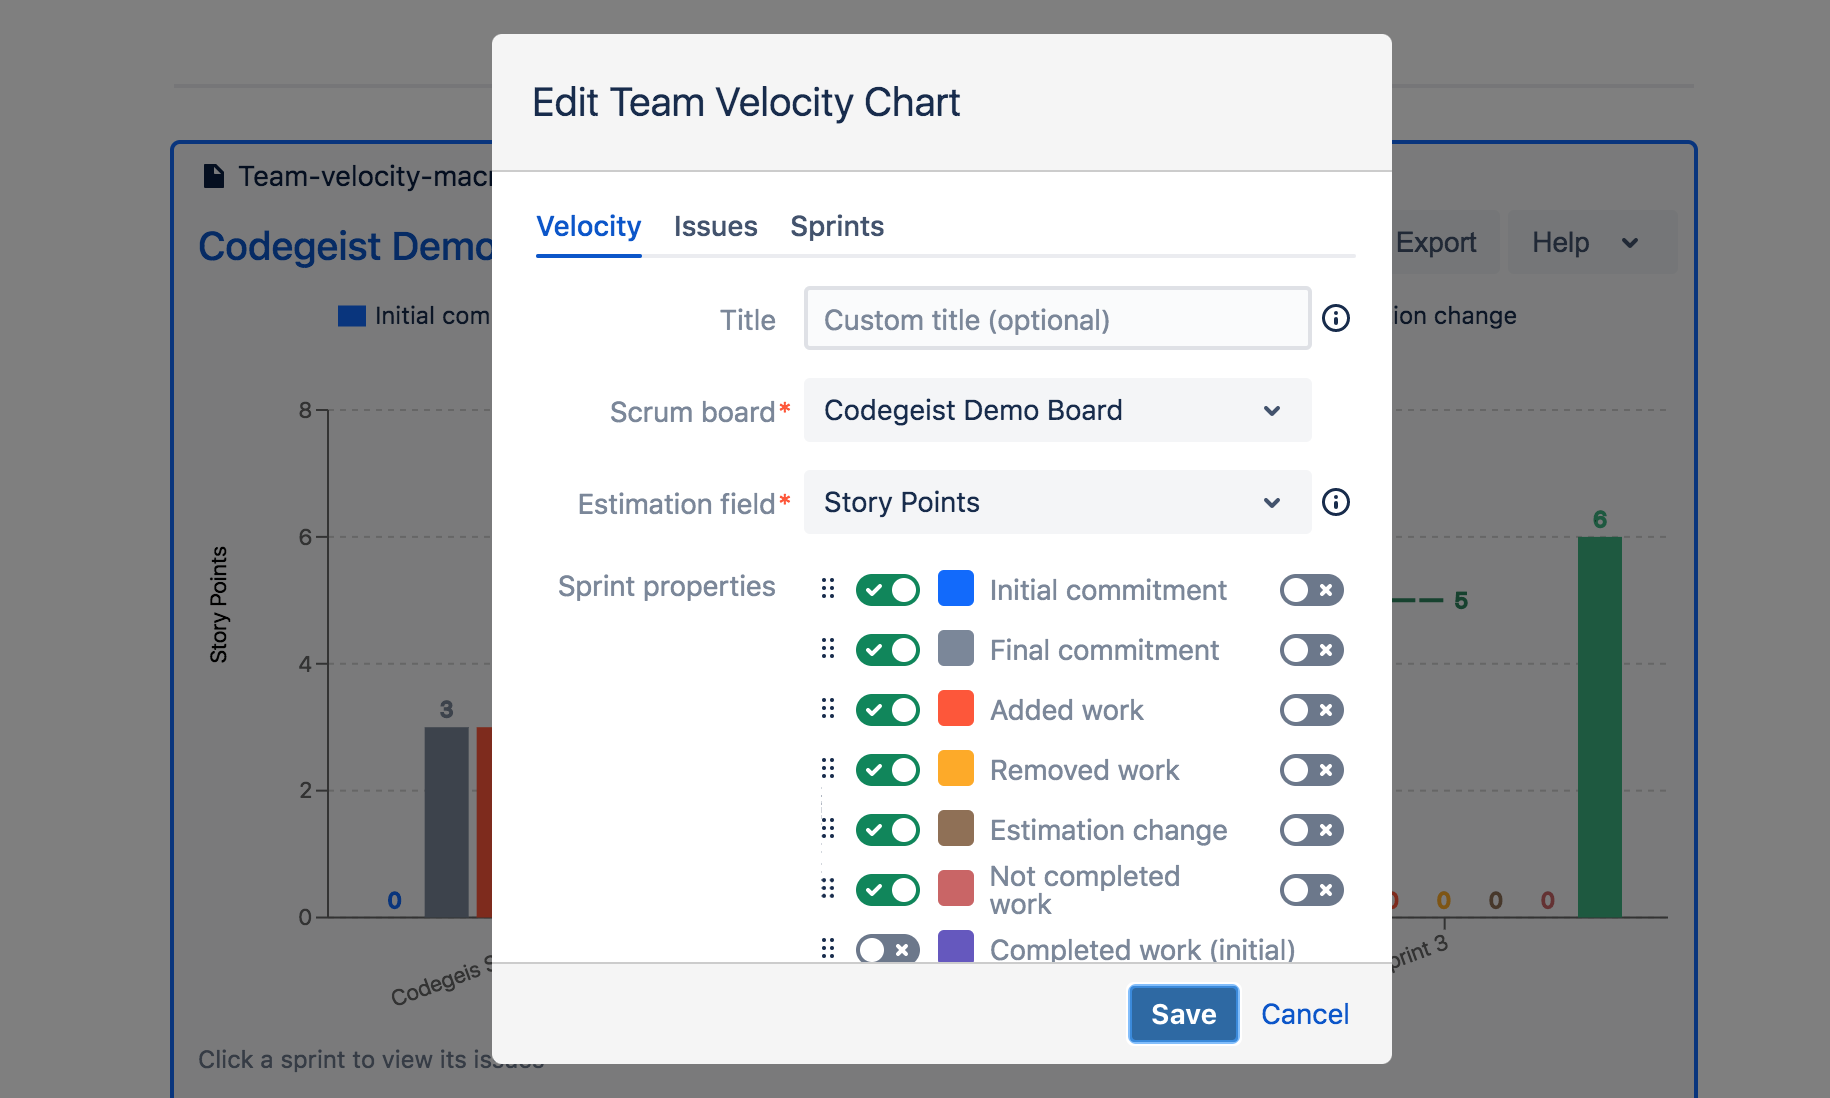
Velocity Chart for Confluence Cloud enables you to discover and visualize the history and trends, progress and performance of Agile Teams with the following sprint metrics:
- Initial commitment
- Final commitment
- Added work
- Removed work
- Estimate change
- Not completed work
- Completed work
Key features:
- Support of Issue Count, Story Points, Time estimates
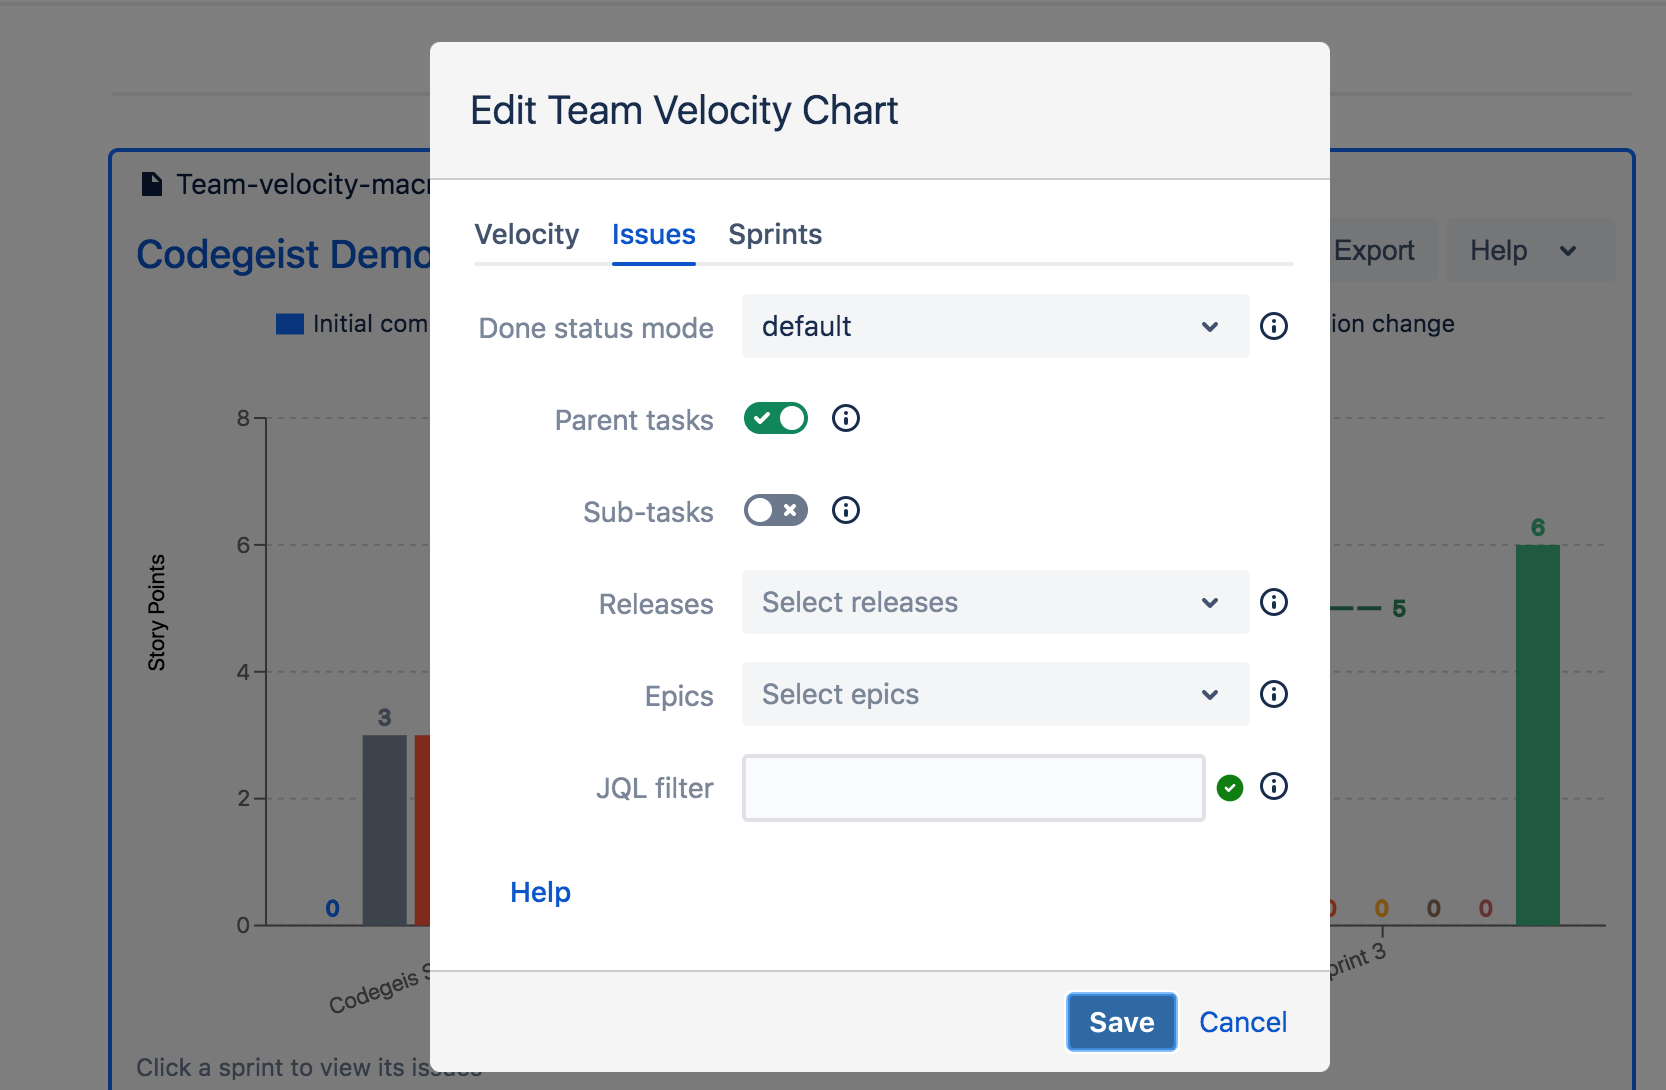
- Filter sprint issues using JQL
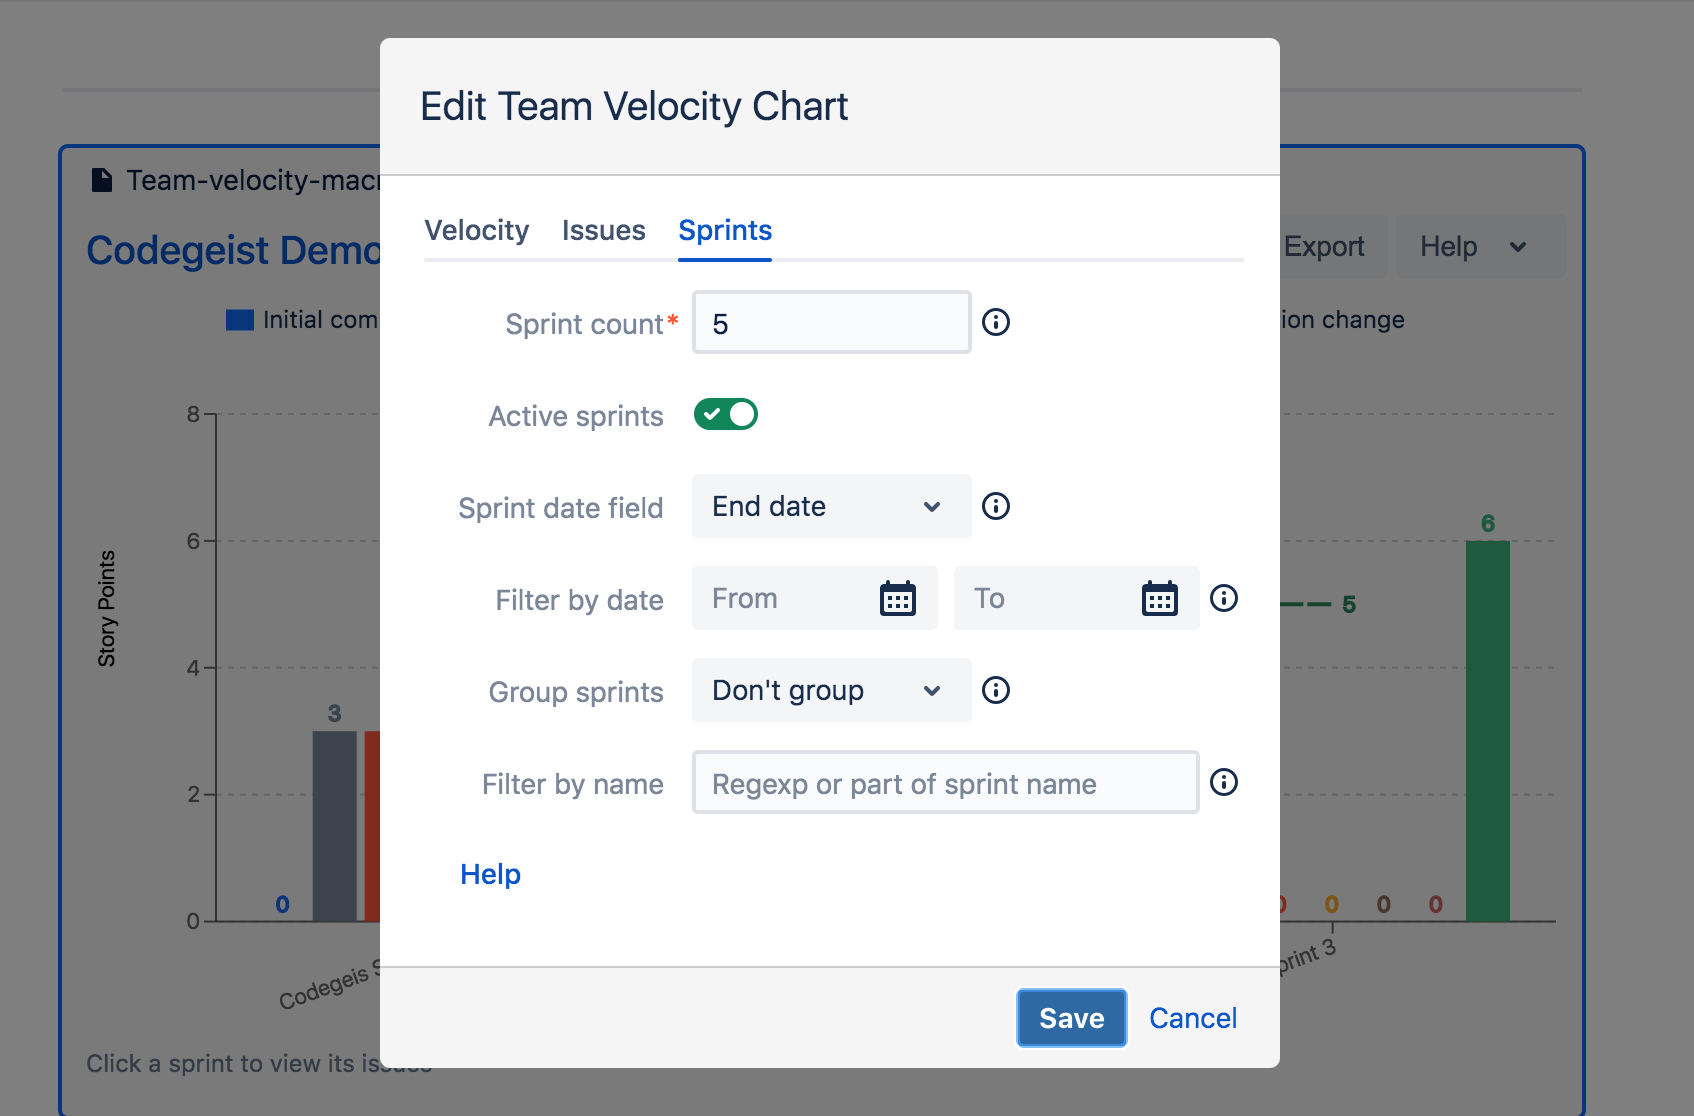
- Group sprints by month / quarter
- Sprints from date range
- Filter sprints by name
- Moving average / all sprints average
- Multiple chart types (bar, line, stack)
- Export data to Excel
- View sprint issues (Sprint Report)
How I built it
We have built Velocity Chart for Confluence Cloud using React, Atlaskit and Atlassian Connect.
Challenges I ran into
The biggest challenge was to fetch data in Confluence Cloud from Jira Cloud. Due to lack of support of OAuth 2 for Jira Software we had to use our existing app Agile Velocity Chart Gadget for Jira as a required dependency in a data flow.
Accomplishments that I'm proud of
We have managed to reuse 99% of the frontend code for of the Velocity Chart gadget for Jira to create Velocity Chart for Confluence Cloud. With the support of Confluence Cloud now Velocity Chart can be run in Jira and Confluence in any platform.
What's next for Velocity Chart for Confluence Cloud
At the moment Velocity Chart covers team and product (cross-team) levels. As a next step we will add support for individual user velocity.


Log in or sign up for Devpost to join the conversation.