-
-
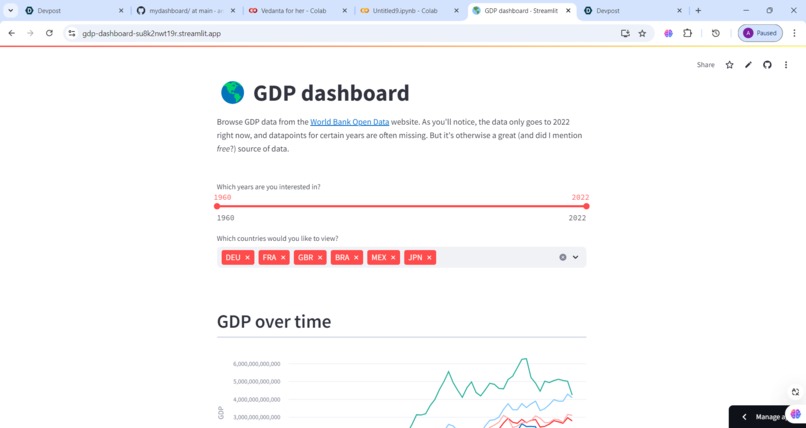
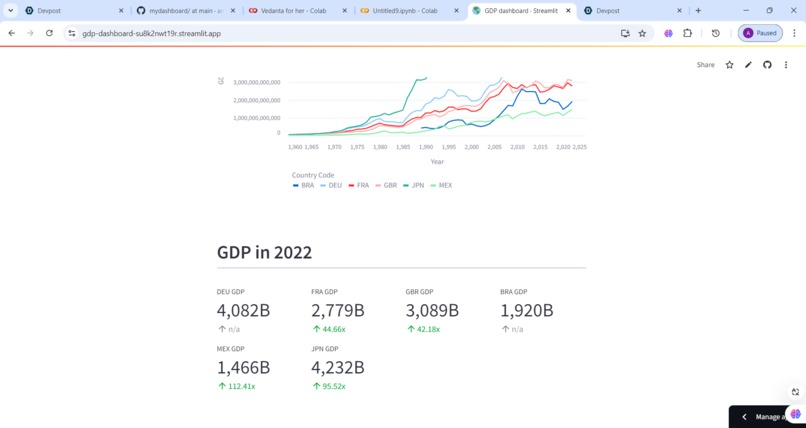
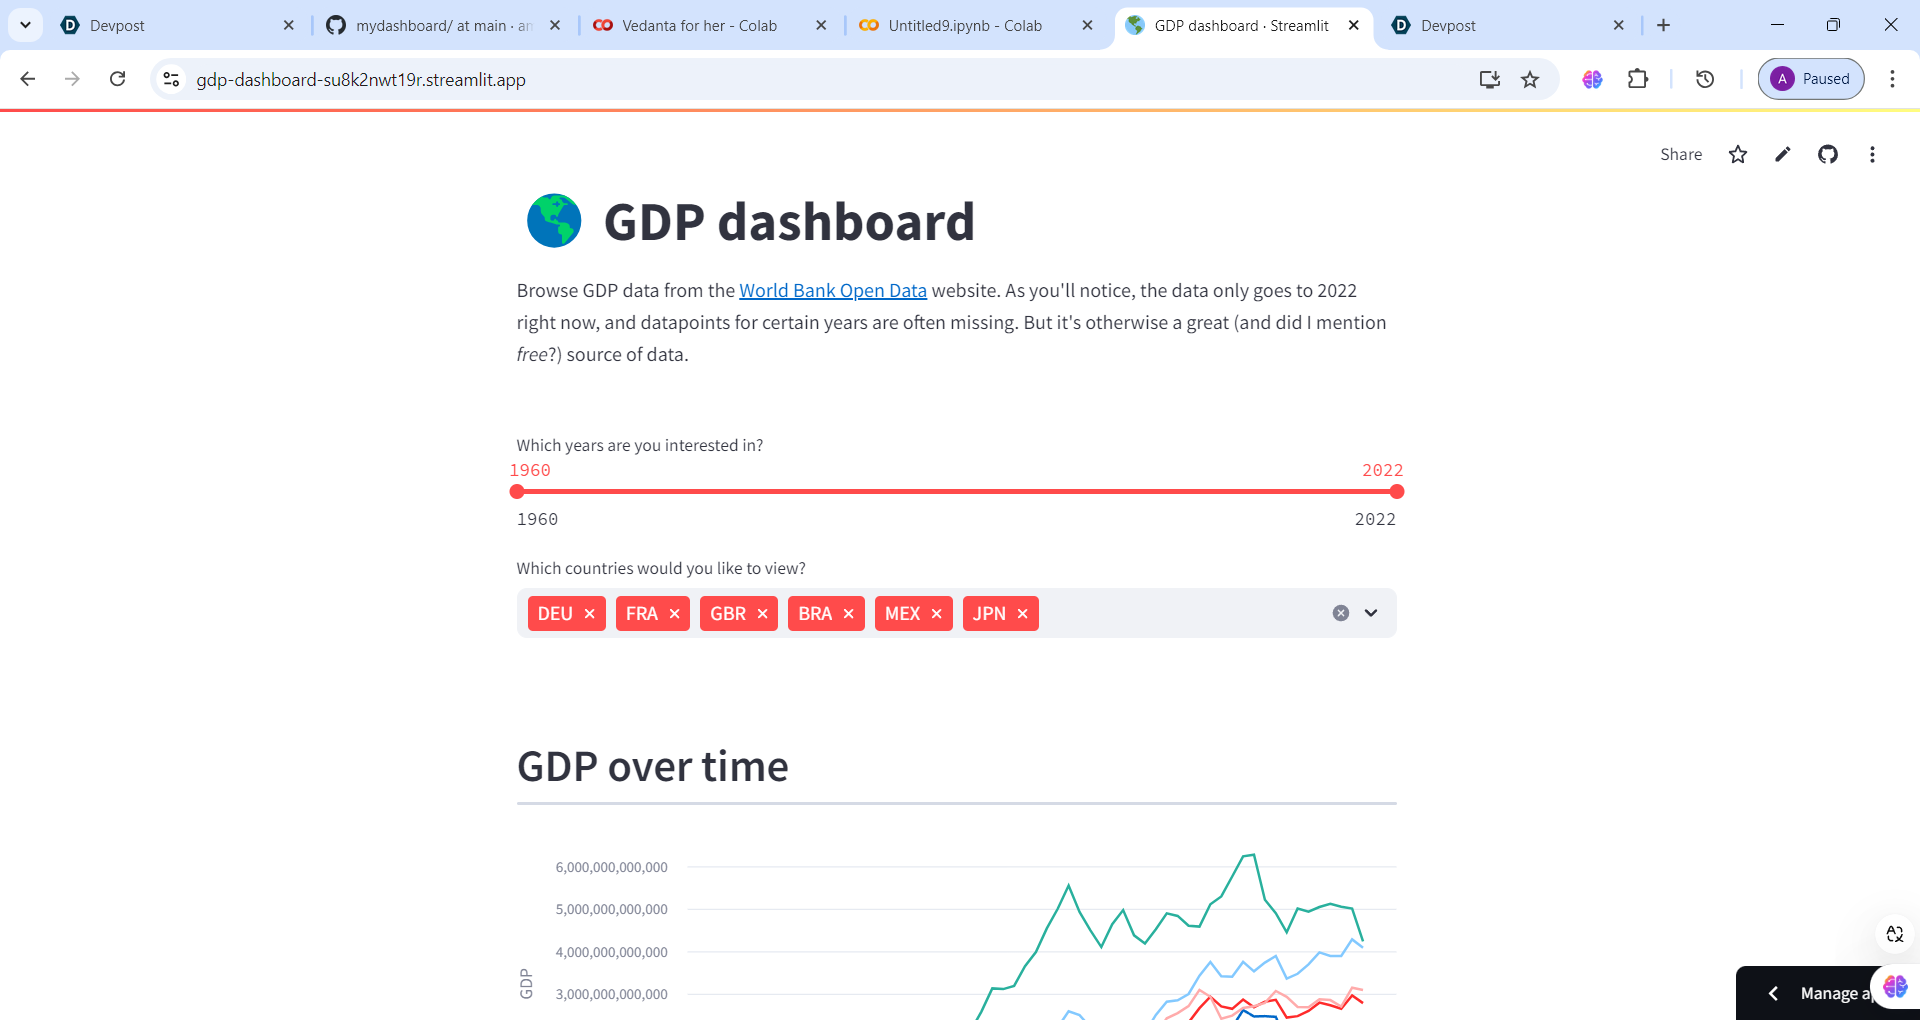
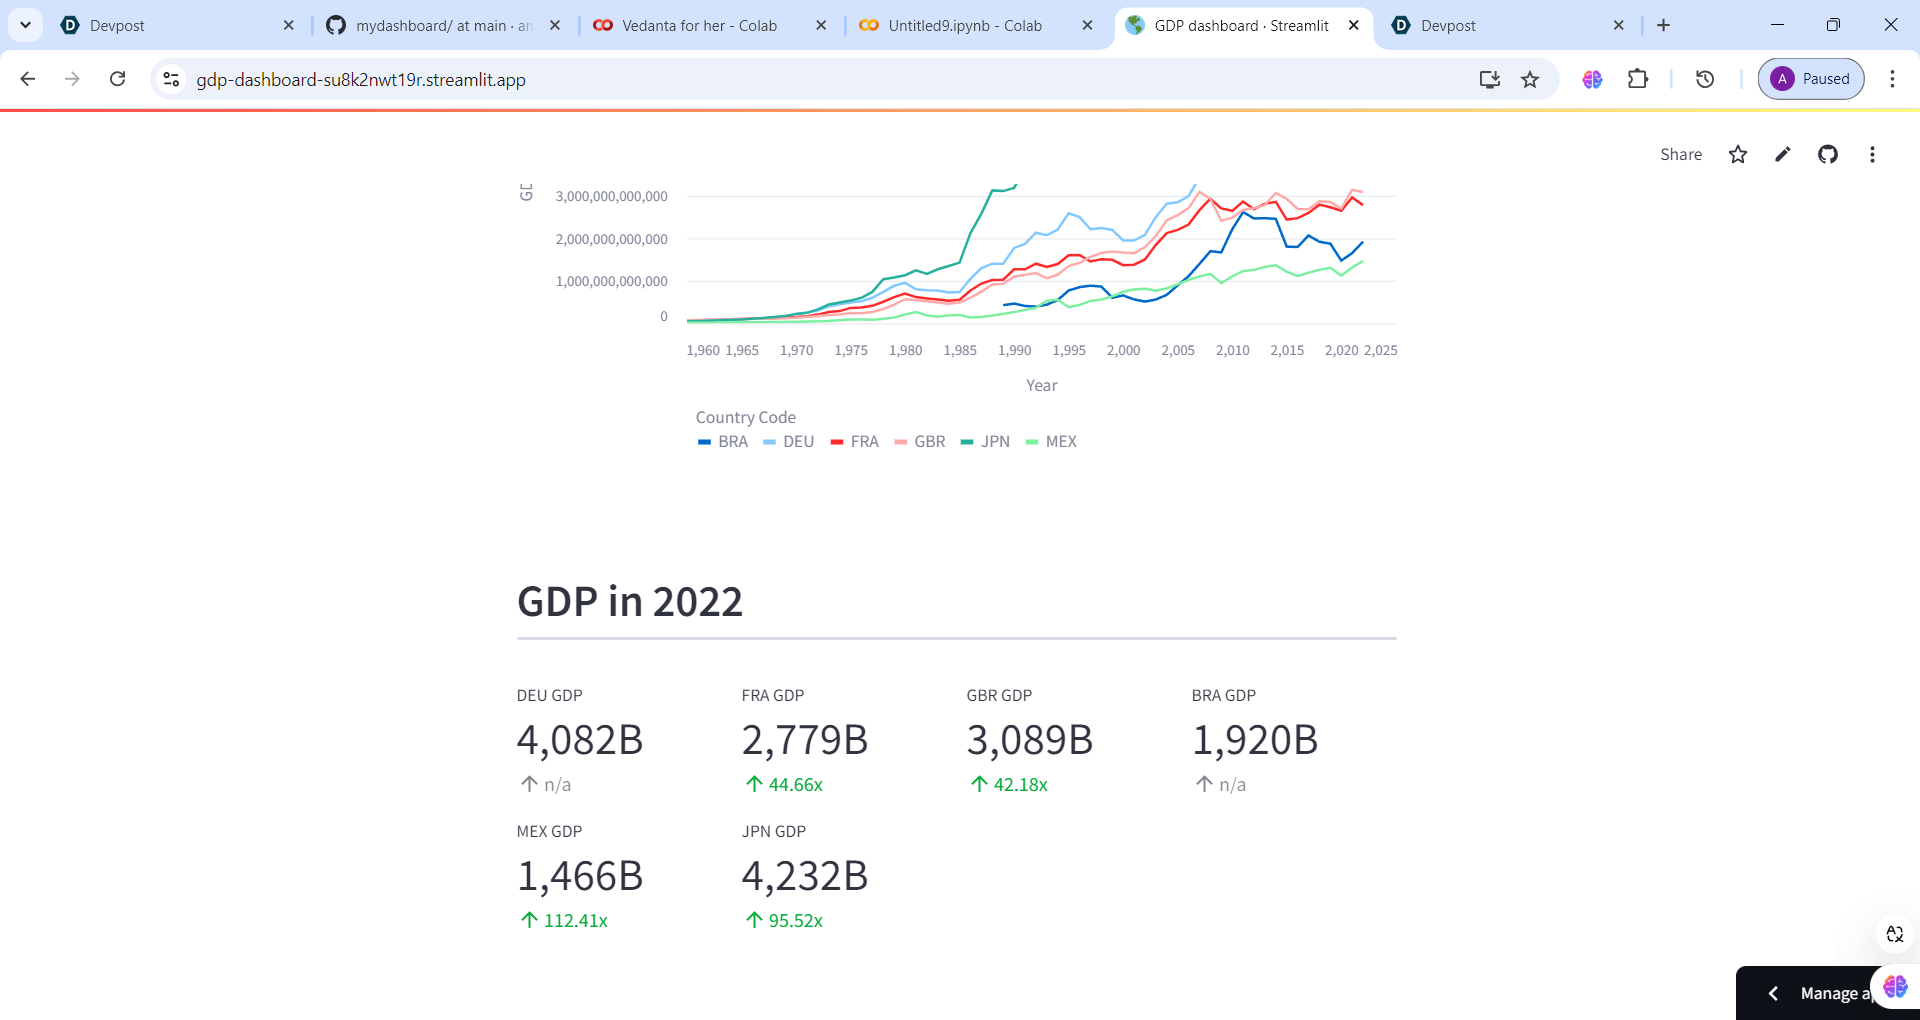
GDP dashboard
-
Dashboard
-

Plot1
-
Plot2
-

Dashboard1
-

Dashboard2


Inspiration
Crime is a complex social issue that affects communities, individuals, and entire nations. With decades of data available, we saw an opportunity to leverage data science to uncover hidden patterns in crime across the World.My inspiration came from a desire to empower policymakers, communities, and researchers with actionable insights that could help build safer, more resilient societies. By exploring how crime trends shift over time and vary by location, I hope to contribute to a data-driven approach for understanding and addressing crime.
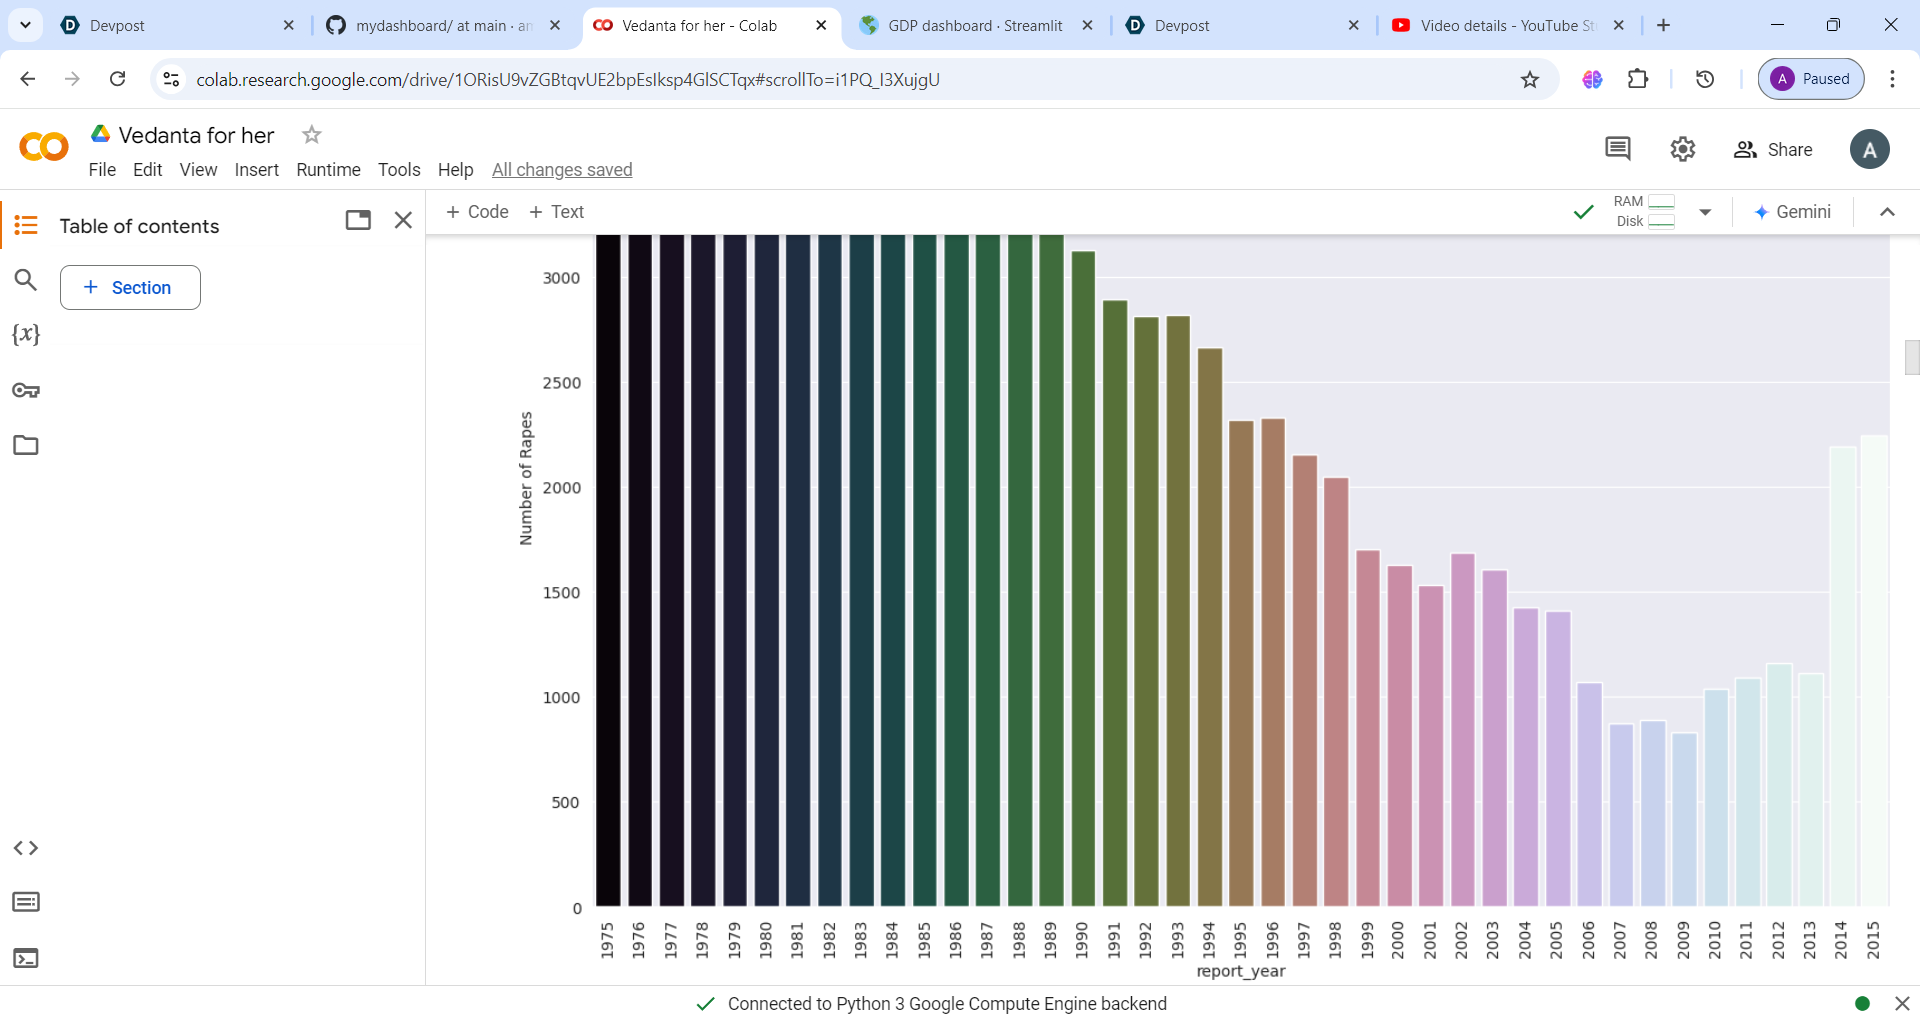
What it does
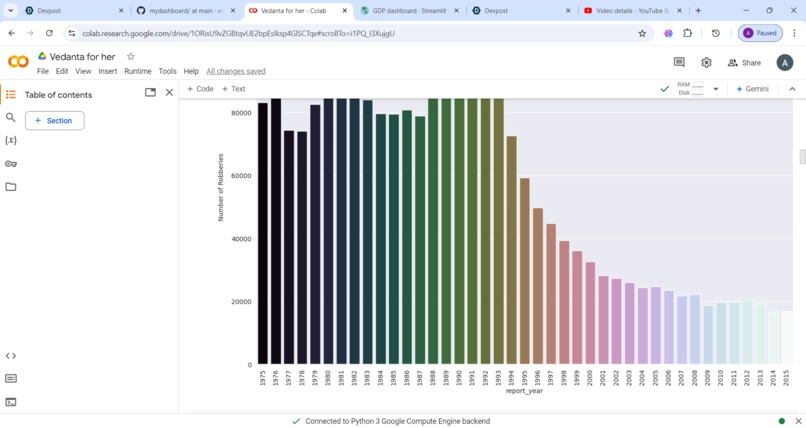
My project analyzes and visualizes crime data in the world over the last 40 years, giving users a powerful tool to explore crime trends at both the national and local levels. Through my interactive dashboards, users can dive deep into various types of crimes, including violent crimes like homicides, assaults, and robberies. By calculating both total and relative crime rates, my project highlights which jurisdictions face higher crime risks relative to their populations. These insights allow anyone—policymakers, researchers, or concerned citizens—to identify patterns and make data-informed decisions.
How we built it
I built this project using a robust stack of data science tools. Python served as the backbone, with Pandas handling complex data manipulation and cleaning, while Matplotlib and Seaborn provided the static visualizations to track key trends. To enhance user interactivity, I used Plotly for creating engaging, interactive graphs that allow users to filter and explore data in real time. Developing in Google Colab allowed me to document the process clearly and iterate quickly. Each step—from data cleaning to visualization—was carefully crafted to ensure accuracy and usability for a non-technical audience.
Challenges we ran into
Working with historical crime data presented unique challenges. I had to clean and standardize data across multiple jurisdictions, handling inconsistencies like missing values and duplicate entries. Additionally, creating an intuitive interface that could handle vast amounts of data without sacrificing performance required considerable optimization. Balancing the detail of insights with the simplicity of our visualizations was another challenge—I wanted users to explore complex data without feeling overwhelmed. By overcoming these obstacles,I developed a refined tool that provides powerful insights without compromising accessibility.
Accomplishments that we're proud of
I am especially proud of the dynamic and comprehensive visualizations I created, which reveal compelling stories within the crime data. My success in calculating and visualizing both absolute and relative crime rates enables users to gain a nuanced understanding of crime distribution and intensity across the World.I also achieved seamless interactivity in visualizations, allowing users to explore the data in depth and at their own pace. By transforming raw data into actionable insights, I believe I've made a meaningful contribution to the conversation around public safety and crime prevention.
What we learned
This project taught me invaluable lessons in data science and machine learning, particularly around data cleaning, visualization, and interactivity.I gained hands-on experience in handling large datasets with inconsistent information, refining my data wrangling skills to ensure accurate results. I also learned how to design user-centered visualizations that make complex data accessible and meaningful. On a broader level, I deepened my understanding of the social and economic factors that impact crime rates, and more convinced than ever of the potential for data-driven approaches to solve real-world issues.
What's next for Vedanta for her
Moving forward,I plan to expand this project by incorporating additional data sources, such as socio-economic indicators like education levels, income, and employment rates, to explore correlations between these factors and crime. By doing so, I aim to create predictive models that could forecast crime trends based on shifts in socio-economic conditions. Additionally, deploying this project as a web app, allowing users to access and interact with the data without needing technical expertise. We’re excited to continue developing this project, adding layers of analysis that will make it an even more valuable resource for understanding and combating crime.
Built With
- google-colab
- kaggle
- matplotlib
- numpy
- pandas
- python
- scikit-learn
- seaborn

Log in or sign up for Devpost to join the conversation.