-
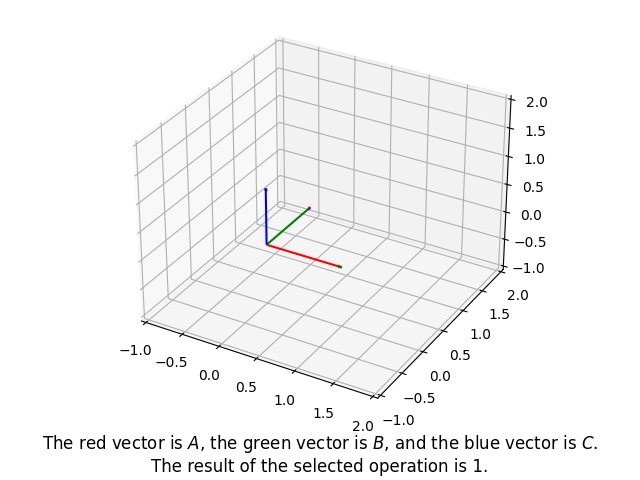
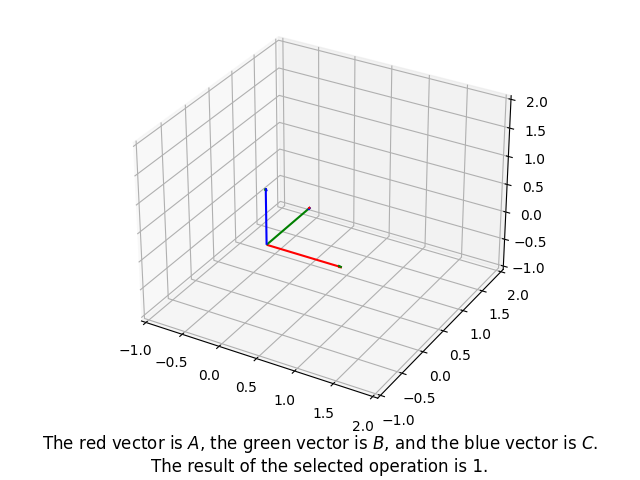
Program output for the triple product of the standard basis vectors.
Inspiration
Based on our own experience with studying and working with vectors, we thought that it would be useful if we made a tool for others to get a good visual representation of vectors, and to be able to calculate the result of different vector operations.
What it does
Our application allows the user to enter the components of three 3D vectors, a scalar (single number), and select an operation to perform using the scalar or vectors. The operations supported are:
- Addition of two vectors
- Subtraction of two vectors
- Multiplication of a vector by a scalar
- Dot product of two vectors
- Cross product of two vectors
- Triple product of three vectors
- Calculation of the norm (length) of a vector
- Normalizing a vector (scaling it to a length of 1)
We plot the original input vectors and show the result of the operation under the plot.
How we built it
We built it on MecSimCalc which provides a web-based UI for providing user input and showing output. The program that we implemented is in Python. For numerical vector operations, we used NumPy, and for plotting, we used Matplotlib.
Challenges we ran into
We did not know how to make 3D plots, and we also did not know how to plot vectors using Matplotlib. There were also things we used in NumPy that we did not know about before. It took many tries and lots of testing to make it work in the limited time that we had. By the end, we were able to get most of it done, but we did not have time to plot any vectors obtained from the operations.
Accomplishments that we're proud of
We quickly came up with an idea and implemented it fairly quickly. We were able to overcome challenges quickly by focusing on the core aspects of our program instead of getting too caught up in minor details (minor for a hackathon, that is).
What we learned
We learned about a few different things in NumPy and Matplotlib such as some array operations and making 3D vector plots. We also learned about MecSimCalc.
What's next for Vector Operations
- Adding resulting vectors in the plot
- Being able to do multiple operations at once
- Adding a legend instead of just a caption
- Making the plot a bit larger and nicer looking

Log in or sign up for Devpost to join the conversation.