

Vector Health: Discovering the Effects of Propagated Pollution on Our Community
An analysis application to determine accessible, temporal air quality information by applying simple vector propagation to point pollution sources.
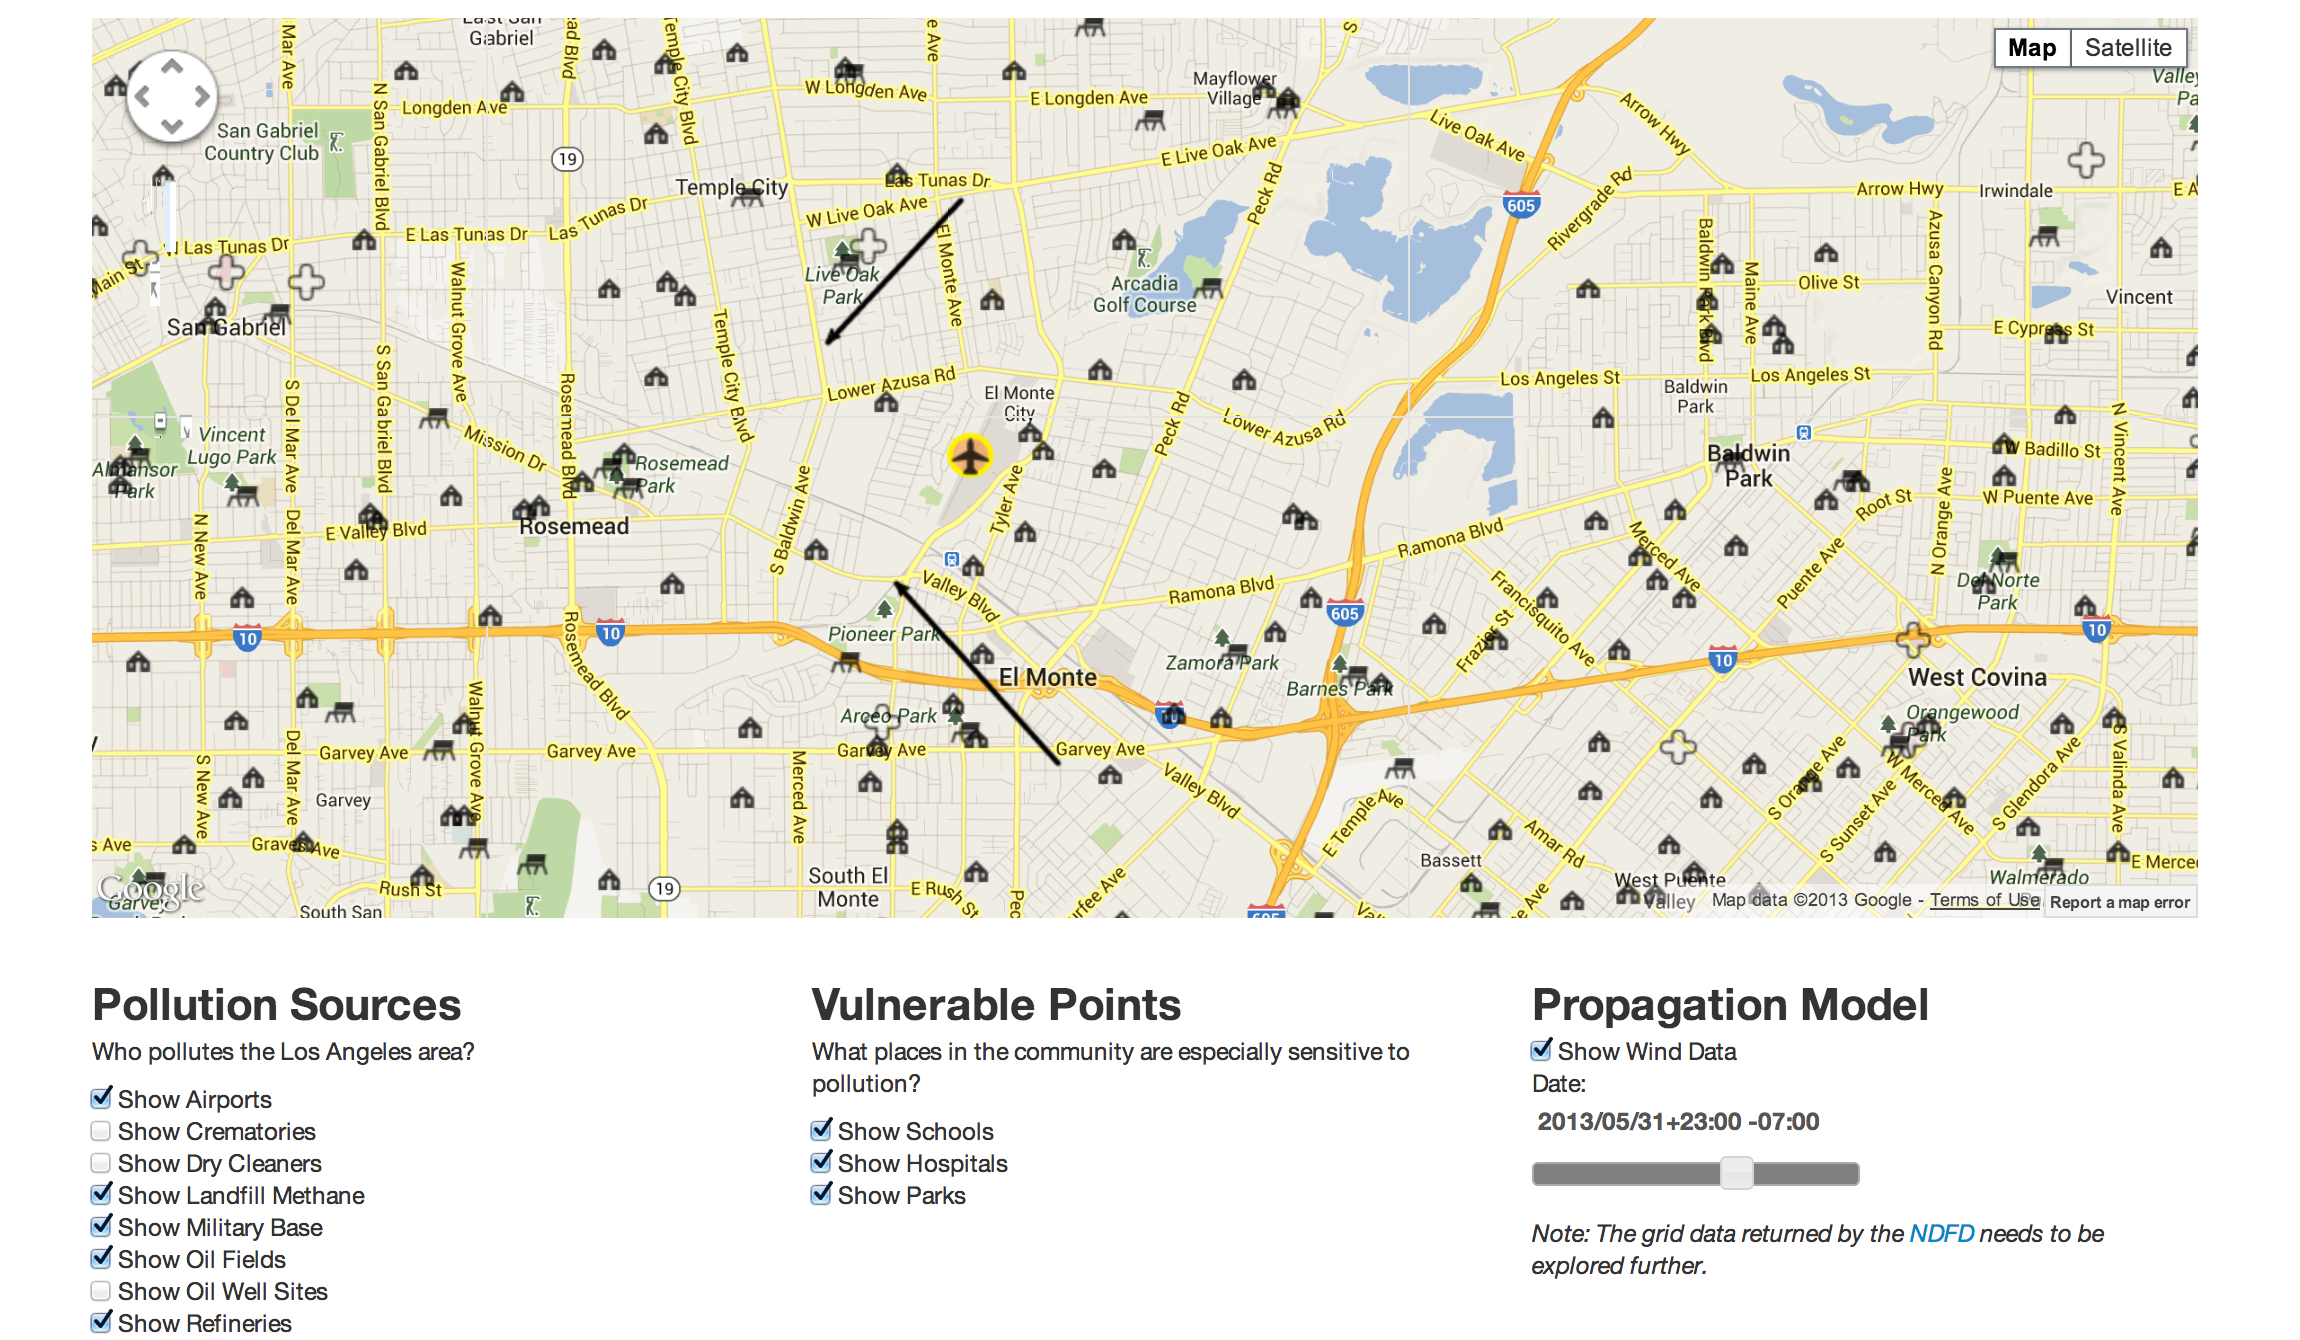
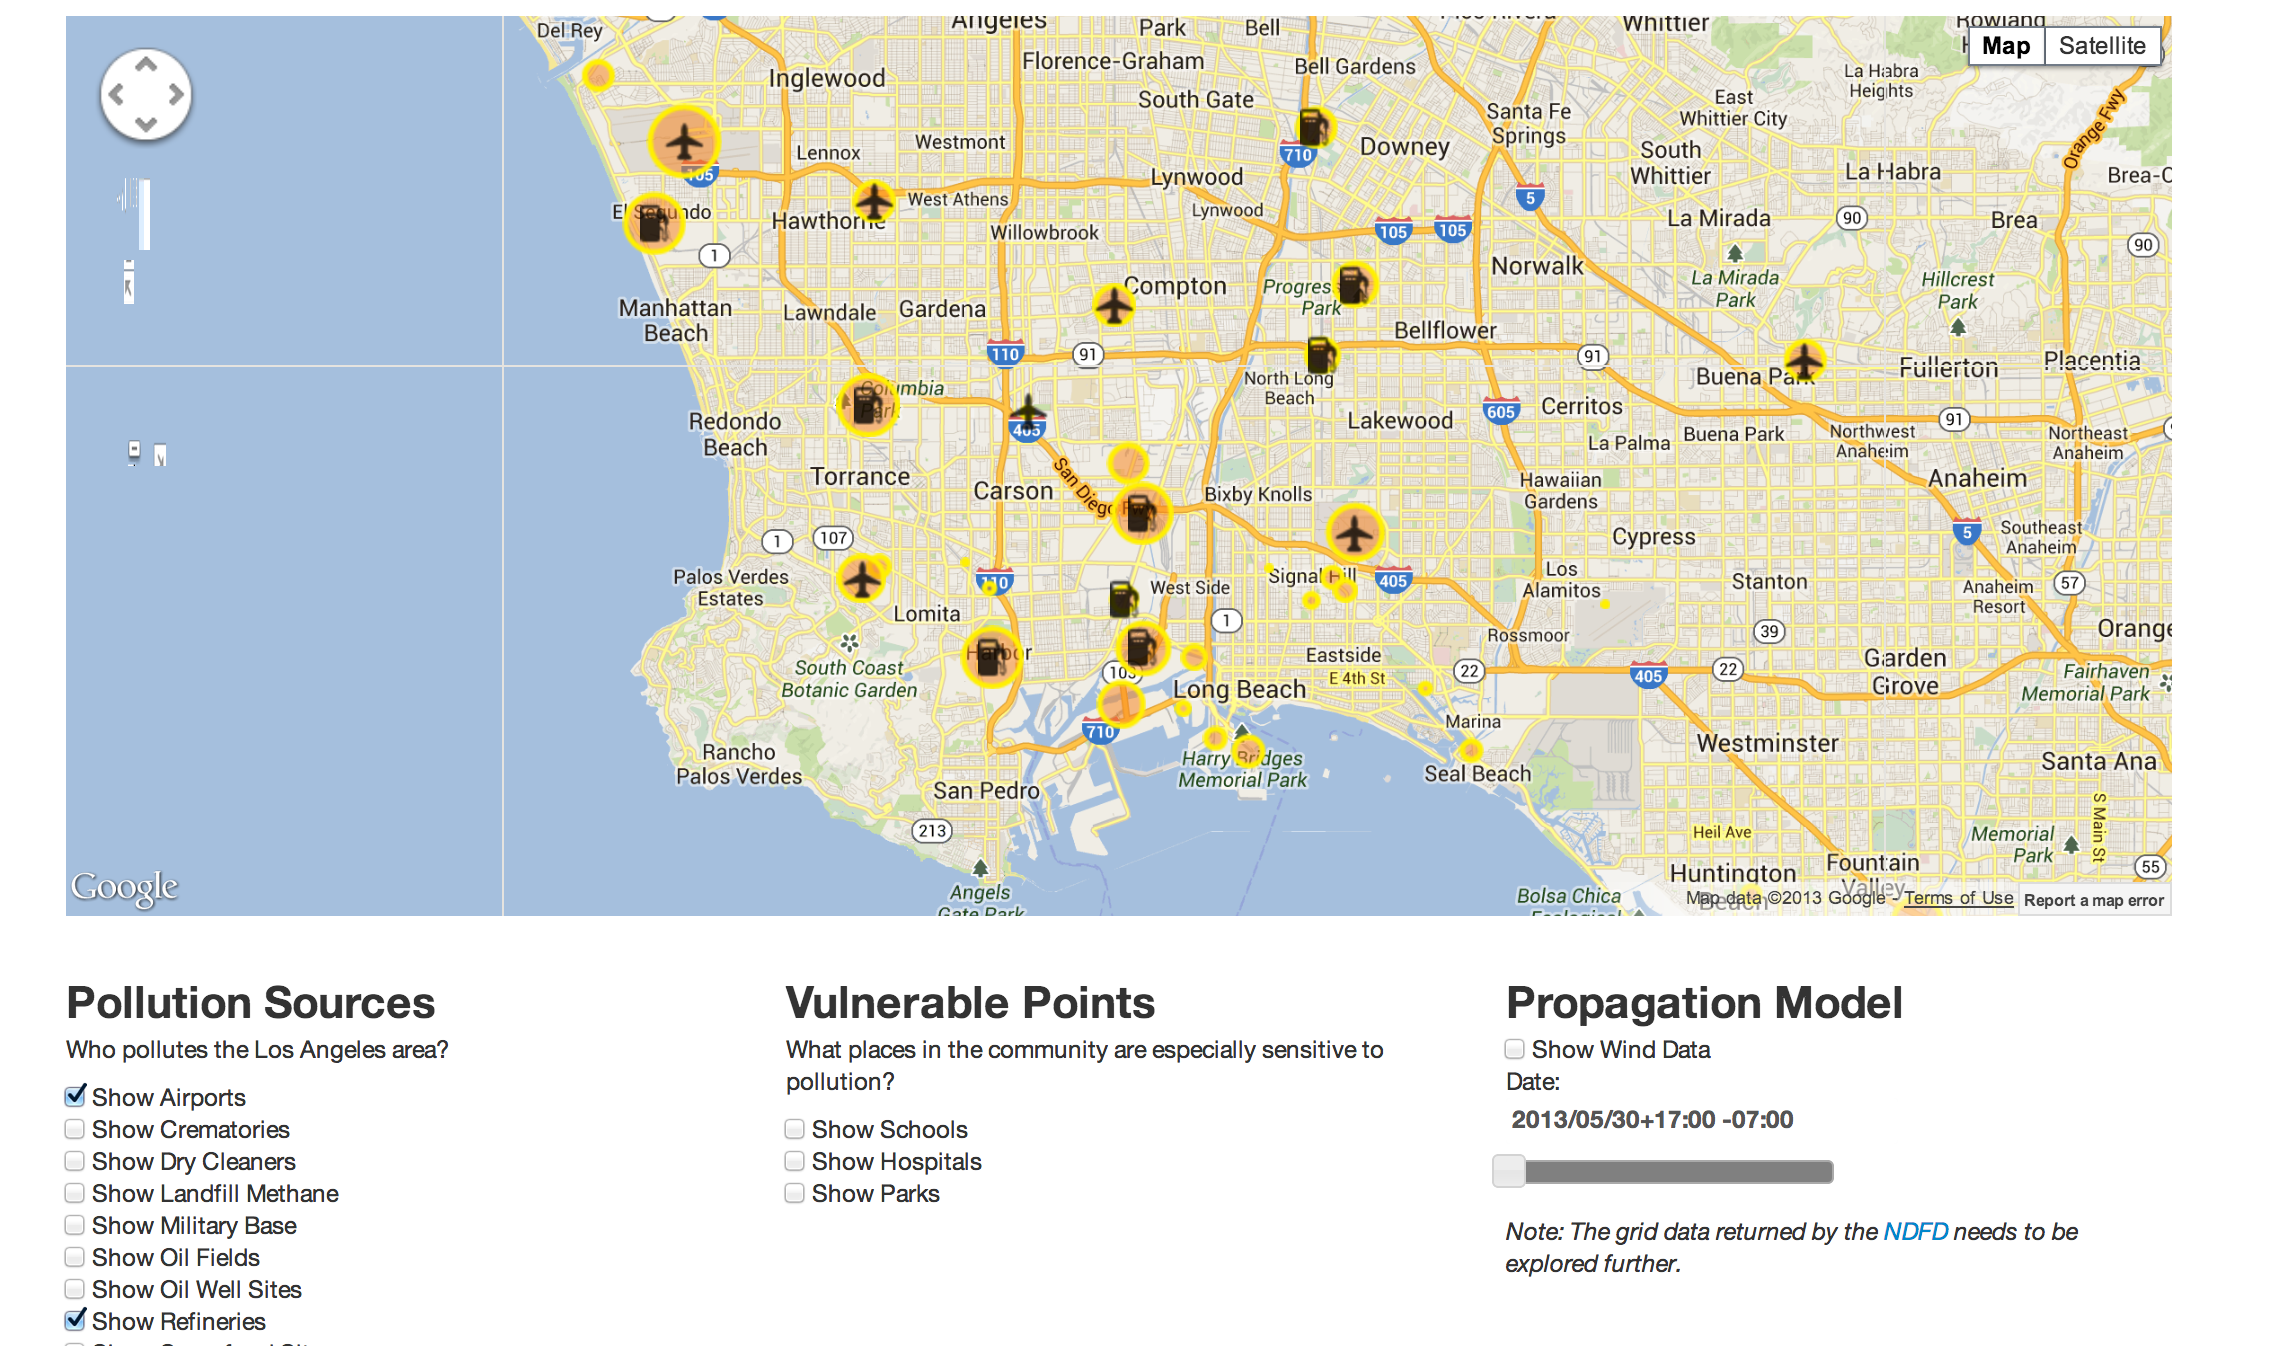
The wind data returned from the NDFD API was not documented very well and needs more research to get the timestamped wind grid. To show the lack of consistent data, the current build shows the grid overlay where NDFD is reporting data, with mocked strength and directions.
Due to time constraints and lack of meaningful wind data, we did not pursue the differential equation propagation solution of the point source pollution sources to check their effects on the points of interest.
We gathered and normalized many data sources, including Google Maps API v3, ESRI data via Cal-Atlas, NDFD Digital Weather, EPA csv+REST, and LA County Spatial Data.
Using modern lean/agile methodology, we were willing to use many languages, frameworks, and libraries to solve this challenge in a fast and interactive way. The languages included Javascript, Python, Java, and Scala, and we used frameworks including PlayFramework, Amazon AWS, Twitter Bootstrap (html,css), jQuery, jQueryUI, moment.js, d3.js, The Noun Project (svg icons with Creative Commons licenses), Apache AXIS WSDL client, and the Python dbpfy client.
We encountered problems with some of our data iterations. We discovered that implementations were out of scope for a weekend project. Technologies used but ultimately rejected include the python dbf library, the python pyDBF library, OpenLayers, the osgeo toolkit (gdal, ogr, gdalconst), and pyKML.

Log in or sign up for Devpost to join the conversation.