-
thumbnail.
-
dashboard.
-

vis1.
-
vis2.
-
vis3.


About the Project
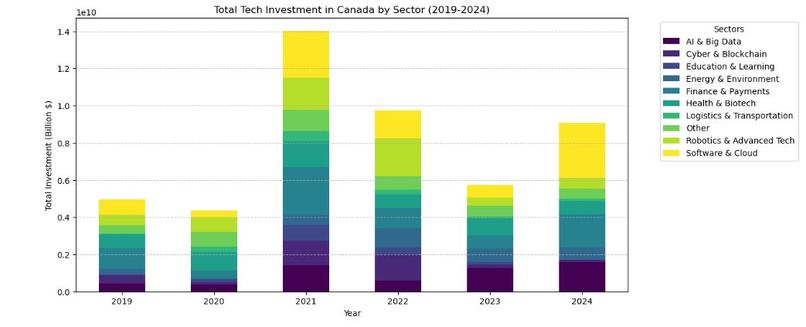
We wanted to take a closer look at how venture capital moves through the Canadian startup ecosystem. With data from thousands of funding deals, companies, and investors, our goal was to find patterns in investment activity and what they might mean for startups and investors.
At first, the numbers gave us a solid overview - where money was going, which sectors were growing, and how investors were connected. But we kept running into the same issue: the data could tell us what happened, but not why.
Why do some startups raise funding while others don’t? Why do certain investors keep showing up in the biggest deals? Why do investment trends shift the way they do? The numbers alone couldn’t answer these questions. Real-world factors, like new technology, industry changes, and investor strategies play a huge role, but they aren’t easy to track in a spreadsheet.
That’s what led us to VCDash, a tool that makes it easier to connect data with real-world context.
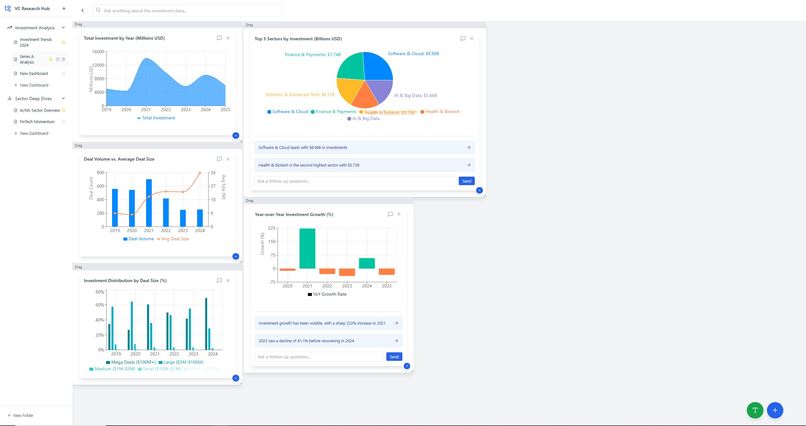
Introducing VCDash
The idea behind VCDash is simple: research should be more flexible, more visual, and more intuitive. While dashboards and static reports have their place, analysts and investors also need a way to move things around, make connections, and bring in extra context when they need it.
We wanted the tool to have two key features:
- A flexible visualization system - Users can organize insights however they want, rather than being locked into fixed layouts.
- An integrated research function – Instead of relying only on pre-loaded datasets, VCDash can pull in relevant external information - market trends, industry reports, emerging technologies - using a more advanced approach to internet research, similar to how OpenAI or Perplexity gather deep, real-time insights.
By combining structured data with live research, VCDash gives analysts a more complete view of what’s happening and why.
The Challenge
Building VCDash hasn’t been easy. We ran into two big challenges:
- Making it smooth and responsive – A standard dashboard wouldn’t work. We needed something interactive that wouldn’t lag or feel clunky.
- Balancing structure with flexibility – Some tools are too restrictive, while others feel overwhelming. We had to find a middle ground: something that helps users without boxing them in.
What’s Next
Right now, VCDash is still a barebones prototype. It does the basics, but there’s a lot of room to grow, with the first priority being implementing deep research thoroughly and systematically, so we can generate more reliable data/insights from multiple sources. Overall, though, we want more features, better usability, and ways to make it even more useful for investors and analysts.
Even in its early form, though, we think it has the potential to change the way people do creative research. There’s a big gap between raw data and real understanding, and VCDash is an attempt to close that gap. For now, we’re focused on testing, refining, and figuring out how to make it the best tool it can be.
Built With
- matplotlib
- numpy
- pandas
- python
- react
- recharts
- scikit-learn
- vite

Log in or sign up for Devpost to join the conversation.