Inspiration
We were inspired by the growing unpredictability of our environment. Cities face constant changes in temperature, air quality, and humidity, yet most systems only monitor data without explaining what drives those changes. We wanted to go a step further and build something that actually understands cause and effect in real time.
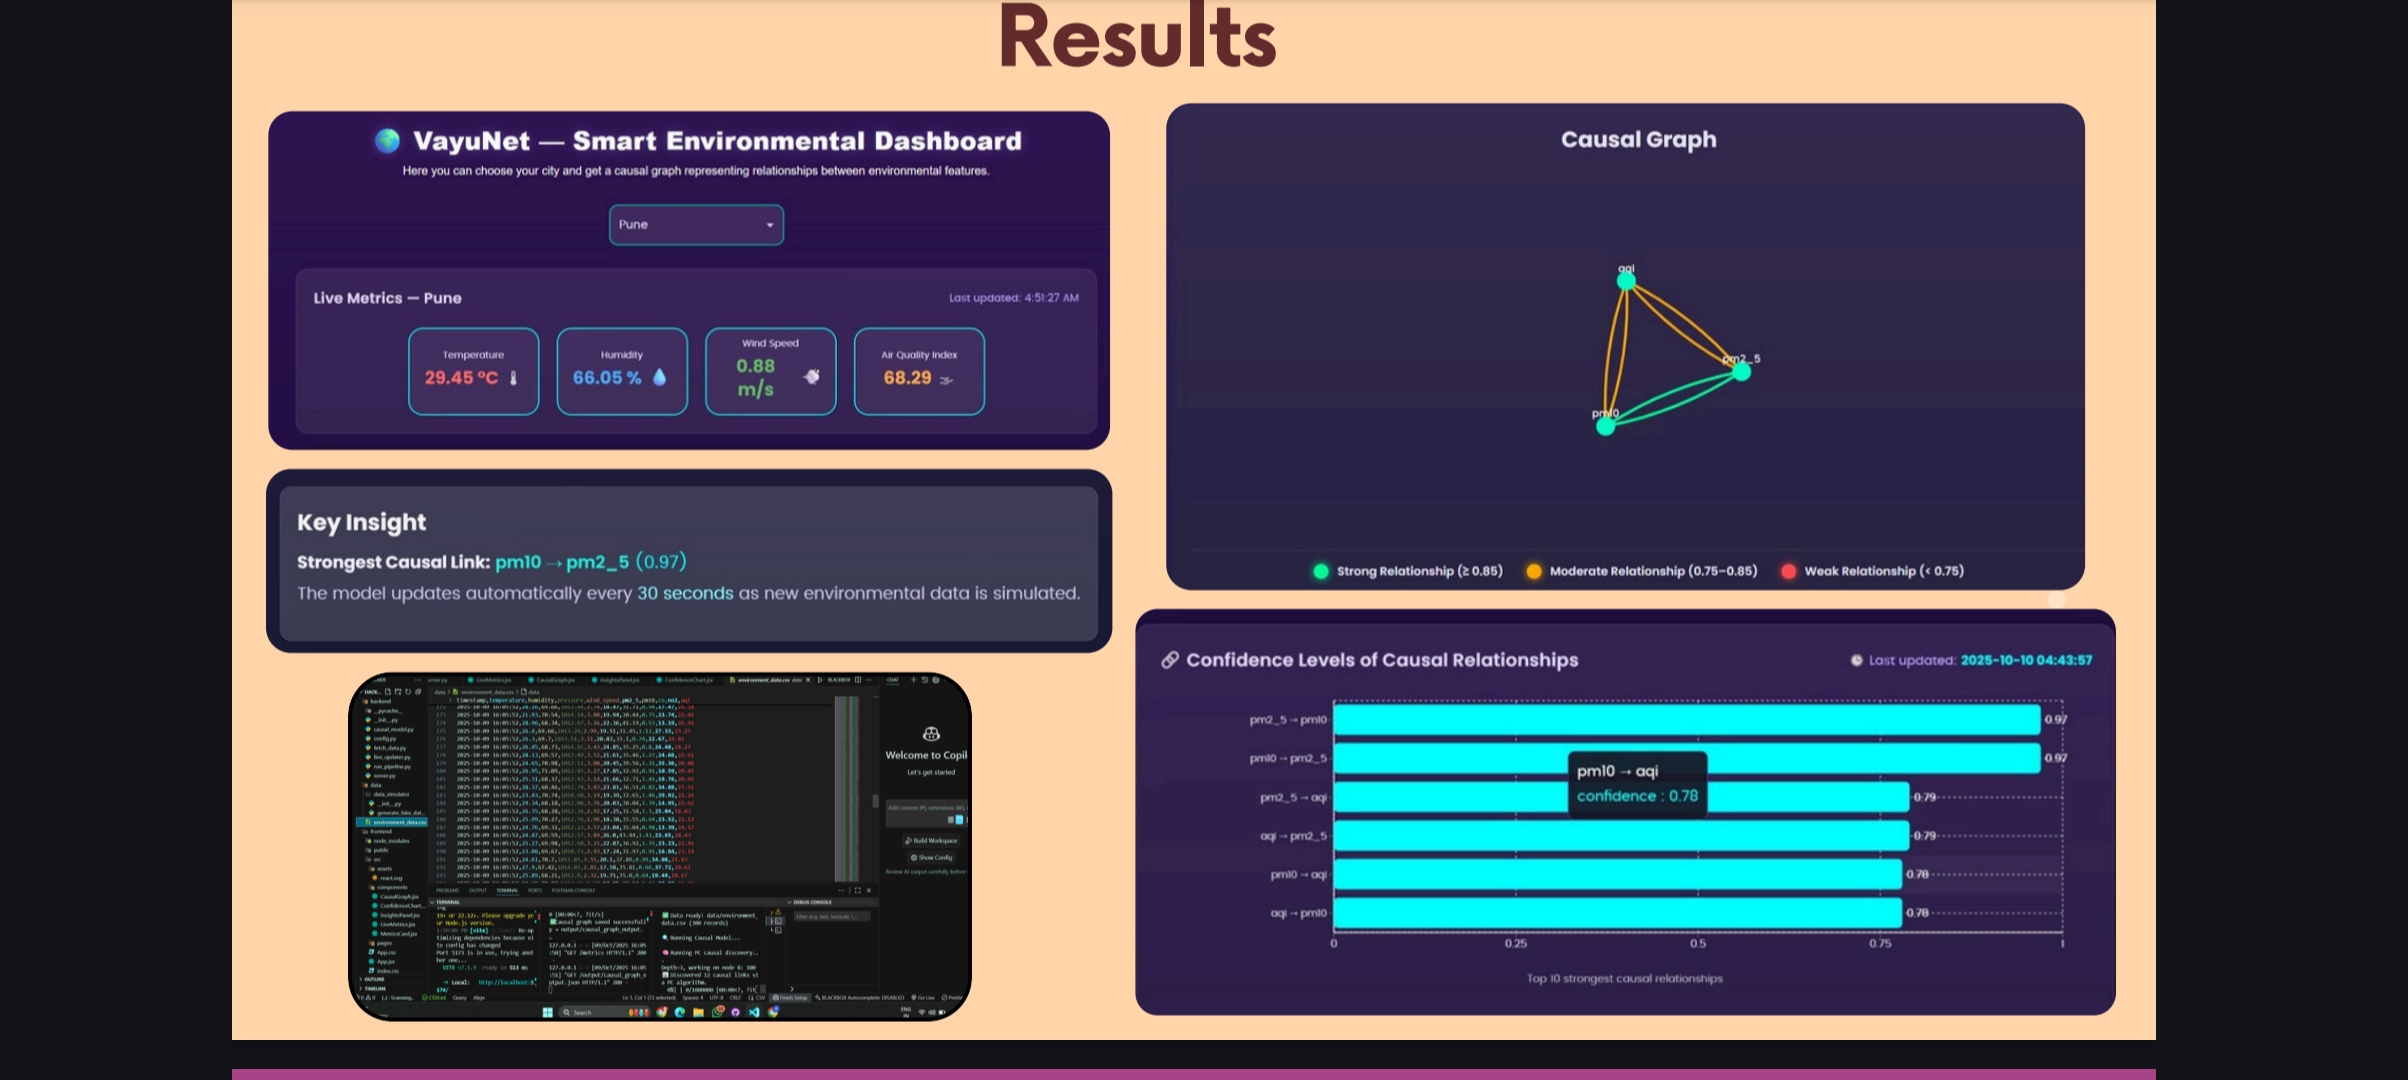
That idea became VayuNet – Dynamic Environmental Intelligence System, a platform that reveals hidden relationships between environmental factors and helps users understand not just what is happening, but why.
What it does
VayuNet continuously collects environmental data such as temperature, humidity, wind speed, and pollution levels. It uses AI-powered causal discovery models to uncover relationships between these features and shows them visually through interactive graphs and confidence scores.
For instance, it can highlight that a drop in wind speed and rise in humidity are likely causing a spike in PM2.5 levels in a particular city. The system updates automatically, giving users a real-time understanding of how different environmental factors influence one another.
How we built it
We combined constraint-based and score-based causal algorithms to create a hybrid discovery pipeline. Data was simulated for five cities with realistic variations in weather and air quality. After normalization, we applied two algorithms:
PC Algorithm for finding independent relationships between variables. Hill Climbing with BIC Score to optimize the causal structure.
The Bayesian Information Criterion (BIC) helps ensure the model remains simple yet accurate, since lower BIC values indicate better models.
Confidence scores are calculated using the correlation coefficient, with a slight bonus when both algorithms agree. The backend runs on Flask and the data refreshes every 30 seconds, while the frontend is built in React using Material UI and Framer Motion for smooth and responsive visualizations.
Challenges we ran into
Tuning the causal discovery algorithms for different data sizes was tricky, especially maintaining speed while analyzing thousands of records. Simulating realistic multi-city data with believable fluctuations also took several iterations. Another challenge was ensuring the system remained interpretable to non-technical users while maintaining scientific accuracy.
Accomplishments that we're proud of
We successfully built a live AI dashboard that shows environmental cause-and-effect in real time. The system runs entirely on free cloud tools like Render, Firebase, and MongoDB Atlas. We also achieved stable causal insights that matched expected real-world patterns, such as the connection between humidity and particulate matter levels.
What we learned
We learned how to merge two different AI approaches to get more reliable causal results. We also discovered the importance of data normalization and quantization before model training. More importantly, we realized that explainable AI is about reasoning, not just prediction.
What's next for VayuNet–Dynamic Environmental Intelligence System
The next version will use real-world APIs such as OpenWeatherMap and AirVisual to pull live data directly from sensors. We plan to add multimodal inputs, like satellite images and sound data, and transform VayuNet into a full SaaS platform for smart cities, industries, and research institutions. Eventually, it will provide a public API that anyone can use to analyze environmental cause-and-effect globally


Log in or sign up for Devpost to join the conversation.