Inspiration
A risk score is just a number: it doesn't tell a doctor or a patient where in the heart the risk is. We wanted to put a model's predictions onto the heart itself: one estimate for each coronary artery, shown on a 3D model and explained input by input.
What it does
Vascora takes 55 routine clinical inputs (demographics, history, vitals, blood tests, ECG and echocardiography) and predicts:
- overall coronary artery disease (CAD)
- narrowing (stenosis) of the LAD, LCX and RCA, the three main coronary arteries
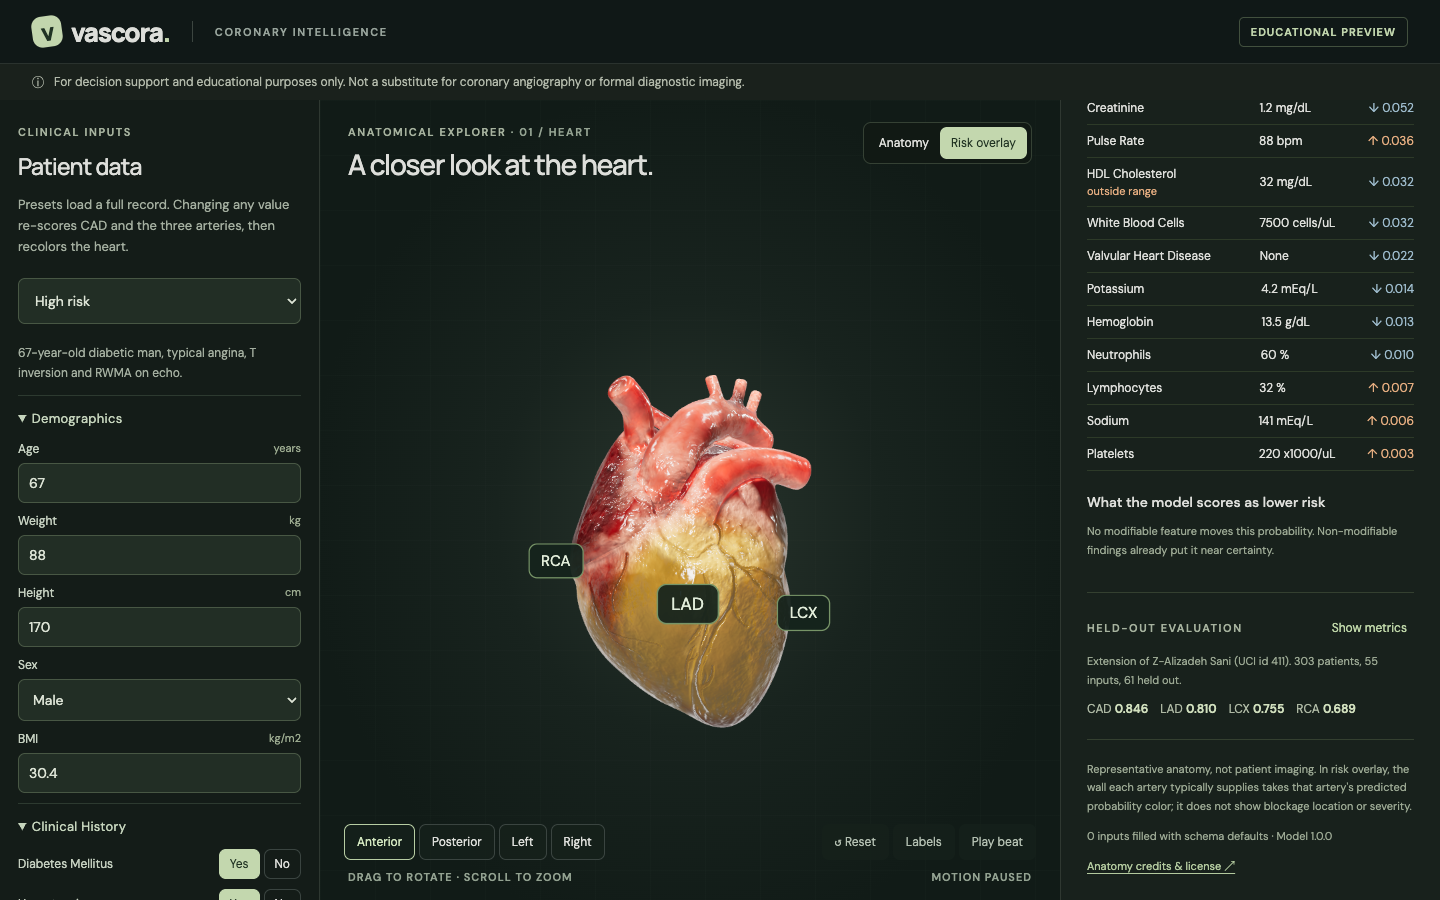
The results appear on an interactive 3D heart. In the risk overlay, the wall each artery supplies is coloured by that artery's probability: the LAD on the front, the LCX on the left side, and the RCA on the right side and underside. You can rotate and zoom, switch between four camera views, turn on labels, and click a region of the heart to select its artery.
The clinical dashboard shows:
- the CAD probability and each artery's probability, its decision threshold, and a 90% confidence interval
- a SHAP breakdown of why the model predicted that risk, grouped by clinical category, with every measurement listed alongside its contribution and out-of-range flags
- what-if hints: changes to modifiable factors that the trained model scores as lower risk. For example, on our moderate-risk sample, removing hypertension lowers predicted CAD from 17% to about 5%
- live re-scoring: change any input and the numbers and the heart update within about half a second
- held-out evaluation metrics
A safety notice (a first-visit popup plus a permanent banner) makes clear it is for decision support and education only, not a substitute for angiography or diagnostic imaging.
How we built it
- Data: the UCI Extension of Z-Alizadeh Sani dataset (303 patients, 55 features). The LAD, LCX, RCA and Cath labels are never used as inputs; this rule is enforced in code and covered by tests.
- Models: seven model types (elastic-net logistic regression, SVM, random forest, extra trees, XGBoost, LightGBM, CatBoost), each tuned with Optuna inside 5-fold × 3-repeat nested cross-validation. For each target, the top three are combined in a soft vote and calibrated with Platt scaling. We tested a CAD → LAD → LCX → RCA classifier chain and kept it only where it improved results. Decision thresholds are chosen on out-of-fold predictions, and a 90% confidence interval comes from ten bootstrap refits of the whole model.
- Explainability: permutation SHAP on the full ensemble, in log-odds, so each prediction's contributions add up exactly to the model's output.
- Backend: FastAPI with Pydantic validation. The patient form and its validation are generated from one shared feature list.
- Frontend: React, TypeScript, React Three Fiber and Zustand. A custom shader colours the realistic heart model by coronary territory.
- One shared contract: the names
CAD,LAD,LCXandRCAare the same in the model, the API and the 3D view, defined in one shared registry. New features or arteries need no redesign. - Testing: pytest for the ML pipeline and the API, Vitest for the frontend, and 16 Playwright browser tests covering clicks on the heart, labels, live updates, error states and layout on four screen sizes.
Results (61 held-out patients, never used in training)
- CAD: ROC-AUC 0.85, F1 0.82
- LAD: ROC-AUC 0.81, F1 0.80
- LCX: ROC-AUC 0.76, F1 0.70
- RCA: ROC-AUC 0.69, F1 0.54
Nested cross-validation scores are higher (CAD 0.95 AUC), but we report the held-out numbers because they are the honest ones to quote.
Challenges we ran into
- Small data: with only 303 patients, a single train/test split can mislead. We used nested cross-validation and bootstrap confidence intervals, and we report the gap between cross-validation and held-out results openly.
- Target leakage: the dataset contains the artery labels themselves, so we wrote an automated guard and tests to make sure they never become inputs.
- Realistic heart vs. colour for each artery: the most realistic open heart model is a single mesh, so individual arteries couldn't be recoloured. We solved this with a shader that colours each artery's territory on the realistic surface.
Accomplishments that we're proud of
- An end-to-end system: from clinical inputs to calibrated predictions, explanations and a 3D view, with live updates.
- Honest evaluation: a held-out test set, confidence intervals, and no leakage.
- A clinically careful interface: uncertainty is shown rather than hidden, and the colours are clearly labelled as probabilities, not lesion locations.
What we learned
- On small medical datasets, calibration and validation design matter more than model size.
- A good explanation has to map back to individual clinical measurements to be useful.
What's next for Vascora
- Adding imaging inputs such as ECG waveforms and echo images
- Validation on larger, external patient cohorts
- PDF patient reports, an x-ray torso view, and a hosted demo
Credits
Dataset: UCI Machine Learning Repository, Extension of Z-Alizadeh Sani (id 411). 3D heart: "Realistic Human Heart" by neshallads (Sketchfab, CC BY 4.0). Coronary reference model adapted from Z-Anatomy / BodyParts3D (CC BY-SA 4.0).
Disclaimer: for decision support and educational purposes only. Not a substitute for coronary angiography or formal diagnostic imaging.
Built With
- blender
- catboost
- fastapi
- lightgbm
- numpy
- optuna
- pandas
- playwright
- pydantic
- python
- react
- react-three-fiber
- scikit-learn
- shap
- three.js
- typescript
- uv
- vite
- vitest
- xgboost
- zustand


Log in or sign up for Devpost to join the conversation.