Vantage — Location Intelligence for Franchise Founders
What Inspired Us
The idea started with a single conversation. A gym founder told us he'd spent three weekends walking around Sydney suburbs, trying to decide where to open his next location. He eventually hired a consultant — $12,000, six weeks, a PDF report. The location underperformed within 18 months.
The data to have made a better decision existed all along. Foursquare's Open Source Places dataset contains 100 million real-world venues globally — every café, gym, pharmacy, and office, with open dates, close dates, and exact coordinates. Nobody had built a product that used this data to answer the specific question franchise founders actually face:
"Where should I open next — and how do I know it will work?"
We wanted to build that product in 48 hours.
The Core Idea
The academic insight that anchored everything came from a Sage Journals paper showing that POI (Point of Interest) ecosystem data alone can predict business trajectory with 86% accuracy — no revenue data required.
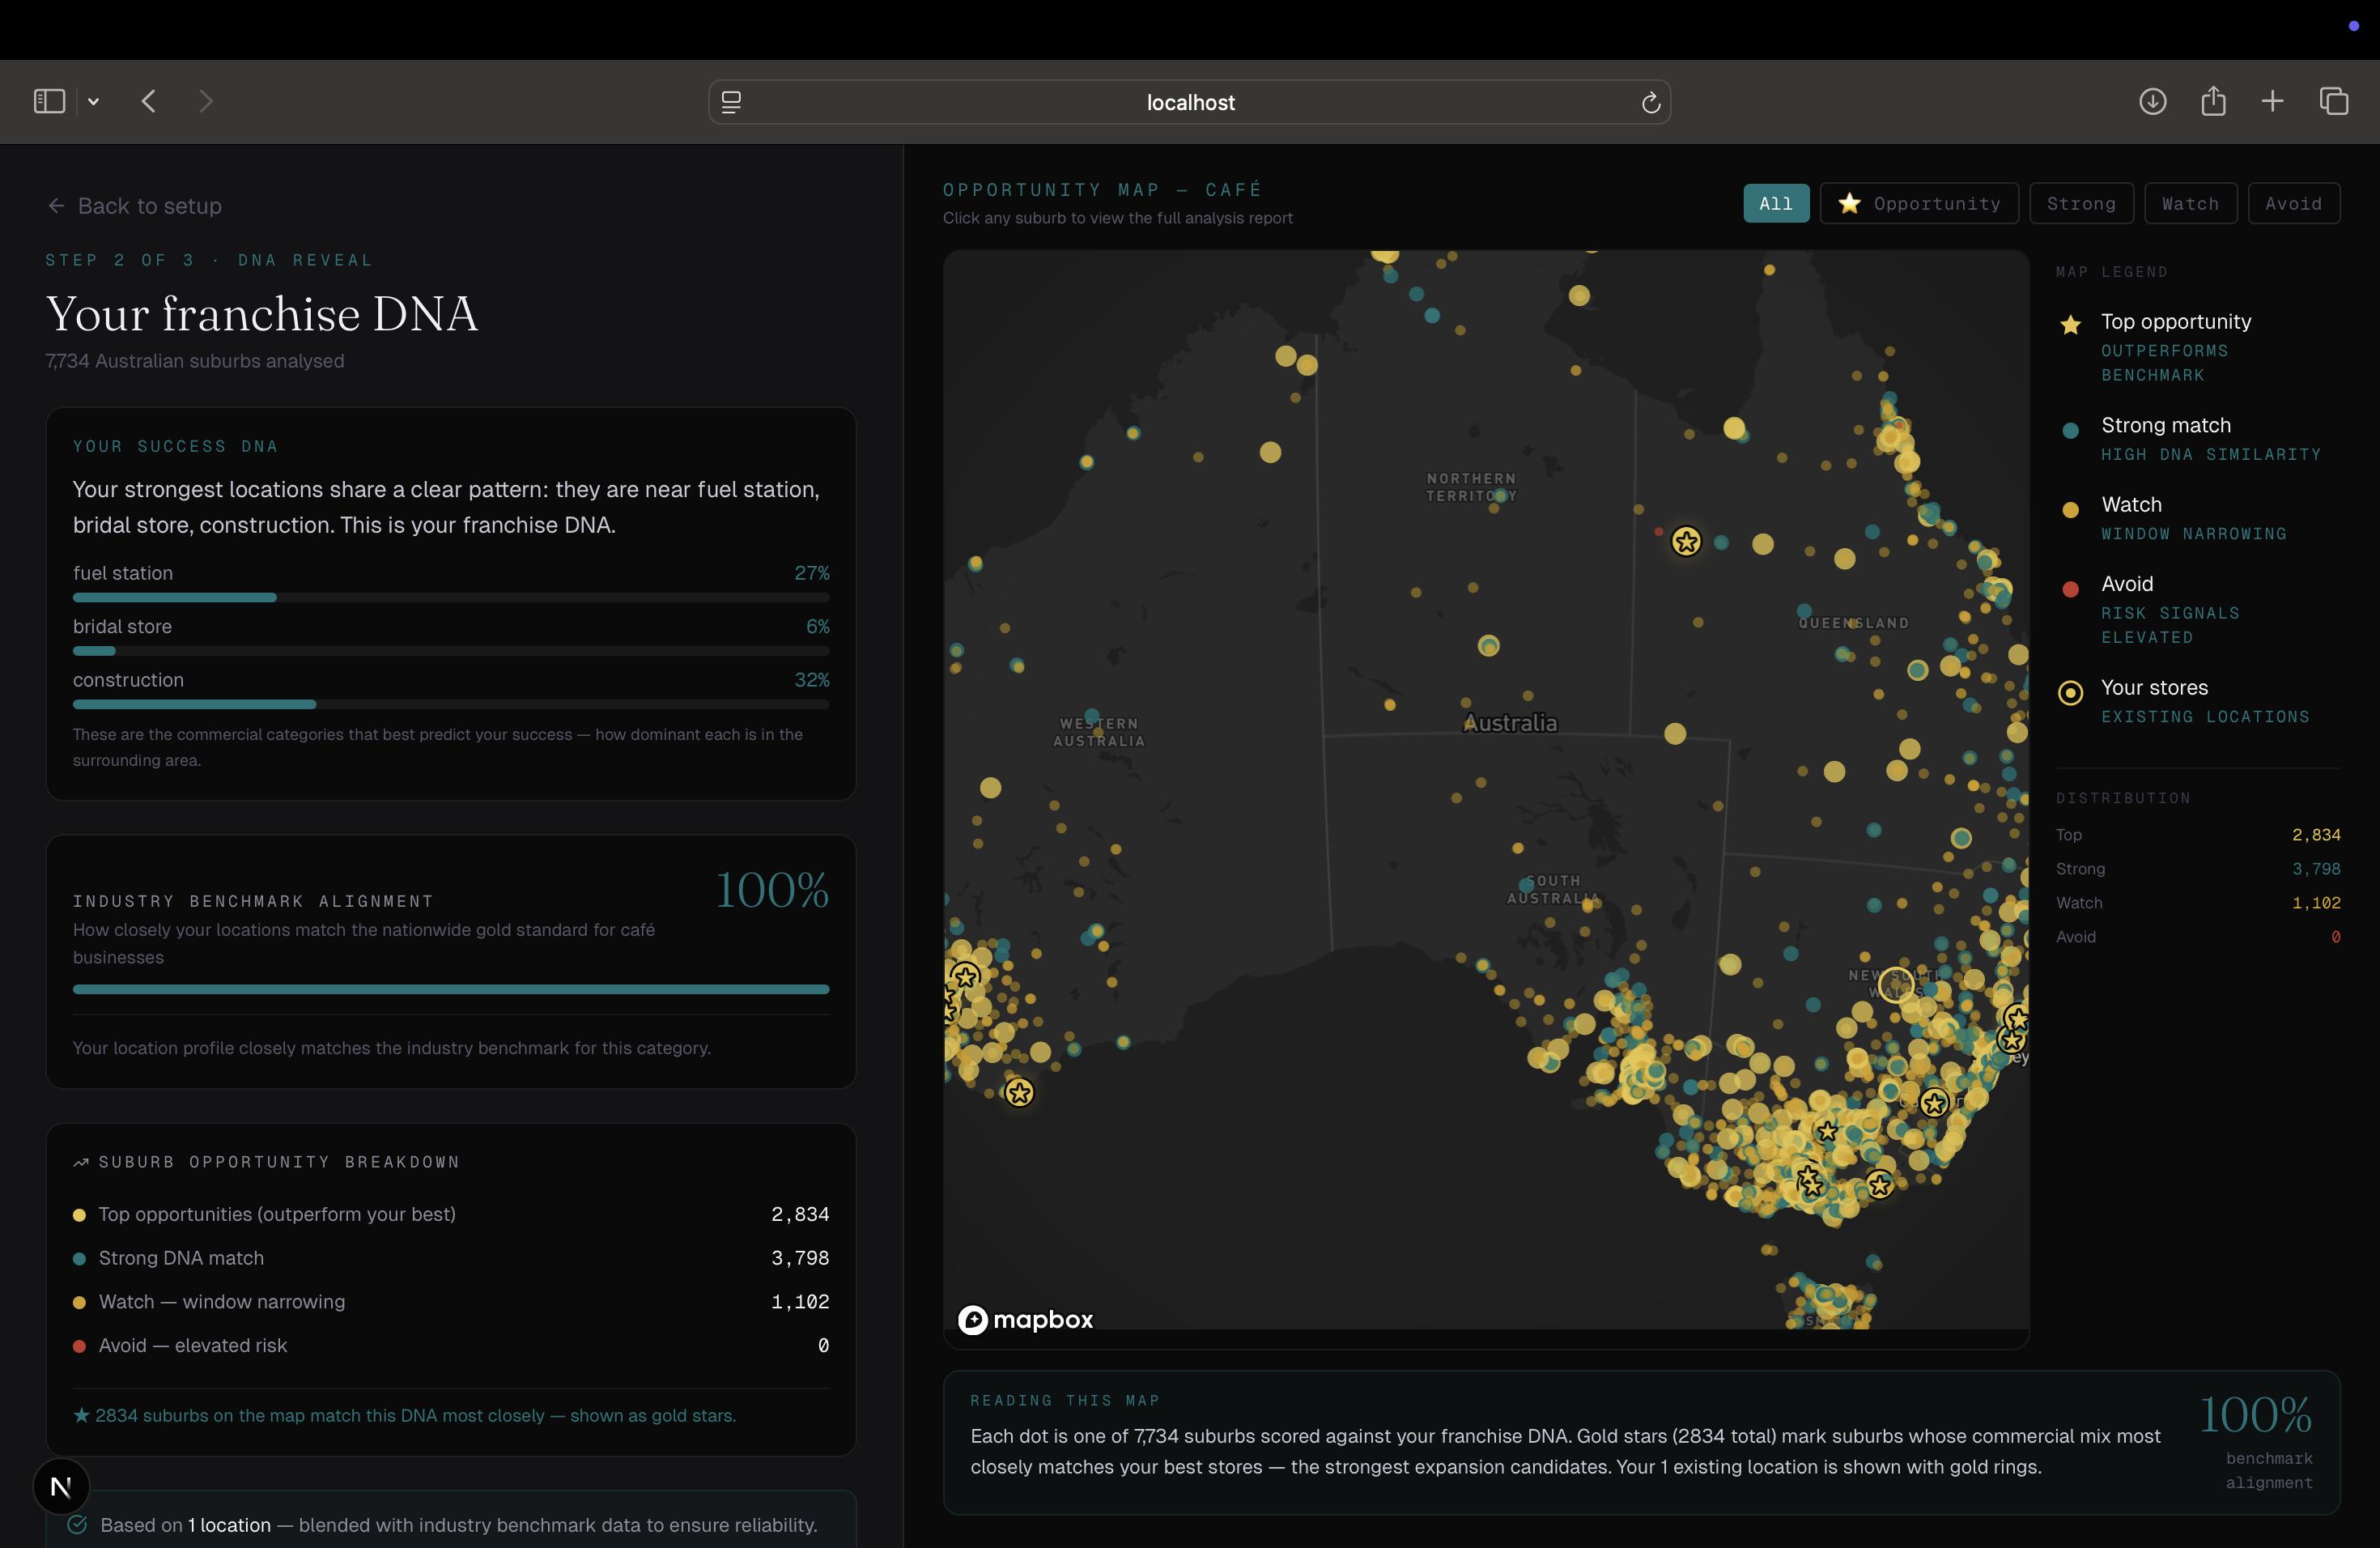
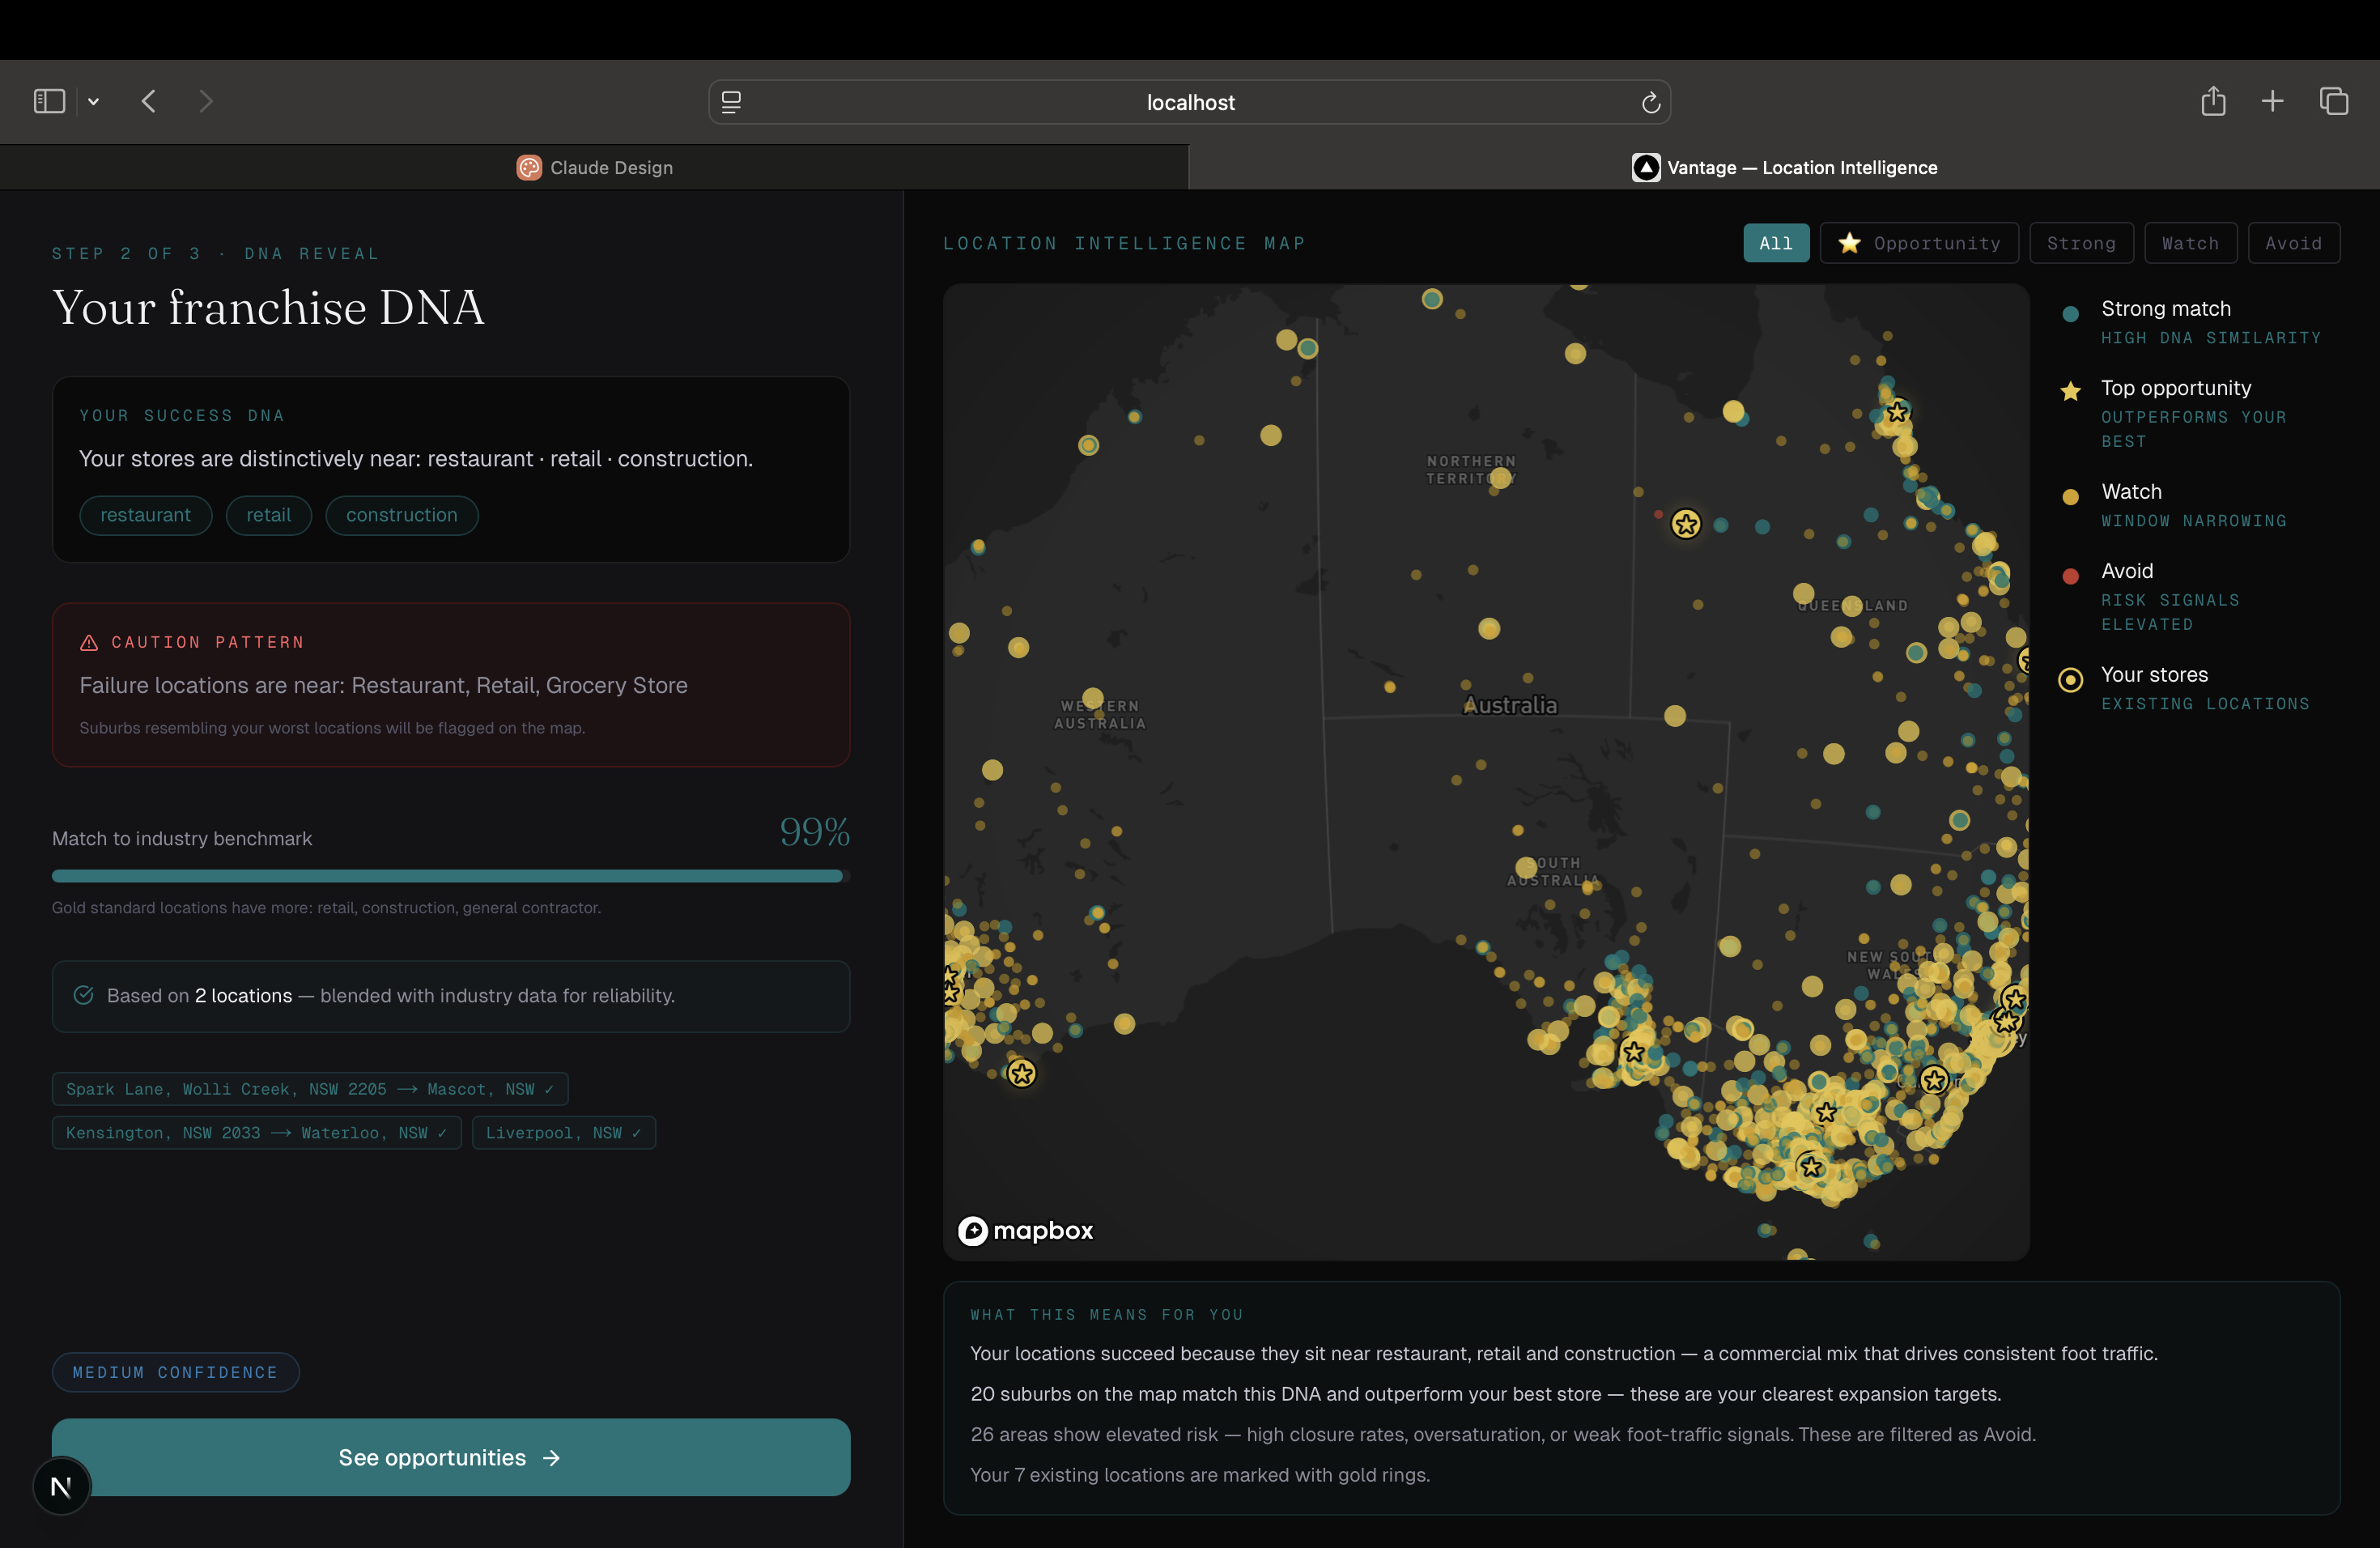
The hypothesis: successful businesses in the same category tend to be surrounded by the same mix of other businesses. A thriving gym tends to be near offices, cafés, and allied health. A thriving pharmacy tends to be near medical centres, supermarkets, and aged care. This surrounding commercial mix is the location DNA.
If we could decode that DNA from a founder's existing stores — and then find every suburb in Australia with the same DNA — we could surface opportunities they'd never have thought to look at.
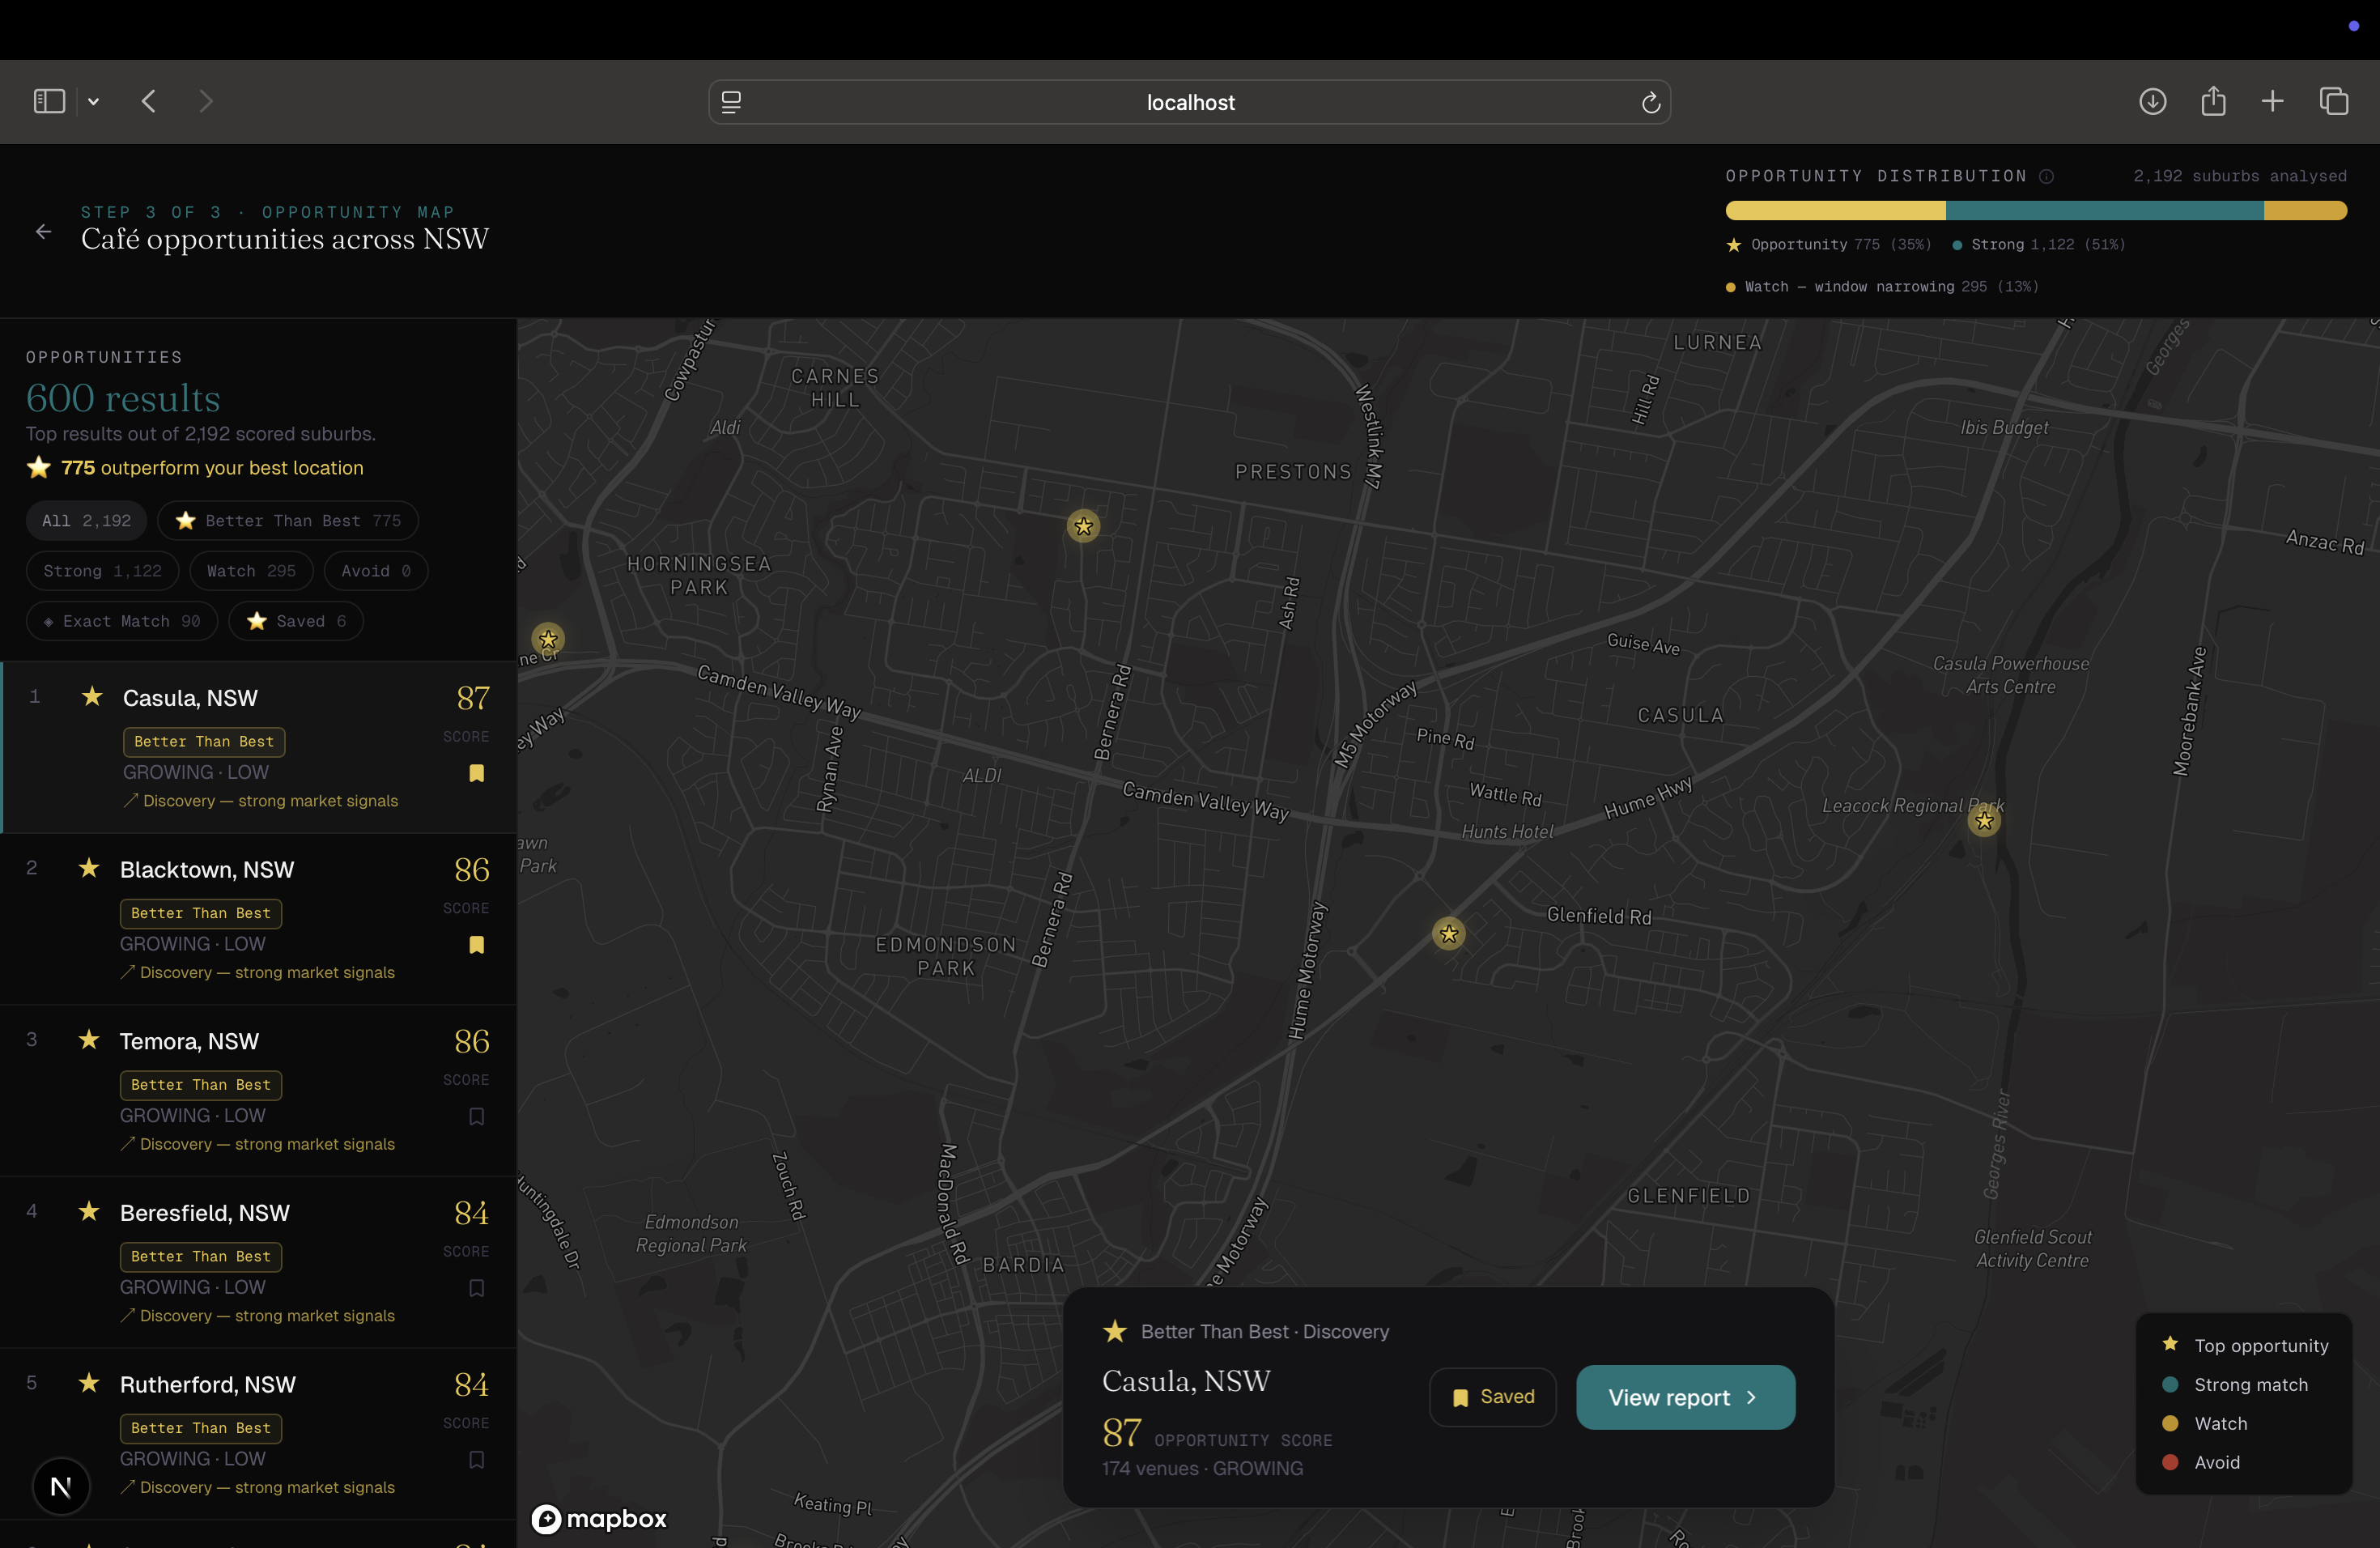
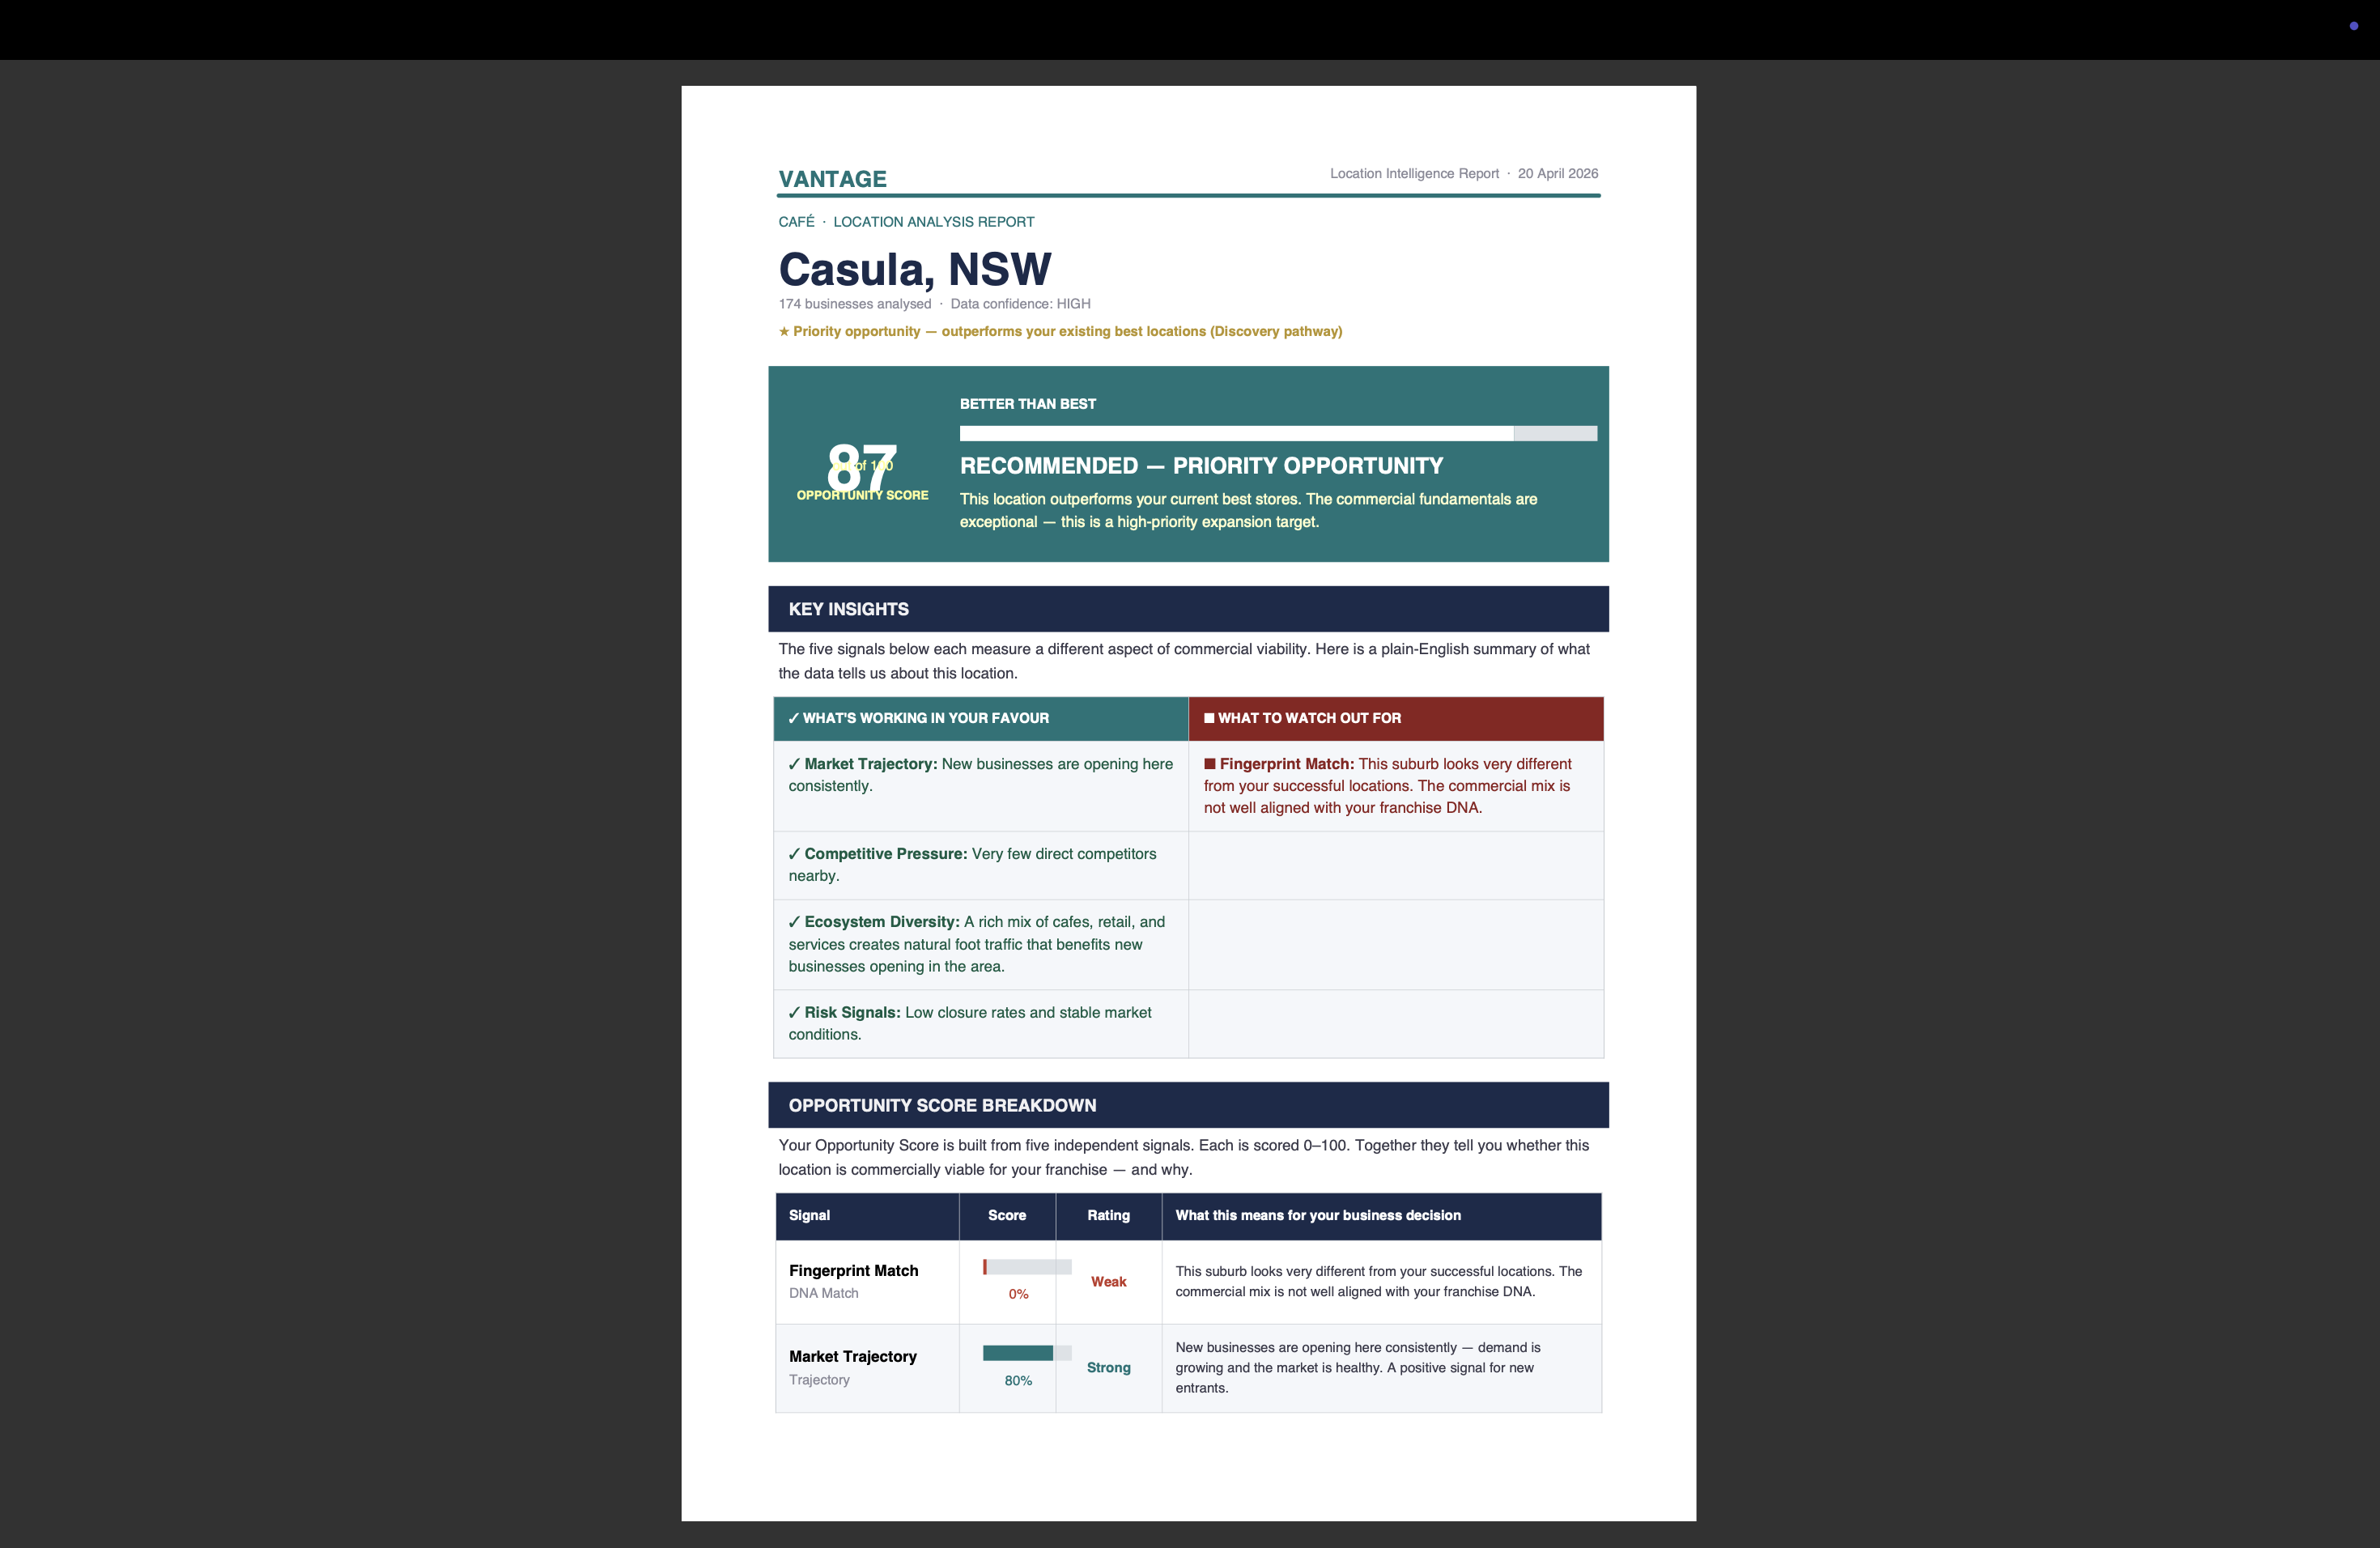
We called suburbs that score higher than the founder's own locations the "better than best" discoveries. These are the Gosford CBDs of the world — places the founder has never considered, that the data says will outperform their existing portfolio.
How We Built It
The Data Pipeline
We downloaded the full Foursquare OS Places dataset (~100M venues globally, 11GB) and filtered to 1,451,062 Australian venues across 7,734 H3 resolution-7 cells (suburb-level hexagonal spatial units).
After cleaning — dropping null coordinates, invalid flags,
non-commercial categories, and deduplicating on fsq_place_id
— we retained 1,099,070 clean venues.
The Intelligence Engine
Step 1 — TF-IDF Fingerprinting
For each suburb, we aggregate the category labels of all surrounding venues into a document string, then apply TF-IDF weighting:
$$ \text{tfidf}(t, d) = \text{tf}(t, d) \cdot \log\left(\frac{N}{1 + \text{df}(t)}\right) $$
This down-weights ubiquitous categories (restaurants, offices) and amplifies distinctive ones (coworking spaces, allied health, specialty coffee) — so the fingerprint captures what makes a location distinctive, not just what's there.
Step 2 — UMAP Embedding
We fitted a UMAP dimensionality reduction on all 7,734 suburb TF-IDF vectors:
$$ \text{UMAP}: \mathbb{R}^{500} \rightarrow \mathbb{R}^{2} $$
with parameters n_neighbors=15, min_dist=0.1,
metric='cosine', preserving the neighbourhood structure of
commercial ecosystems. Suburbs with similar commercial DNA
cluster together in 2D space. The result is a visual map of
every Australian suburb's commercial character — and the
"better than best" detection becomes a geometric operation:
find all suburbs closer to the client's centroid in embedding
space than the client's own uploaded locations.
Step 3 — Gold Standard Computation
For each category, we identified all long-term survivors:
$$ \text{Survivors} = {v \mid \text{is_closed}(v) = \text{False} \land \text{age}(v) \geq 3\text{ years} \land \text{refreshed}(v) \leq 12\text{ months}} $$
For each survivor, we extracted the surrounding venue mix within a 500m H3 k-ring and built its TF-IDF vector. Averaging across all survivors gives the gold standard vector — the industry-derived ideal commercial ecosystem for this category in Australia.
Step 4 — Five Scoring Signals
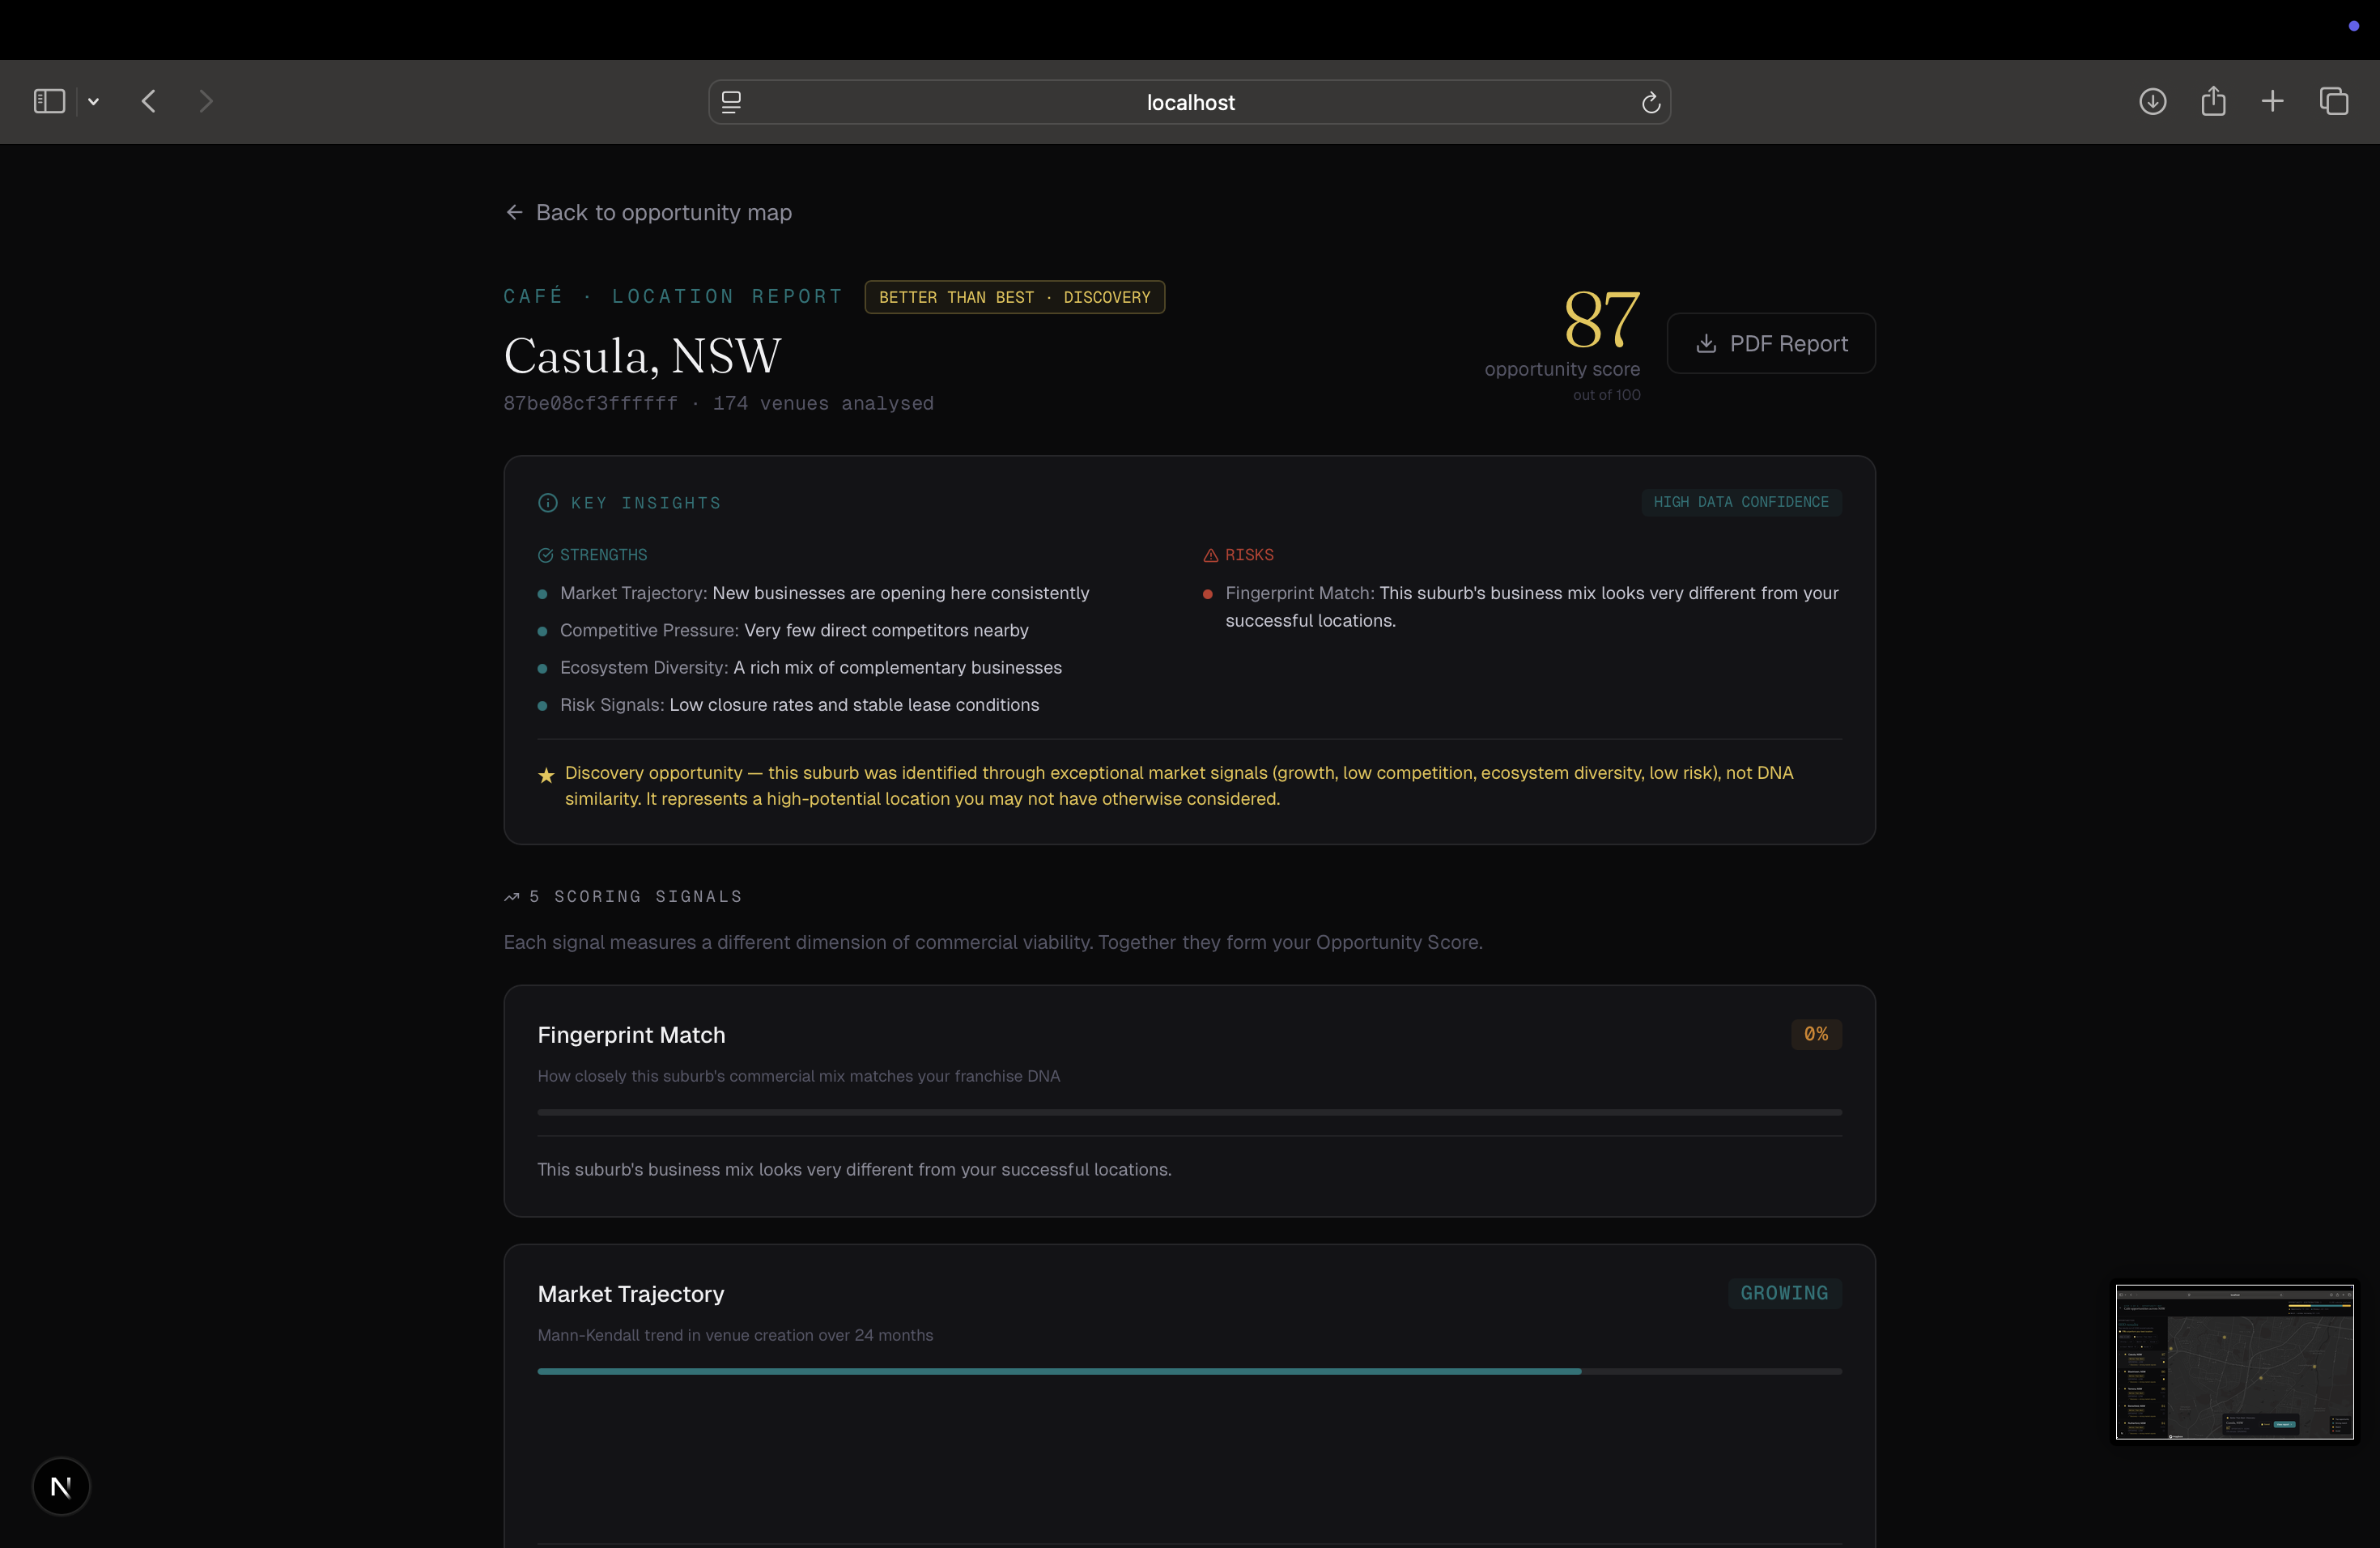
Each of Australia's 7,734 suburbs is scored across five signals:
| Signal | Method | Weight |
|---|---|---|
| Fingerprint Match | Cosine similarity to gold standard | 30% |
| Market Trajectory | Mann-Kendall non-parametric trend test | 25% |
| Ecosystem Diversity | Shannon entropy $H = -\sum p_i \log_2 p_i$ | 20% |
| Risk Signals | Closure rate + saturation + immaturity | 15% |
| Competitive Pressure | DBSCAN spatial clustering | 10% |
The composite score is:
$$ S_{\text{composite}} = \sum_{i} w_i \cdot s_i - \mathbb{1}[\text{failure_sim} > 0.70] \cdot 15 $$
where the final term is a failure penalty — applied when a suburb's commercial profile resembles the client's uploaded worst-performing locations.
Why Mann-Kendall over linear regression?
Linear regression forces a straight line through market data that doesn't move linearly. Mann-Kendall returns a p-value:
$$ p > 0.05 \Rightarrow \text{"no significant trend detected"} $$
We can honestly report market uncertainty instead of inventing a trend from noise.
Why no trained model for risk?
Only 11.9% of venues in the dataset have date_closed
populated. A classifier trained on these labels would learn
"what does a Foursquare-recorded closure look like" — not
"what predicts failure." We deliberately chose three
directly observable signals instead. Every risk score is
traceable to its source in one sentence.
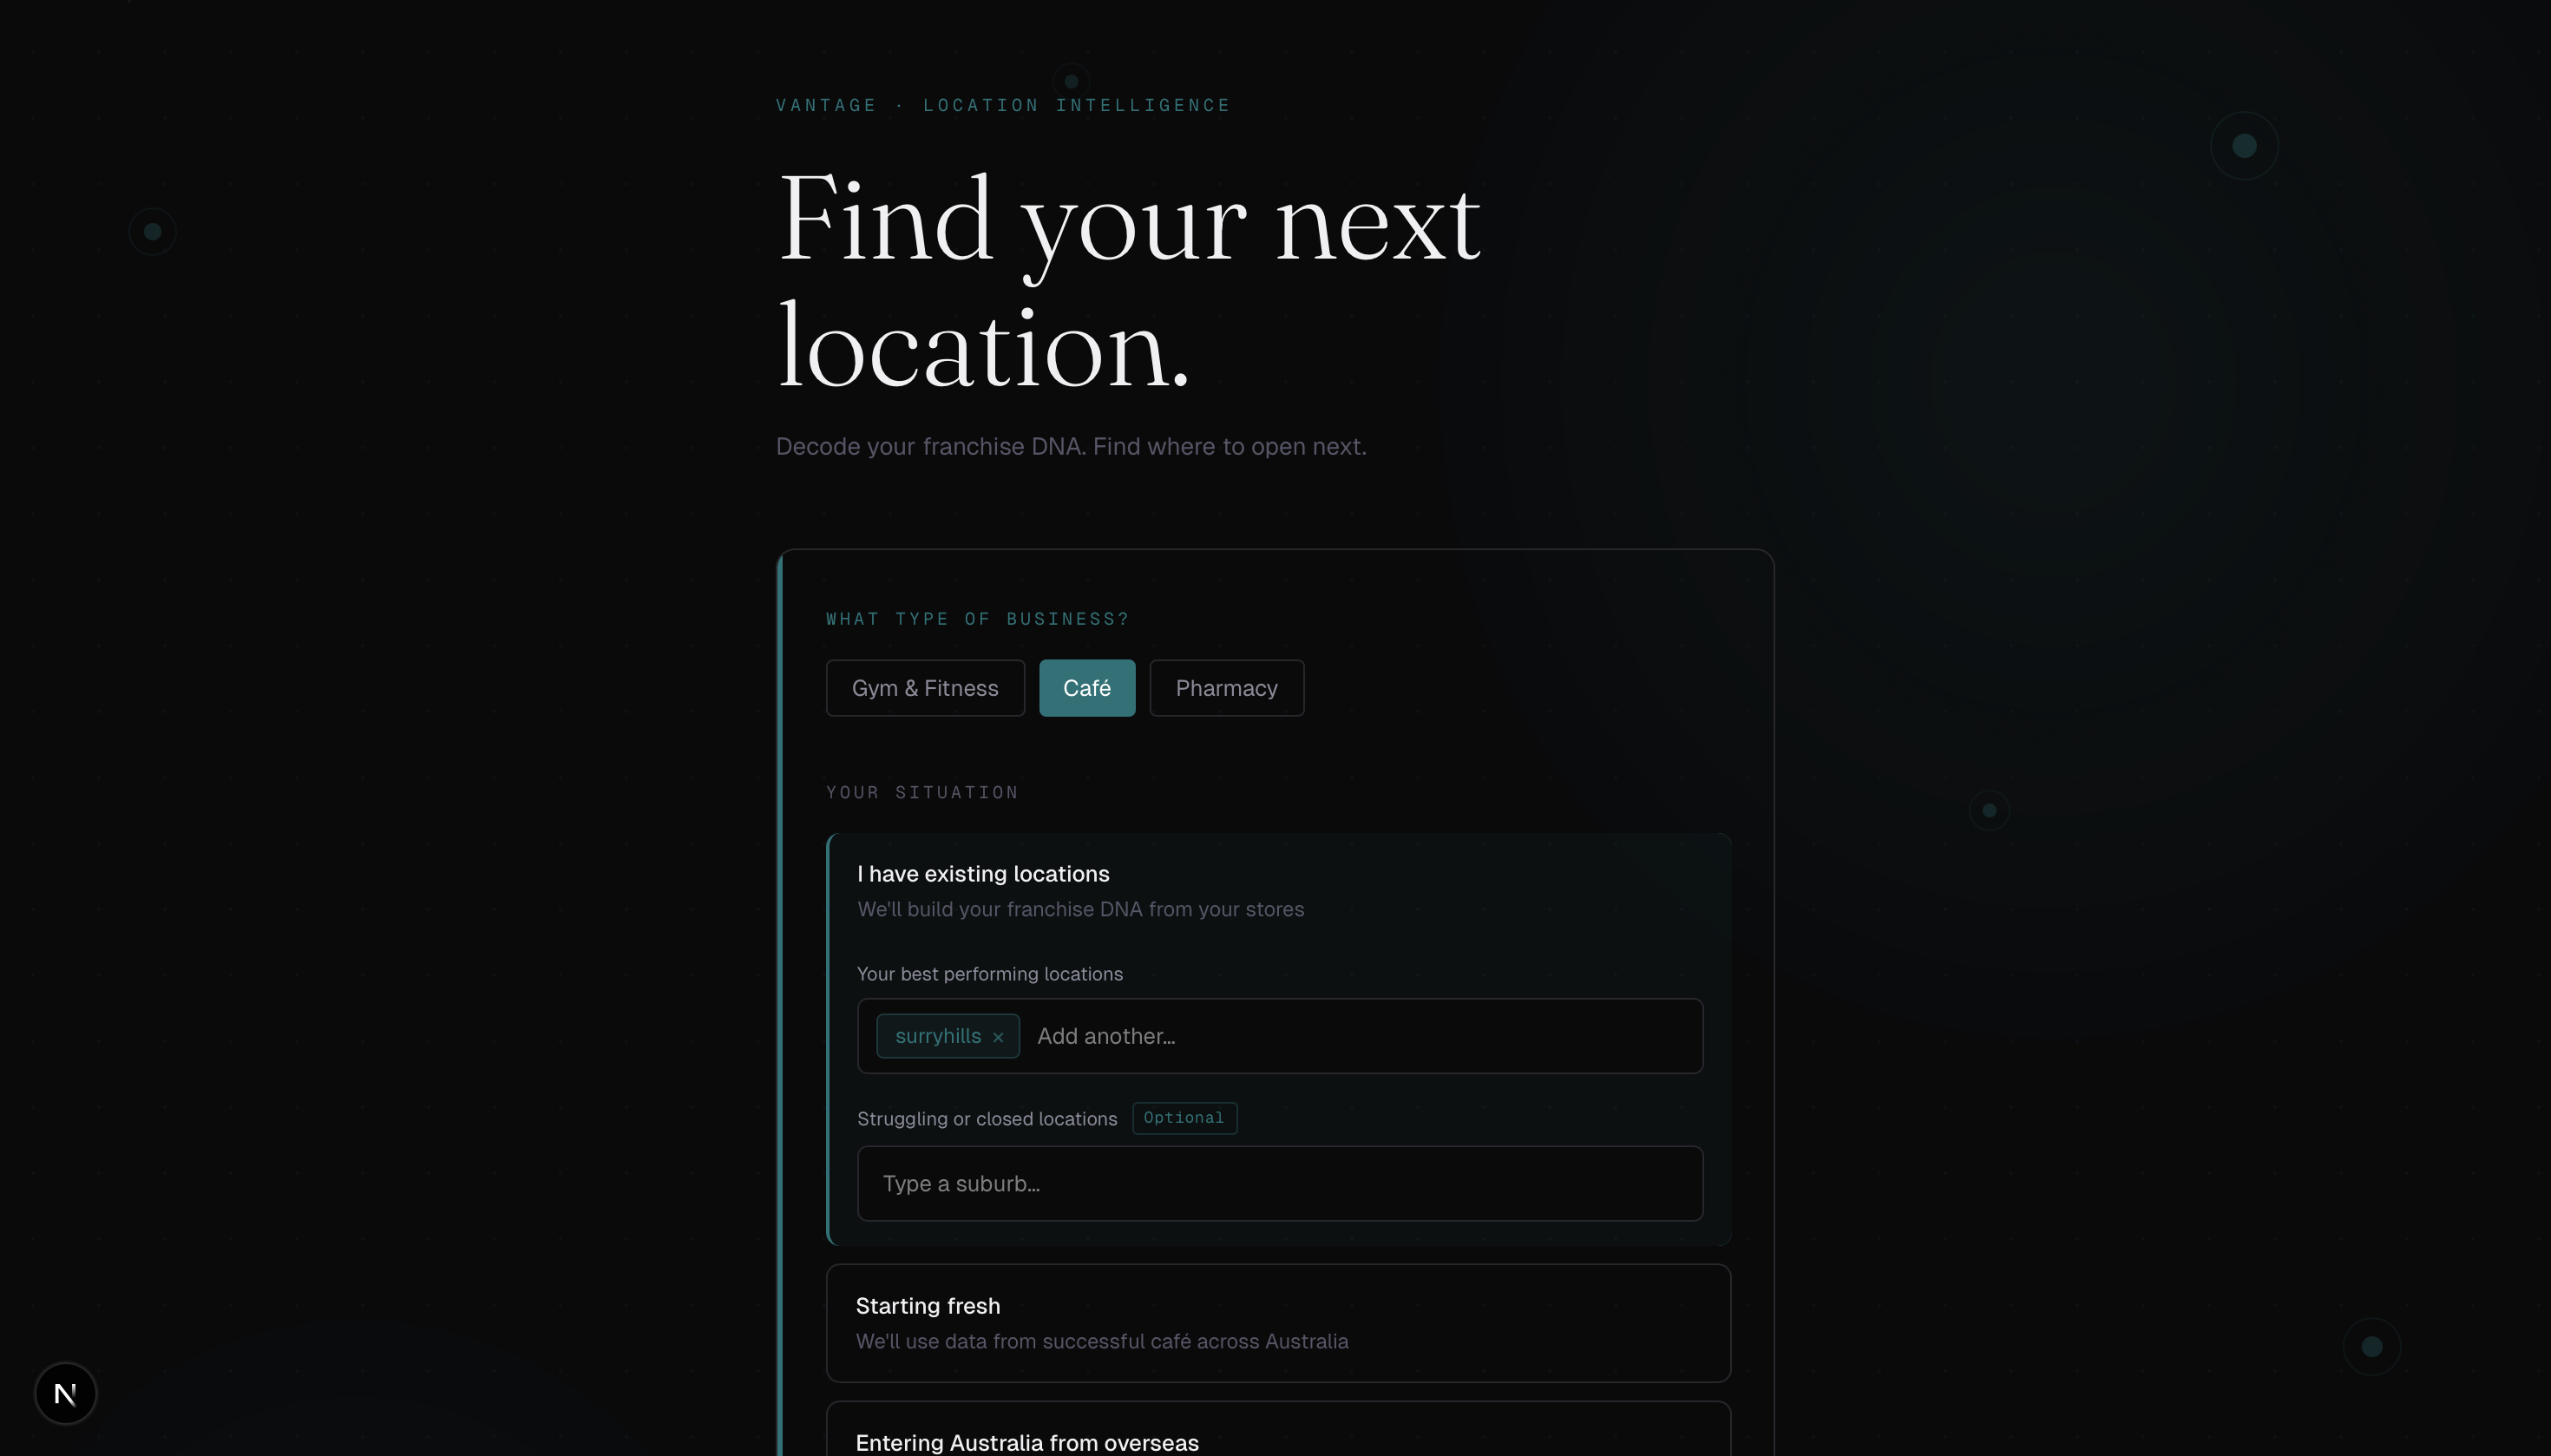
The Three User Paths
We built for three distinct entry points:
- Path A (Fresh start): No locations uploaded. We use the category gold standard exclusively.
- Path B (2–4 stores): Blended fingerprint, weighted by store count: $w_{\text{client}} \in {0.20, 0.35, 0.50, 0.65}$
- Path C (5+ stores): Full client DNA mode, $w_{\text{client}} = 0.80$
- International entrant: Gold standard as primary vector, UMAP nearest-neighbour translation to find Australian commercial equivalents of overseas success patterns.
The Stack
- Data: DuckDB + Foursquare Parquet + H3-py + sklearn TF-IDF + umap-learn + pymannkendall
- Backend: FastAPI + DuckDB + Python → Railway
- Frontend: Next.js 15 + TypeScript + Tailwind + Mapbox GL JS + SVG scatter → Vercel
- Pipeline runtime: Google Colab T4 GPU (full AU pipeline: ~6.5 minutes)
What We Learned
1. Data quality shapes everything upstream. The 6% → 11.9% date_closed discovery changed our risk scoring approach. EDA first, architecture second — always.
2. Explainability is a competitive advantage. Every other location tool is a black box. Being able to say "this score comes from Mann-Kendall p=0.03 on 36 months of venue creation data" is not a limitation — it's the pitch.
3. Zero trained models was the right call. With biased labels, any classifier would have learned the wrong thing. Statistical signals on ground truth data outperformed what a model could have done here, and they're defensible in a Q&A.
4. Pre-computation is a product decision, not just an
engineering one.
Scoring 7,734 suburbs × 3 categories before demo day means
the /scan endpoint returns in under 100ms. The demo never
waits. That's a product decision disguised as infrastructure.
5. UMAP is a storytelling tool. The 2D embedding scatter plot — teal clusters, gold stars, pulsing client rings — communicates the entire product concept in a single image before a word is spoken.
Challenges We Faced
Foursquare category hierarchy.
Labels like "[Dining and Drinking > Cafe, Coffee, and
Tea House > Café]" caused TF-IDF to tokenize words like
"drinking", "freight", "caf" as features. We had to
extract leaf category names before fitting the vectoriser.
UMAP runtime on real data. Fitting UMAP on 7,734 × 500 dimensional vectors locally was estimated at 45–60 minutes. We moved the pipeline to Google Colab T4 GPU and brought it down to under 7 minutes.
Suburb name resolution.
Users type "wollicreek", "surry hills", "st kilda".
Our database has "Wolli Creek", "Surry Hills",
"St Kilda". We implemented a two-tier geocoding approach:
fuzzy string matching with difflib.get_close_matches()
first, Nominatim (OpenStreetMap) as fallback — handling
virtually any suburb name variant with zero API cost.
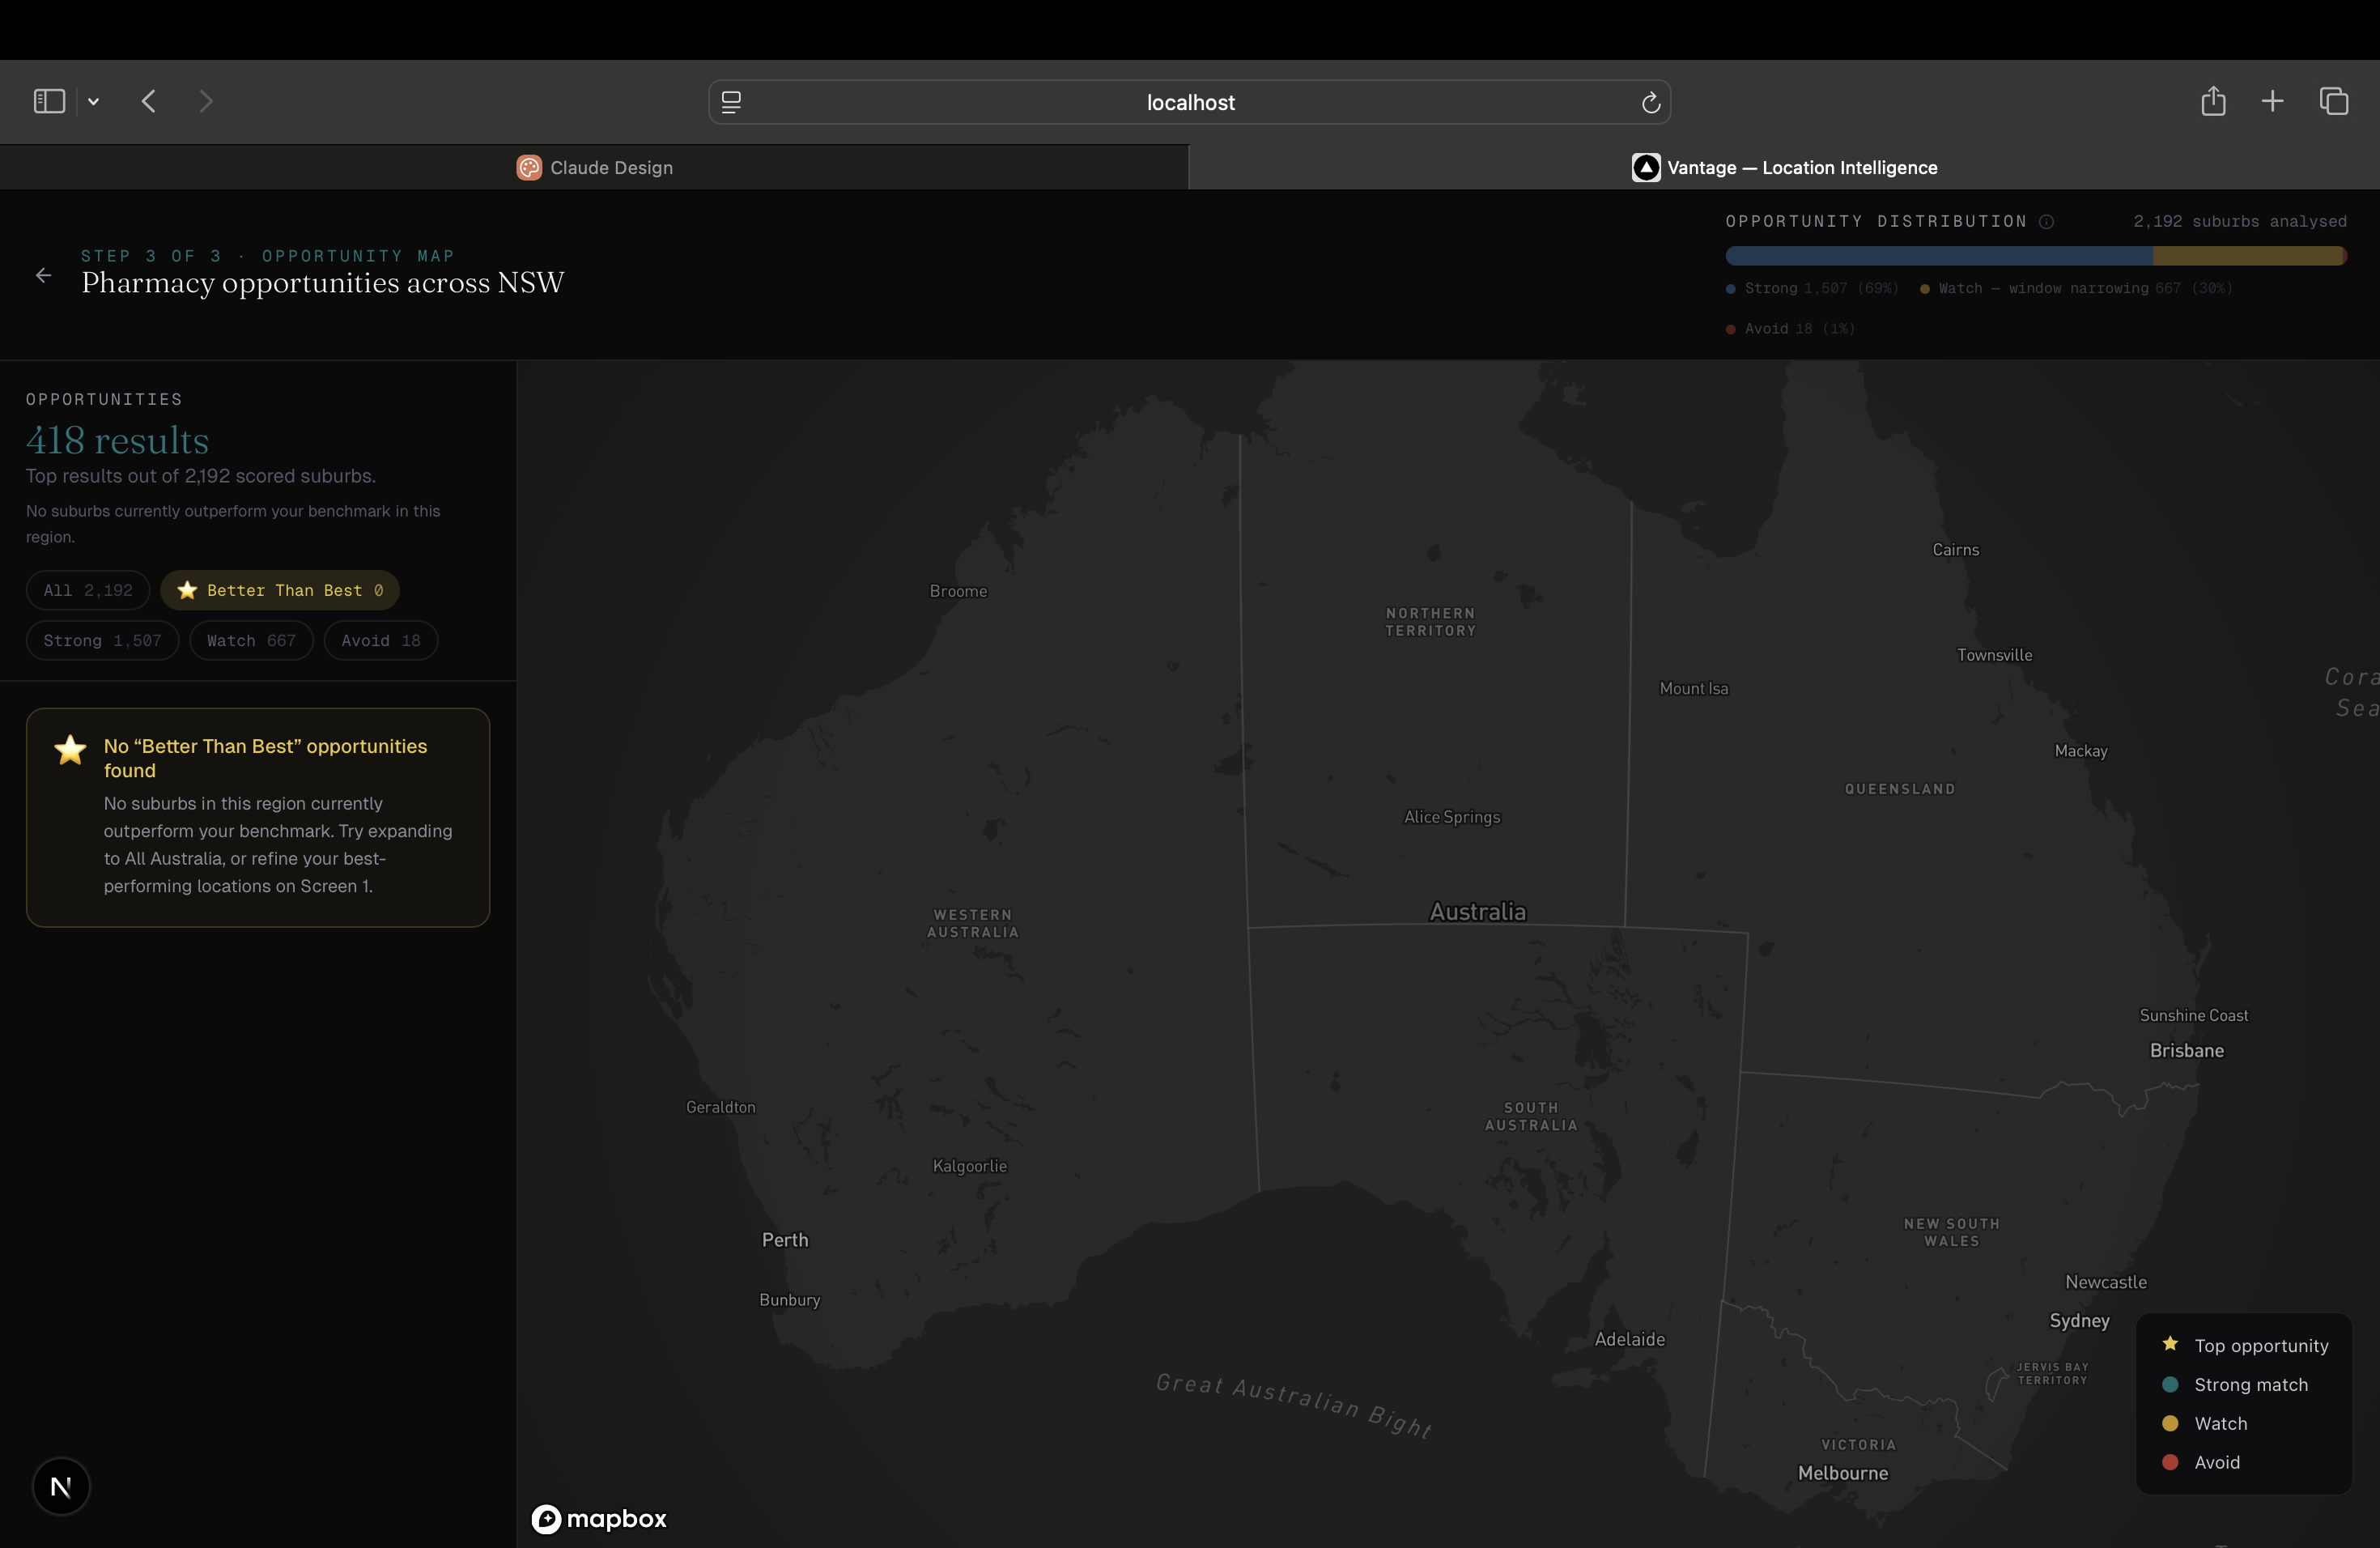
The "better than best" calibration. Pre-computing BTB flags without a client vector led to 800+ suburbs being incorrectly flagged. The insight: BTB is a runtime operation, not a precompute one. It requires the client's actual gold similarity mean as the threshold — a number that only exists after someone uploads their stores.
Unicode category encoding.
"Café" stored in DuckDB with a unicode accent caused 404s
when the URL-encoded Caf%C3%A9 was compared at the
database level. Fixed with NFKD normalisation on both sides
of every category comparison.
What's Next
- Add more categories beyond the initial three
- Weekly data refresh pipeline (Foursquare updates monthly)
- Subscription model: $299/month per brand
- The flywheel: every new store a customer opens feeds back into their fingerprint, making recommendations more personalised over time
- International expansion: same architecture, different country filter
Built at CommSTEM × SuData Data-Hack 2026. Data: Foursquare OS Places (Apache 2.0). "Find the locations your competitors haven't thought to look — before the window closes."
Built With
- anthropic
- claude
- claude-code
- duckdb
- fastapi
- foursquare-open-source-places
- framer-motion
- git
- google-colab
- google-fonts
- h3-py
- huggingface-hub
- joblib
- mapbox
- mapbox-gl-js
- next.js-15
- nominatim-openstreetmap
- numpy
- pandas
- pydantic
- pymannkendall
- python
- railway
- react-map-gl
- recharts
- reportlab
- scikit-learn
- scipy
- shadcn/ui
- sonnet
- sql
- tailwind-css
- typescript
- umap-learn
- uvicorn
- vercel


Log in or sign up for Devpost to join the conversation.