-
-
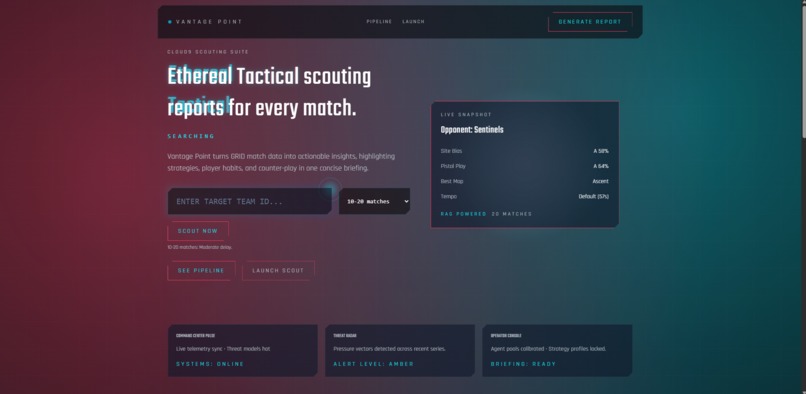
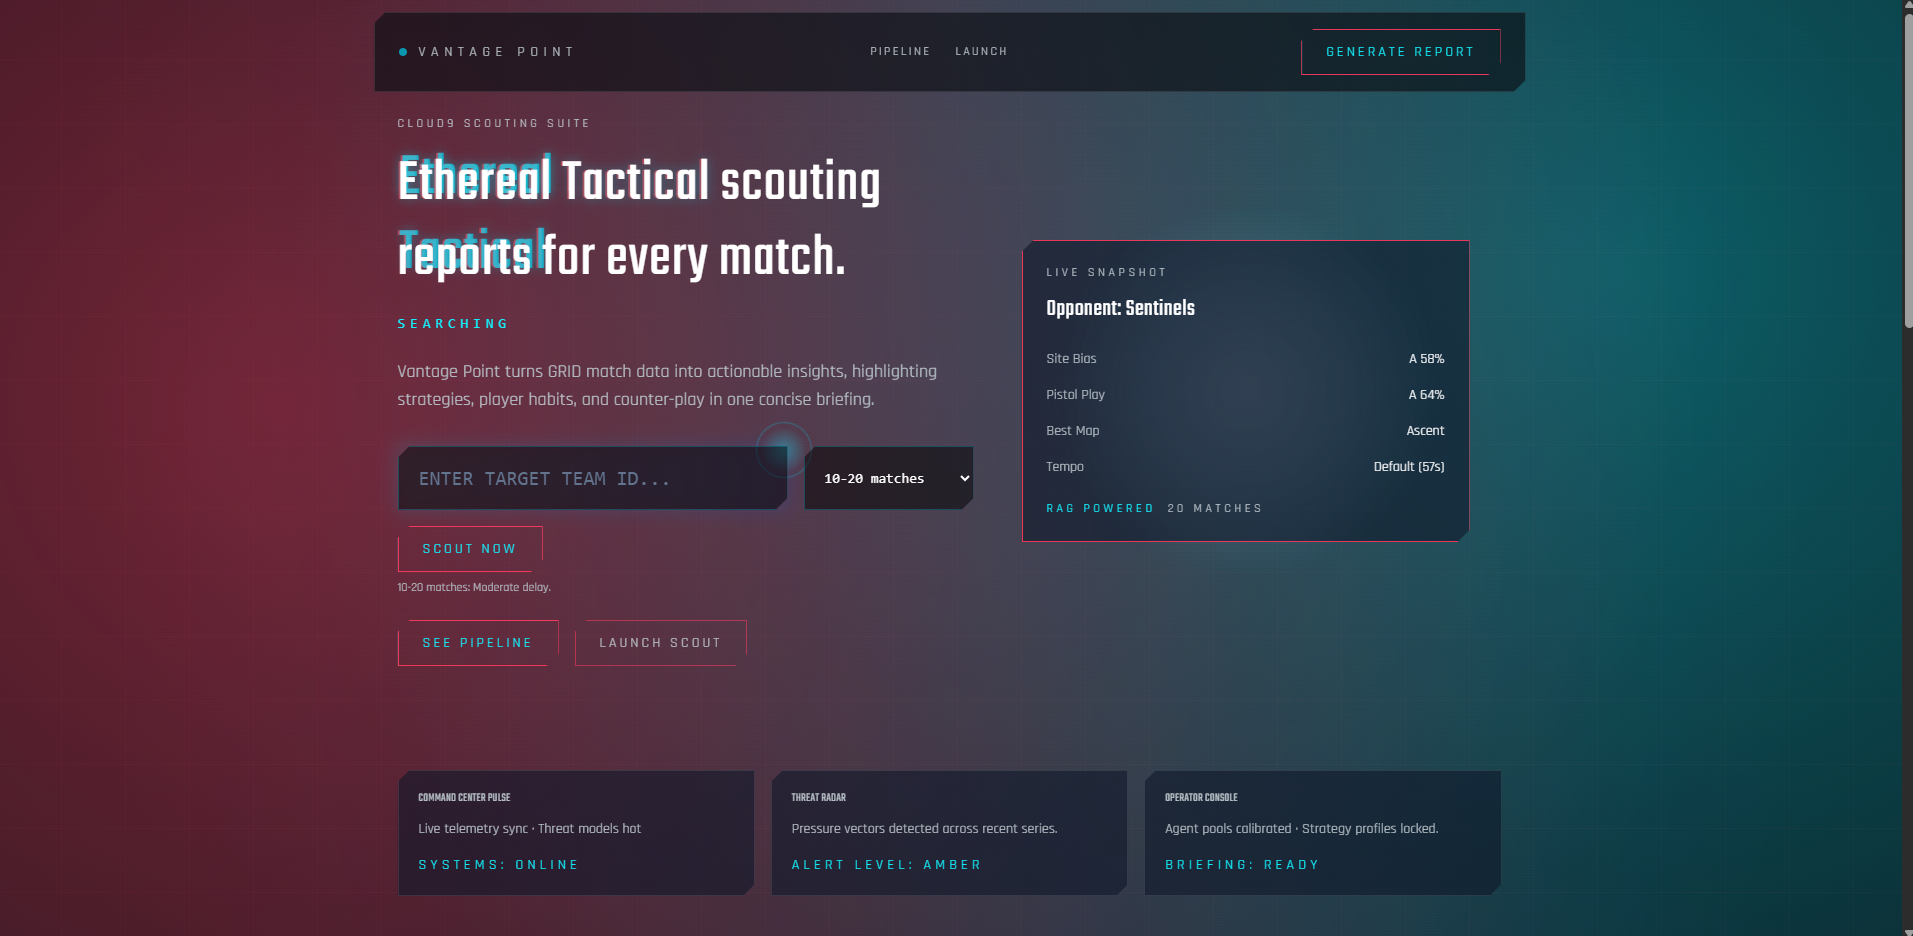
Landing_Page
-
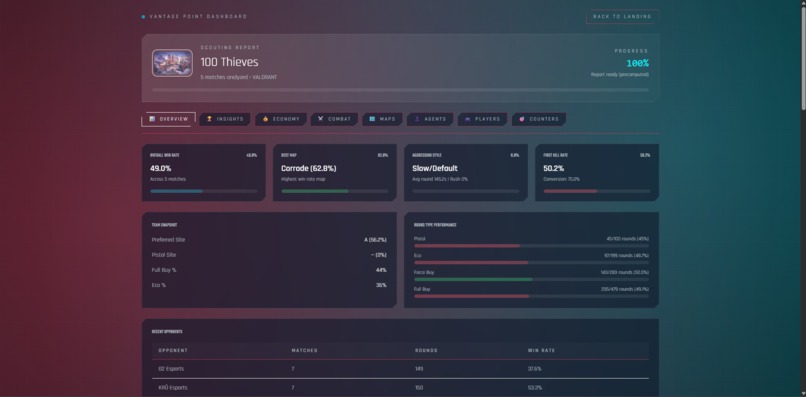
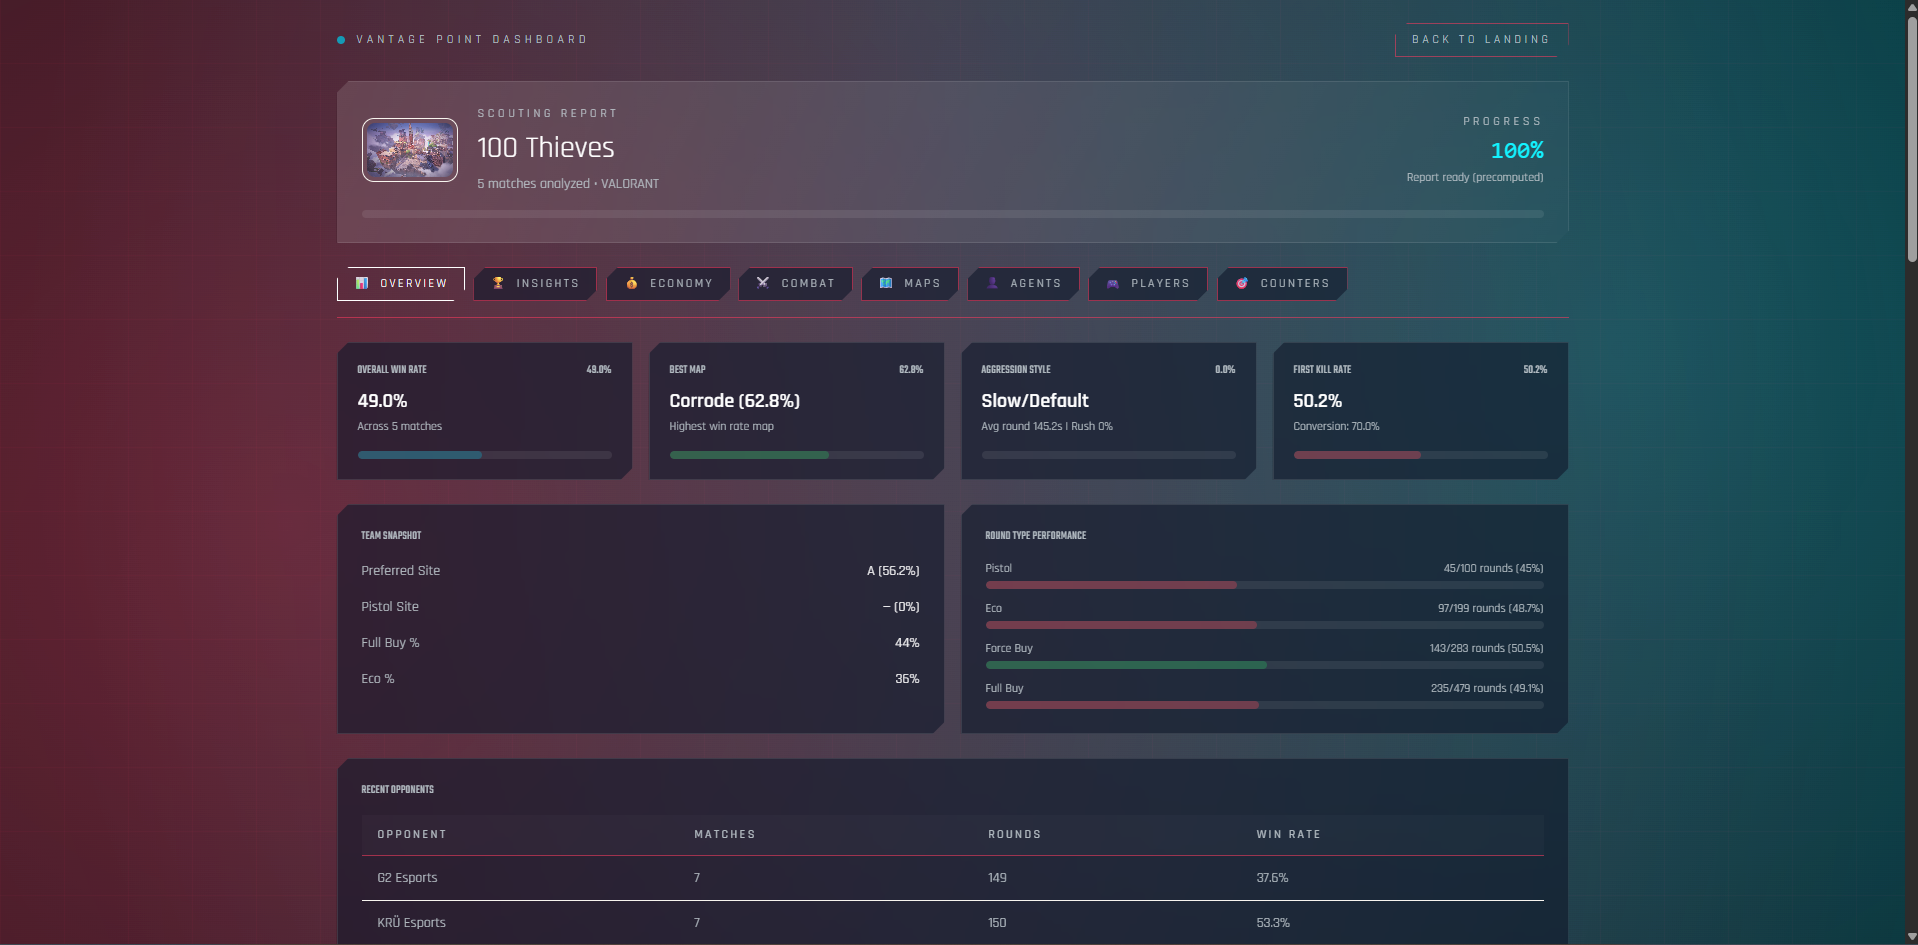
Overview_Page
-
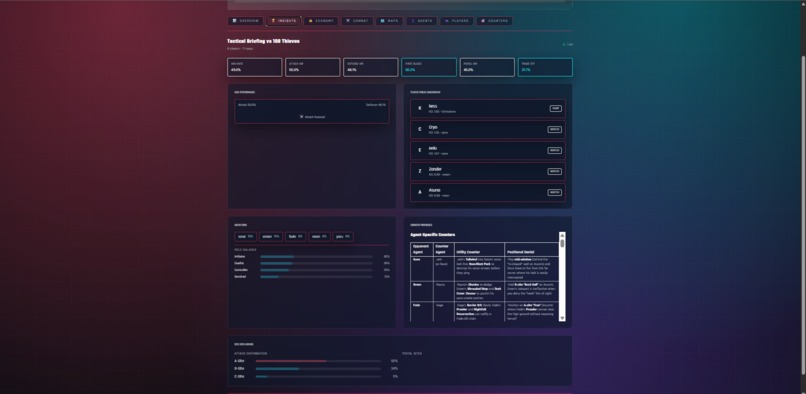
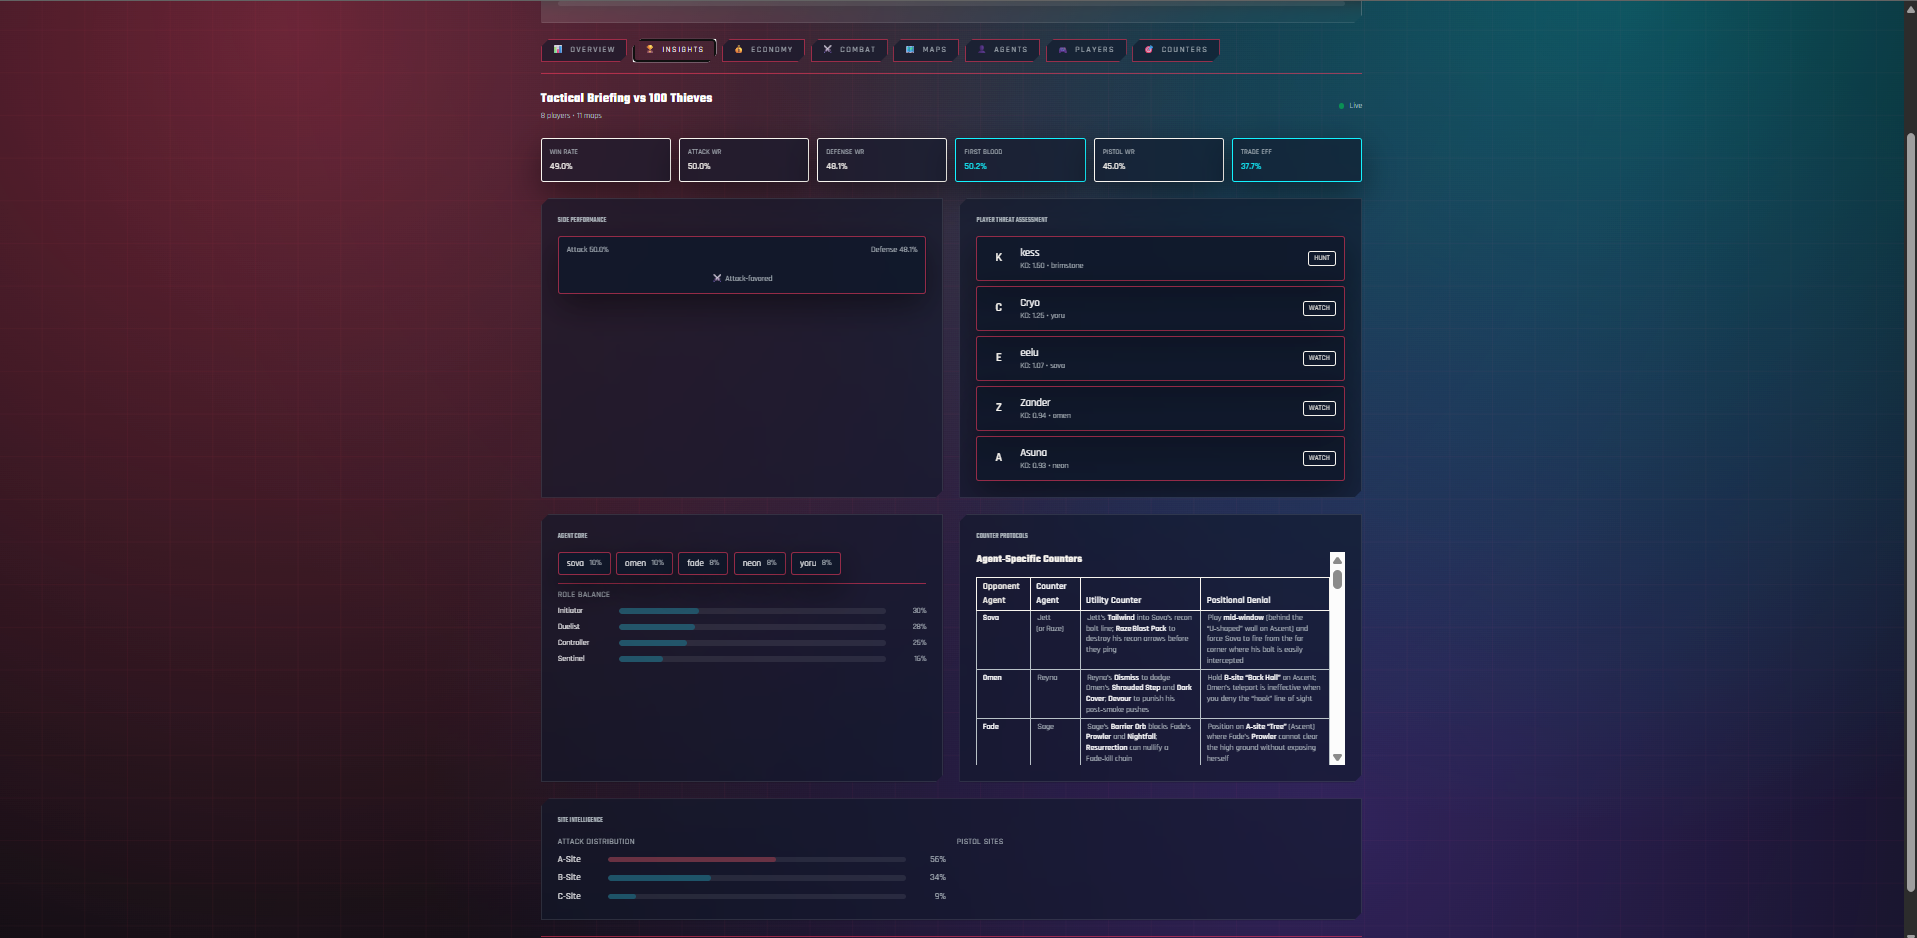
Insights_Page
-
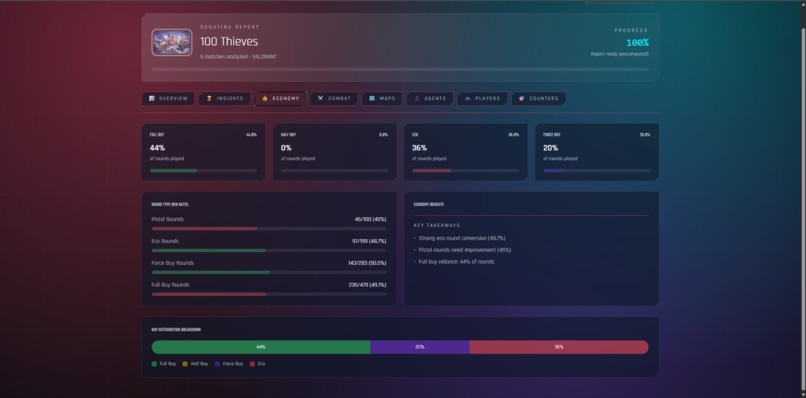
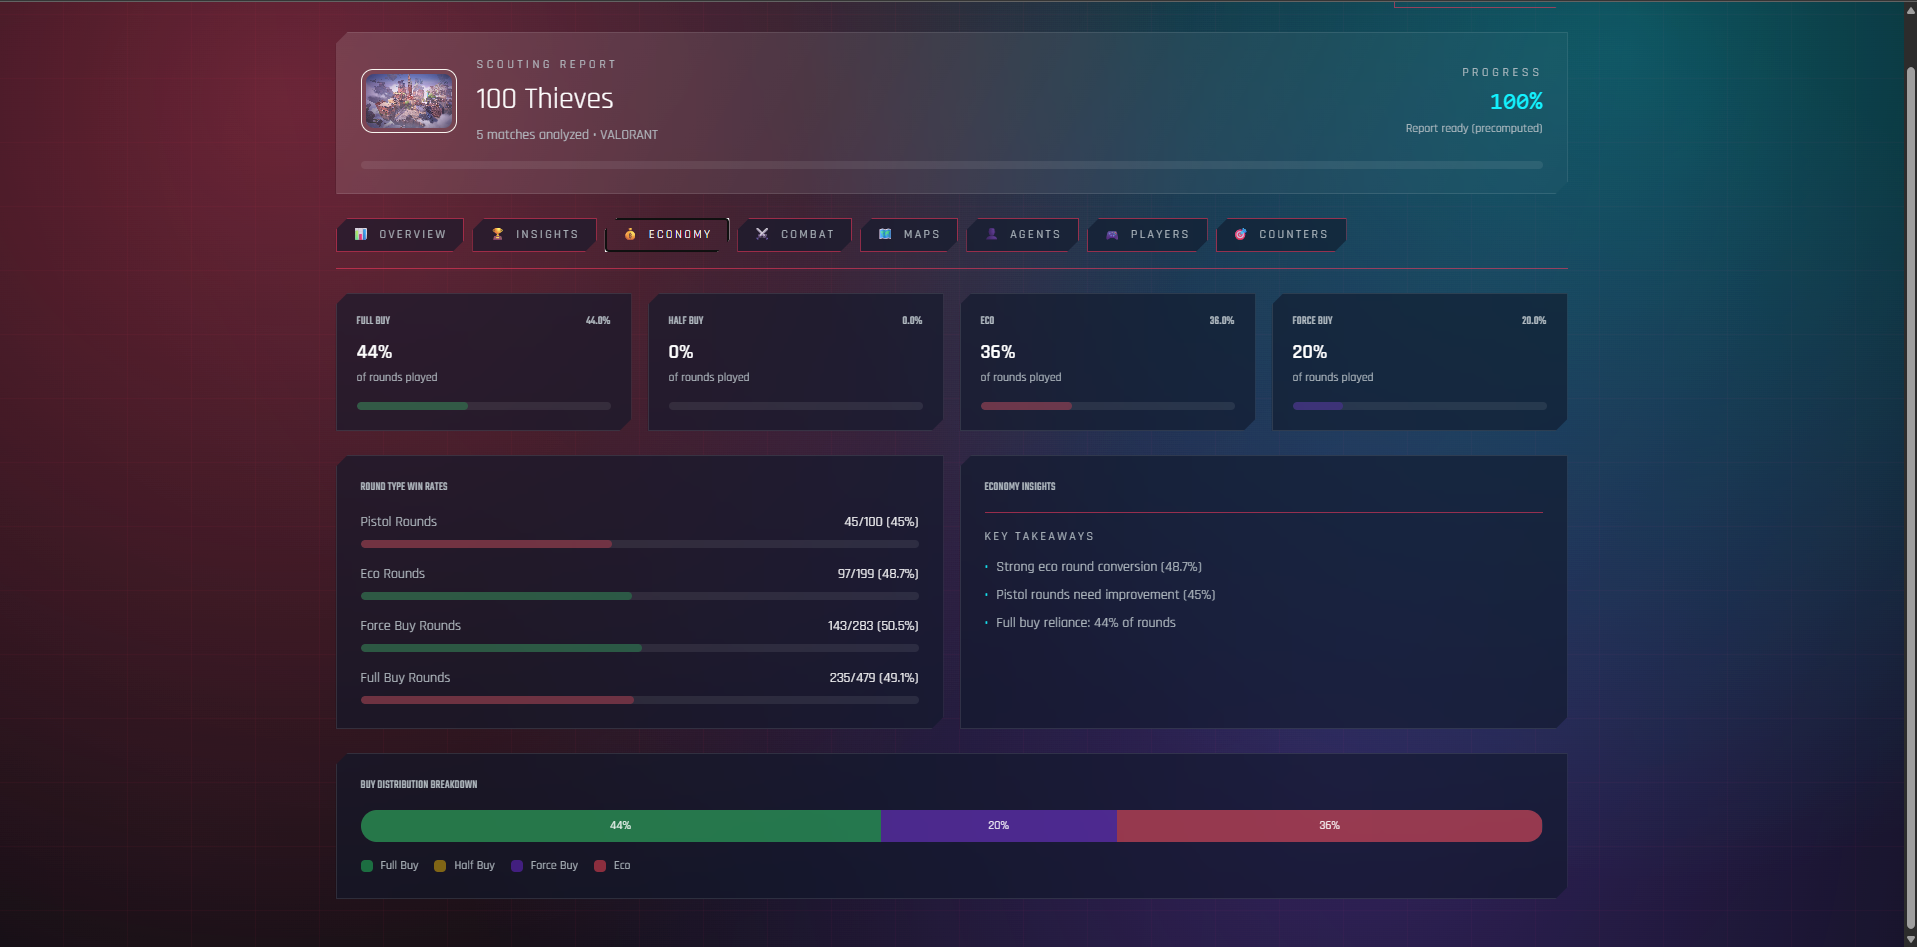
Economy_Page
-
Combat_Page
-
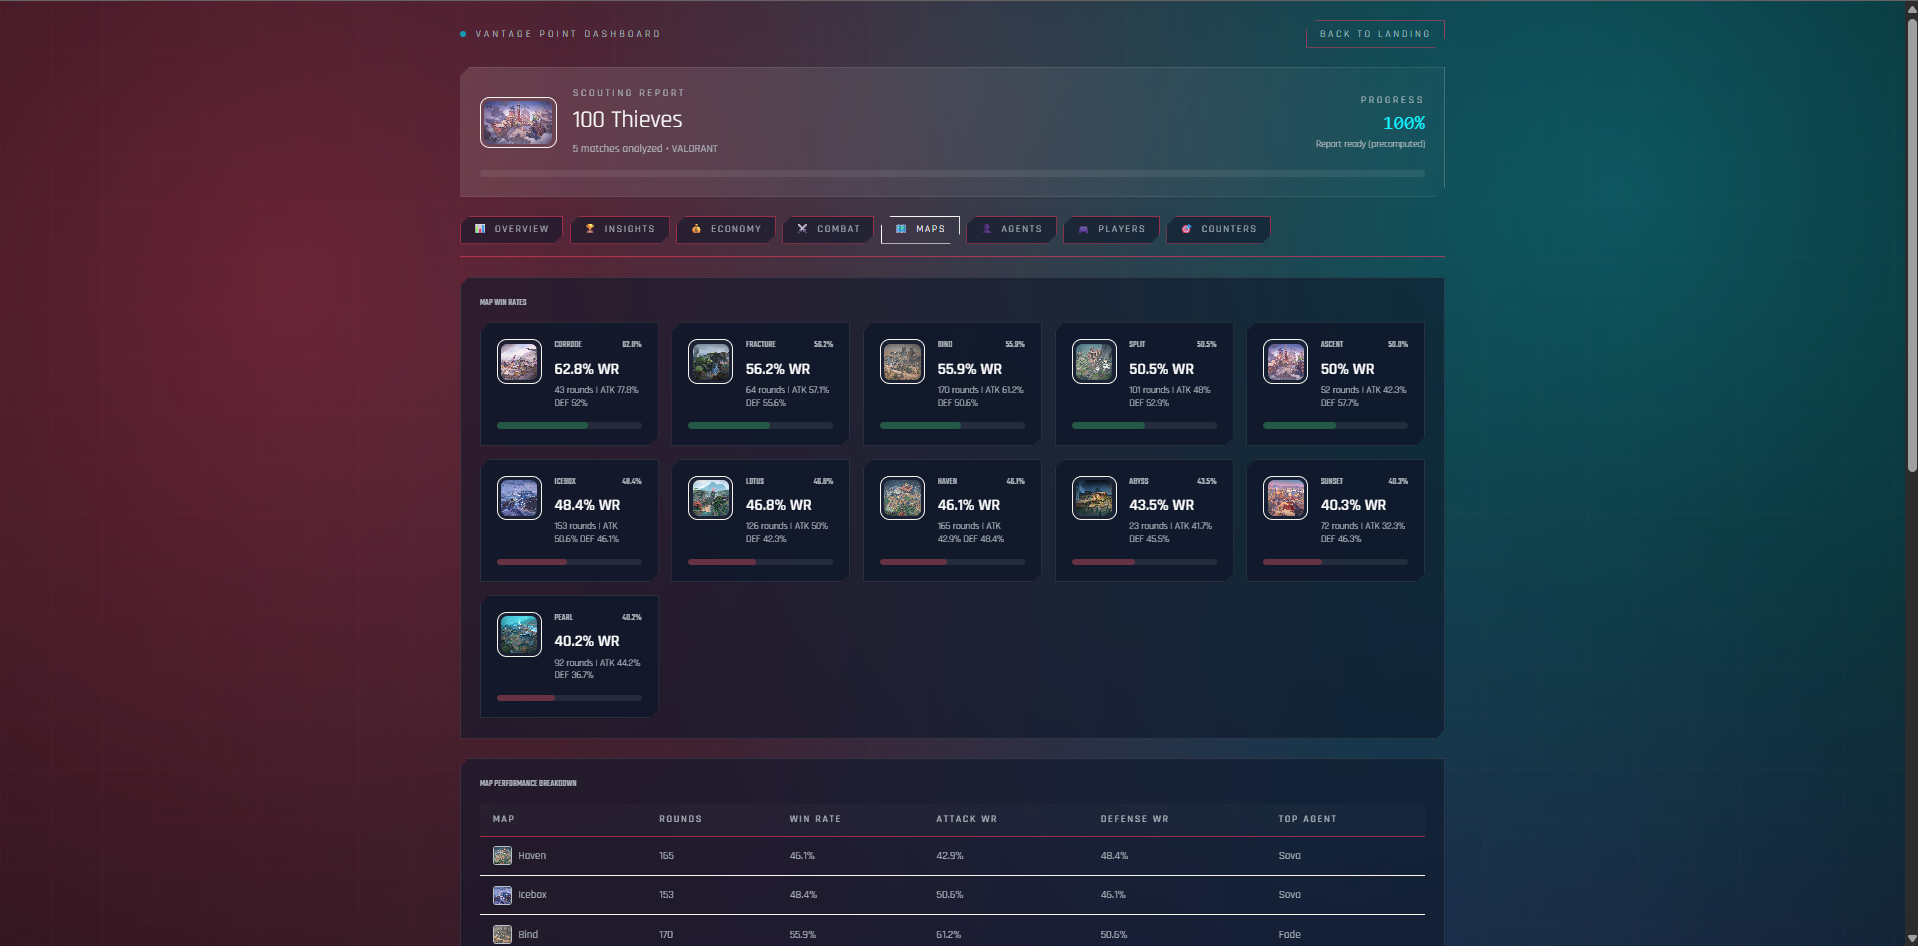
Maps_Page
-
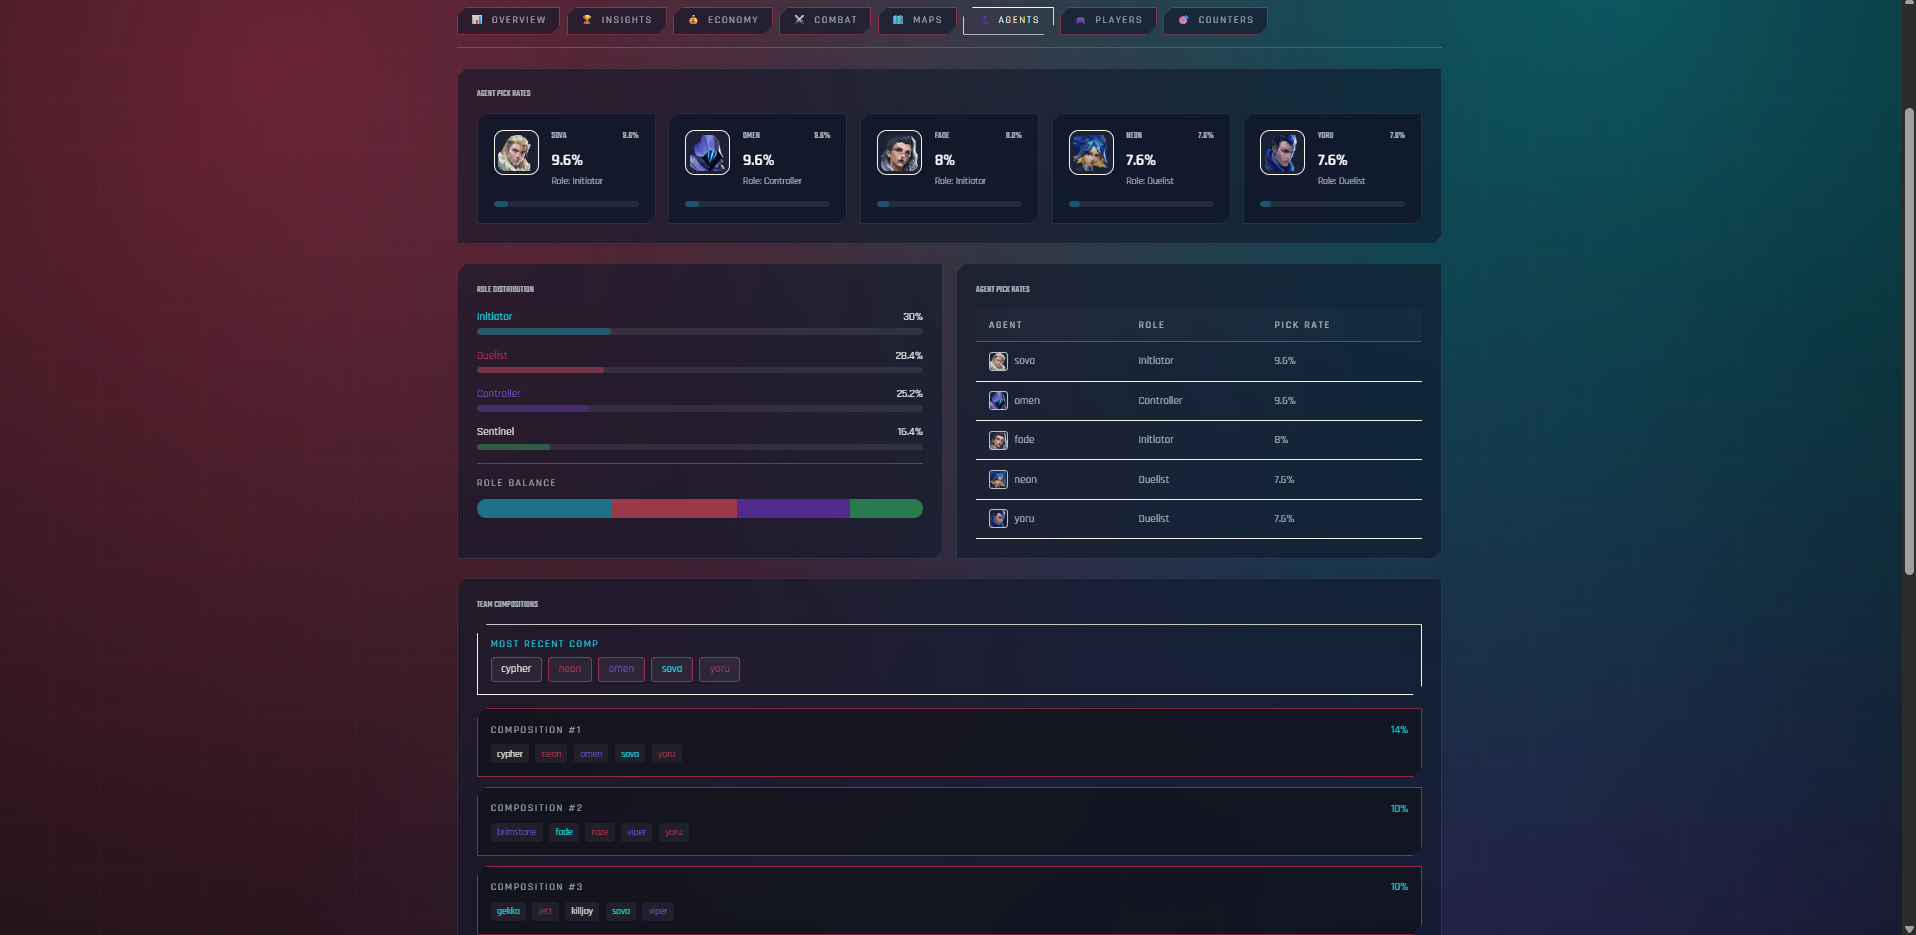
Agents_Page
-
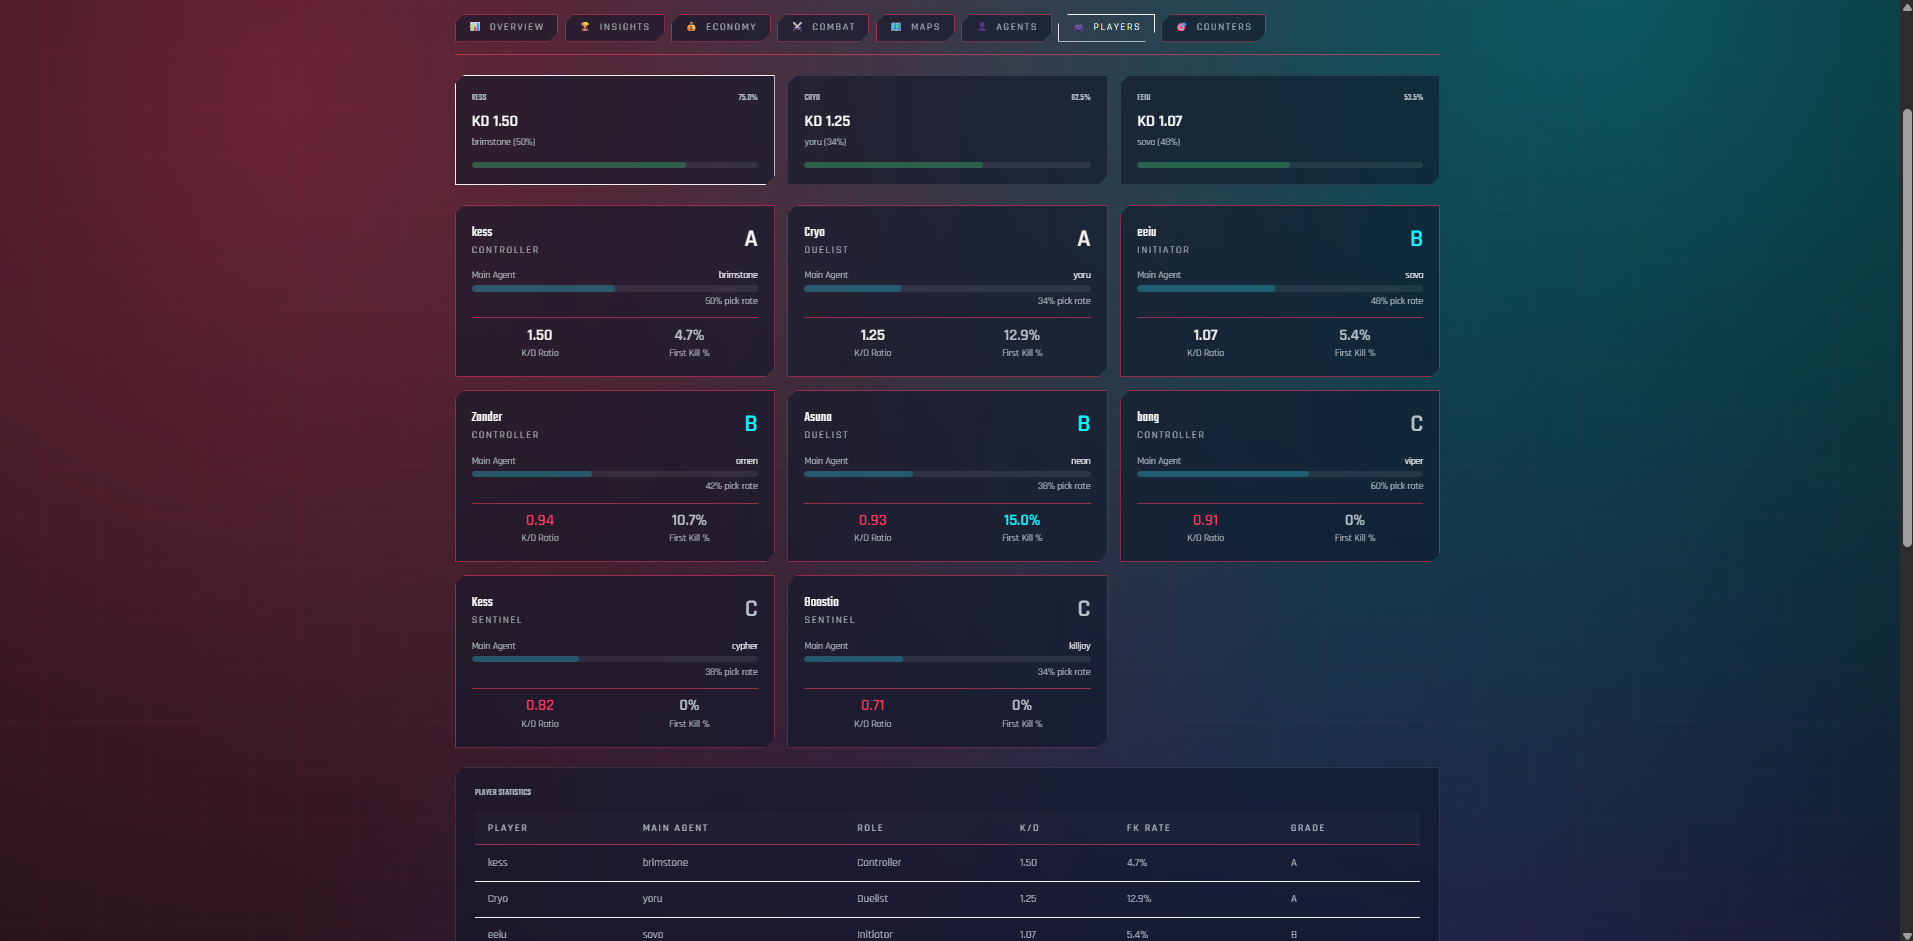
Players_Page
-
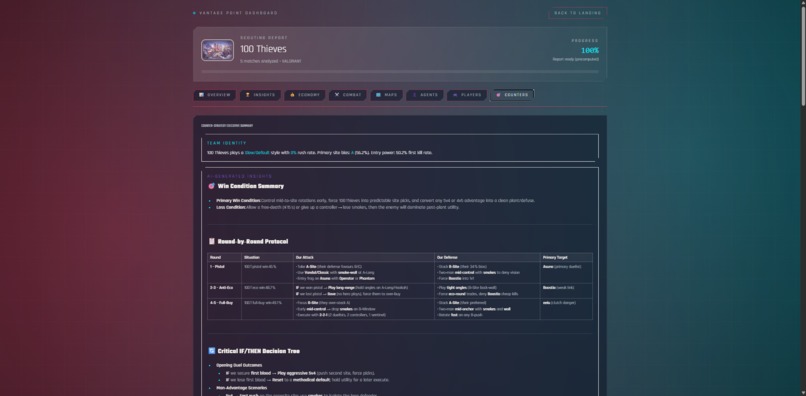
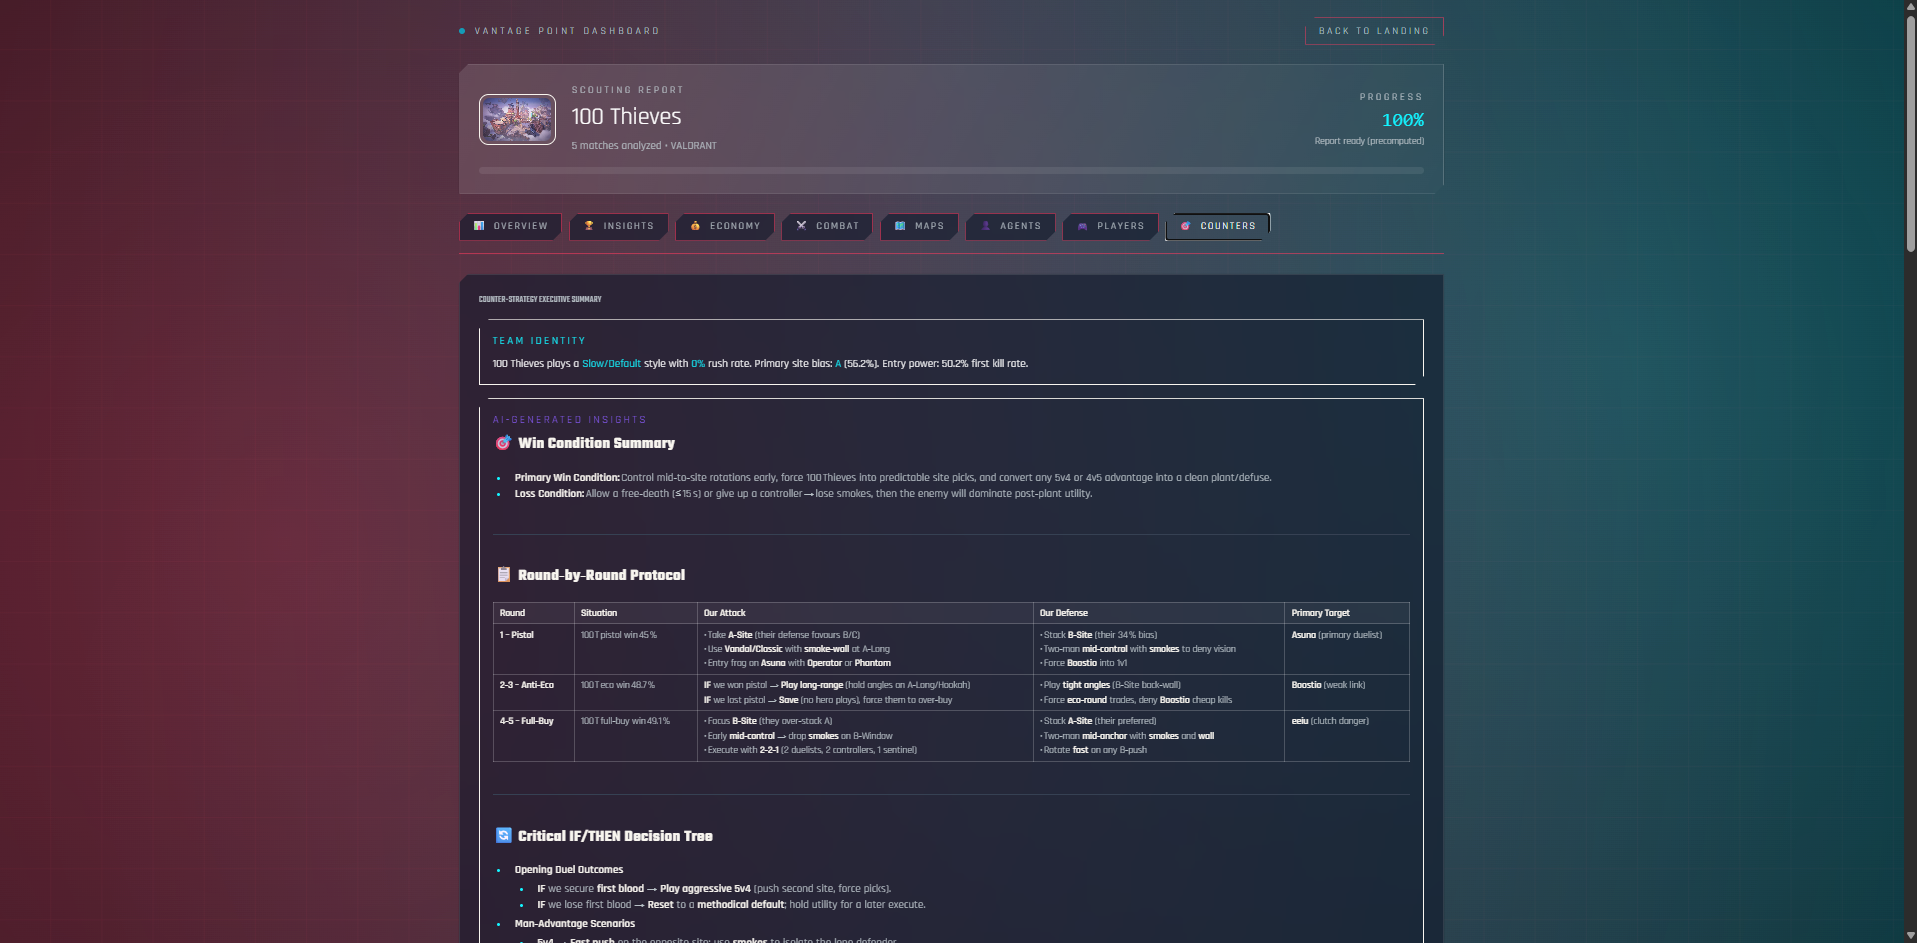
Counters_Page

💡 Inspiration
The challenge asked us to step into the shoes of a Cloud9 Data Analyst, tasked with preparing the team for an upcoming match against a new opponent. We realized that in the high-stakes world of VALORANT, a coach doesn't need more raw spreadsheets; they need a story.
We asked ourselves: Can we build an engine that doesn't just read the data, but "watches" the match? Inspired by the "Moneyball" philosophy, we wanted to move beyond basic K/D ratios. We aimed to build a tool that could automatically identify macro-level strategies, pinpoint player tendencies, and generate the "holy grail" of scouting: data-backed "How to Win" insights.
🤖 What it does
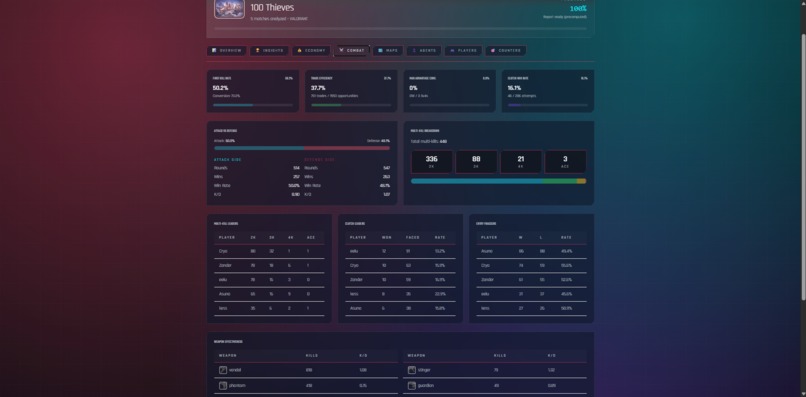
Vantage Point is a fully automated, pre-game scouting engine powered by GRID Historical Match Data. It digests recent match history to generate a concise, actionable report that answers the four core requirements of the challenge:
- Identifies Common Strategies: Our algorithms analyze round duration and event timestamps to classify the opponent's "Pace of Play." We can tell if a team prefers aggressive fast-hits (Rush A) or slow default map control, and we analyze their Pistol Round protocols to predict their opening moves.
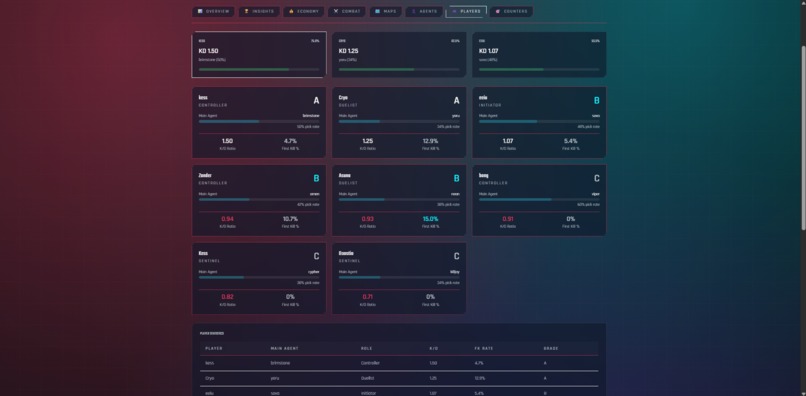
- Highlights Player Tendencies: The system identifies statistical outliers, such as a Duelist's First Blood Win Rate or a Sentinel's tendency to die first on defense. We track Trade Efficiency to reveal if a player fights with their team or gets picked off in isolation.
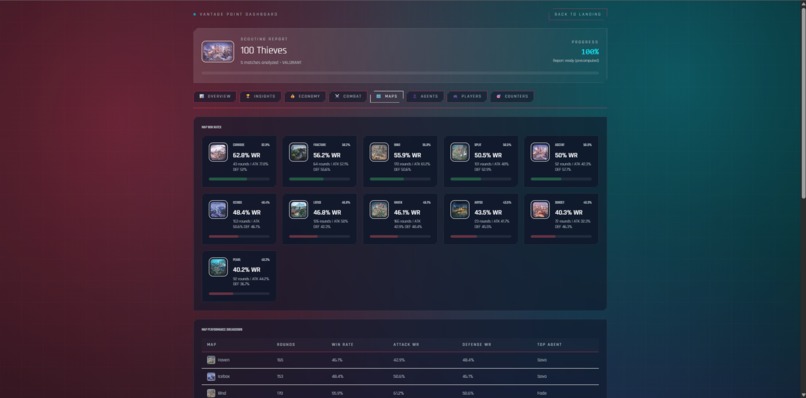
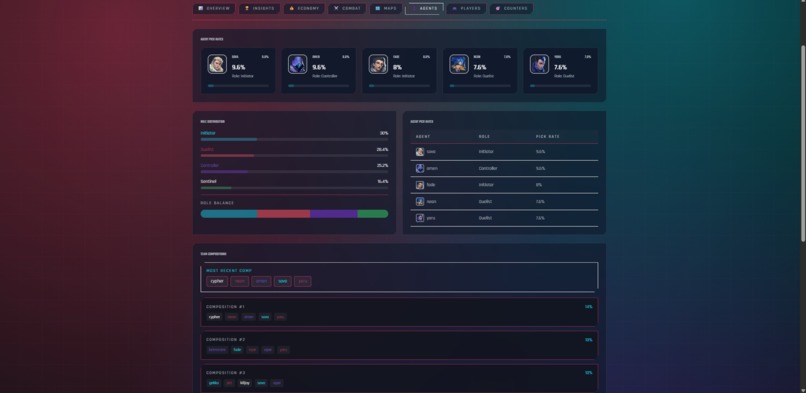
- Summarizes Compositions: We aggregate recent matches to visualize the opponent's Agent Pool and Role Distribution per map, identifying their preferred meta (e.g., "Double Controller" vs. "Double Duelist").
- Generates "How to Win" Insights (Next Level): This is our "Assistant Coach" layer. Instead of just listing stats, Vantage Point combines the quantitative data with a RAG (Retrieval-Augmented Generation) system to suggest counter-strategies.
- Example Output: "Opponent has a 15% win rate against aggressive Operator play. Recommendation: Prioritize early flashes and Jett updrafts to force them off angles."
⚙️ How we built it
We architected a hybrid pipeline that merges Quantitative Analytics with Qualitative AI.
1. The Data Foundation (GRID & JetBrains) Using JetBrains PyCharm and the Junie AI Agent, we built a robust GraphQL client to ingest official GRID esports data. We utilized JetBrains' powerful debugging tools to navigate the deep schema, fetching granular event data—kill locations, plant times, and economy states—and normalizing them into Pandas DataFrames.
2. The Quantitative Engine (Math & Logic) We developed custom algorithms to quantify "game sense" using plain-English logic:
- Trade Efficiency: We calculate spacing by measuring the percentage of deaths that occur within a 3-second window of a teammate's death. This metric reveals whether a player is trading effectively for their team or getting picked off in isolation.
- Pistol Momentum: We model the "snowball" effect by calculating the ratio of Round 3 "bonus round" wins to initial pistol round wins. This tells us how likely an opponent is to dominate the economy after a strong pistol start.
3. The "Assistant Coach" (RAG & Groq) To generate the "digestible reporting format" requested by the prompt, we built a Knowledge Base of VALORANT strategies (economy guides, map counters) stored in a FAISS Vector Store. When the analytics engine detects a pattern (e.g., "Weak Anti-Eco"), the system retrieves relevant tactical advice and feeds it into Llama-3-70b (via Groq) to write the final "Tactical Briefing" in natural language.
4. The Command Center (Frontend) Built with Next.js 14, Tailwind CSS, and Recharts, the dashboard provides the "digestible format" a coach needs. We utilized a sci-fi/HUD aesthetic to match the competitive gaming vibe.
🚧 Challenges we faced
- Mapping "Macro" to Math: The prompt asks for "macro-level patterns." Translating a concept like "Defaulting" into code was difficult. We solved this by creating a "Time-to-Plant" histogram, bucketing rounds into "Rush" (<30s) vs. "Default" (>45s).
- Data Granularity: The GRID data model is incredibly deep. Navigating the schema from Tournament -> Match -> Game -> Segment took significant iteration, which JetBrains' debugging tools helped streamline.
- Context Limits: We couldn't feed 50 matches of data into the LLM. We had to aggregate the "Signals" first (e.g., Strategy: Aggressive), passing only the high-level insights to the AI to generate the text report.
🏅 Accomplishments that we're proud of
- The "Next Level" Insight Generation: We successfully implemented the prompt's stretch goal. The system doesn't just show a chart; it tells you how to beat the chart.
- Automated Scouting: We achieved the core goal of automating the "pre-game analysis." A process that used to take an analyst hours of VOD review now happens in seconds.
- Trade Efficiency Metric: We created a novel metric that quantifies "teamwork," something rarely seen even in pro-level broadcasts.
🧠 What we learned
We learned that context is king. A high K/D ratio means nothing if those kills were "exit frags" in a lost round. By filtering our data for "Impact Kills" (First Bloods, Clutches), we aligned our tool much closer to how a professional Cloud9 coach actually thinks.
Built With
- faiss
- fastapi
- framer
- groq
- langchain
- nextjs
- pandas
- python
- react
- tailwindcss
- typescript

Log in or sign up for Devpost to join the conversation.