Inspiration
A big payout can make a bet look appealing, but it doesn’t tell you whether the price is good. For young adults and casual bettors, that difference is easy to miss.
We built Vantage to make the math behind that decision understandable. Our inspiration came from expected value, a concept used in insurance, investing, and business decisions.
Imagine a fair coin flip where you win $12 if you’re right and lose $10 if you’re wrong:
$$ EV = 0.5(12) - 0.5(10) = \$1 $$
You can lose any individual flip, but the deal earns an expected $1 per flip over many repetitions. That’s positive expected value, or +EV.
We wanted to help people recognize that kind of potential advantage in sports prediction markets and understand how much of their budget they’re putting at risk.
What it does
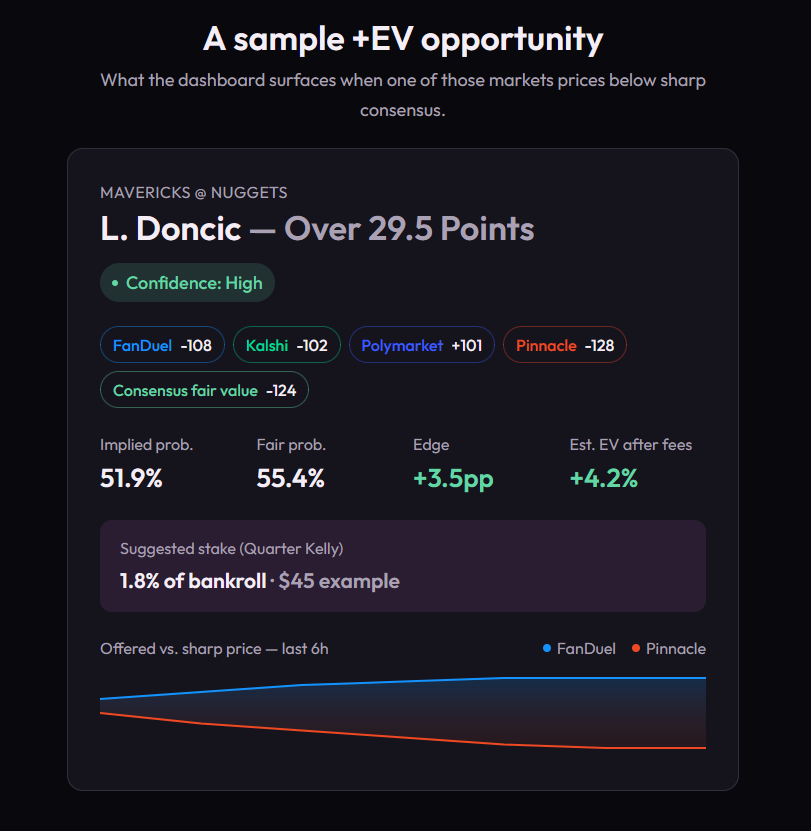
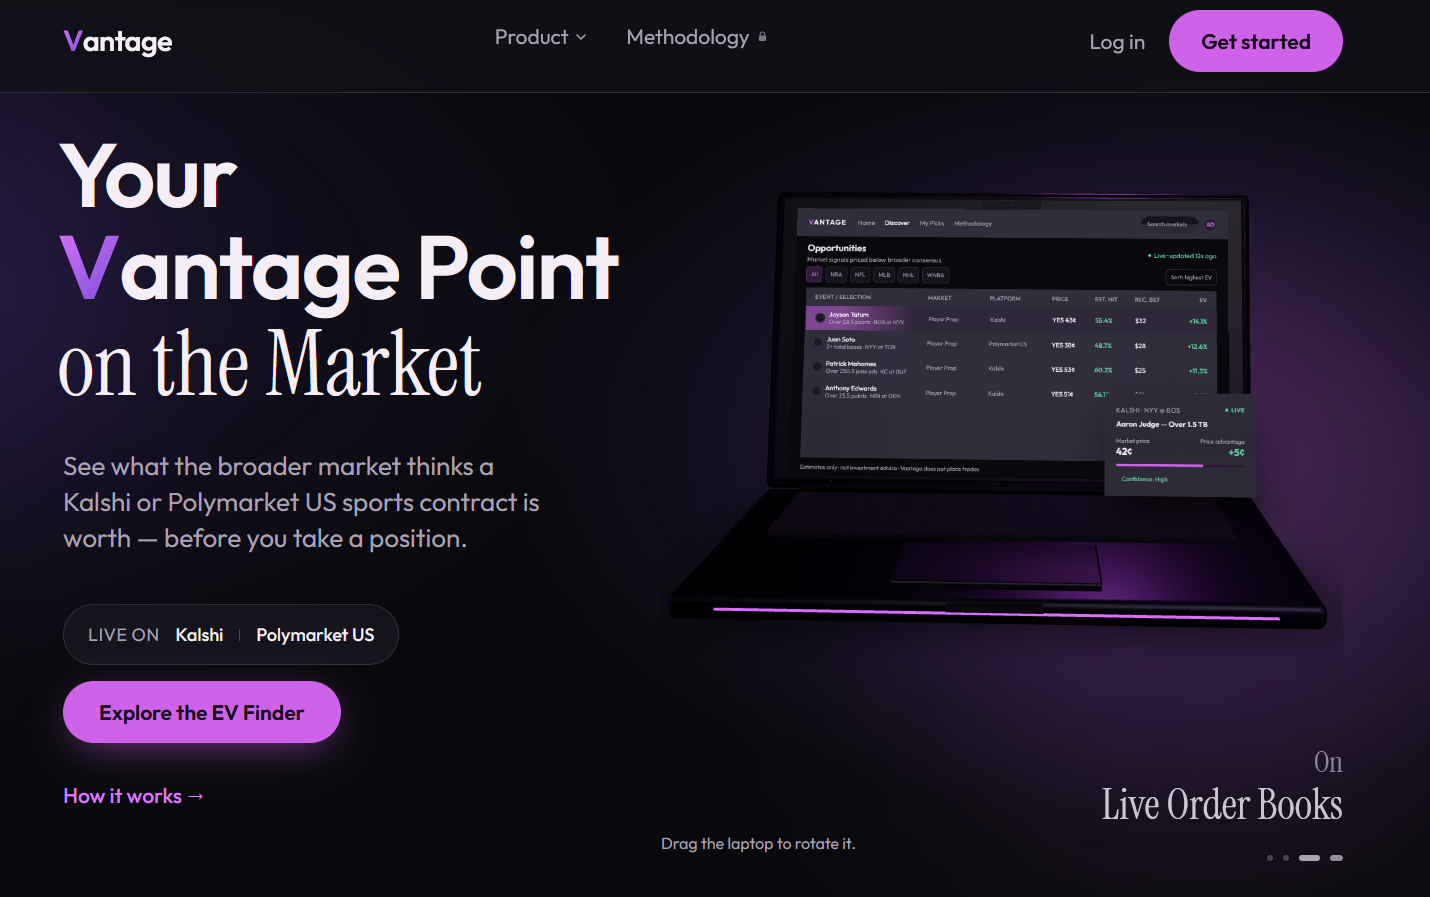
Vantage compares sports contracts on Kalshi and Polymarket with prices from multiple sportsbooks. It uses those comparisons to estimate an outcome’s chance of winning, then checks whether the available payout looks favorable.
Users can:
- Browse potential +EV opportunities and compare prices across sources.
- See estimated win probabilities alongside the odds.
- Receive suggested bet amounts based on their bankroll.
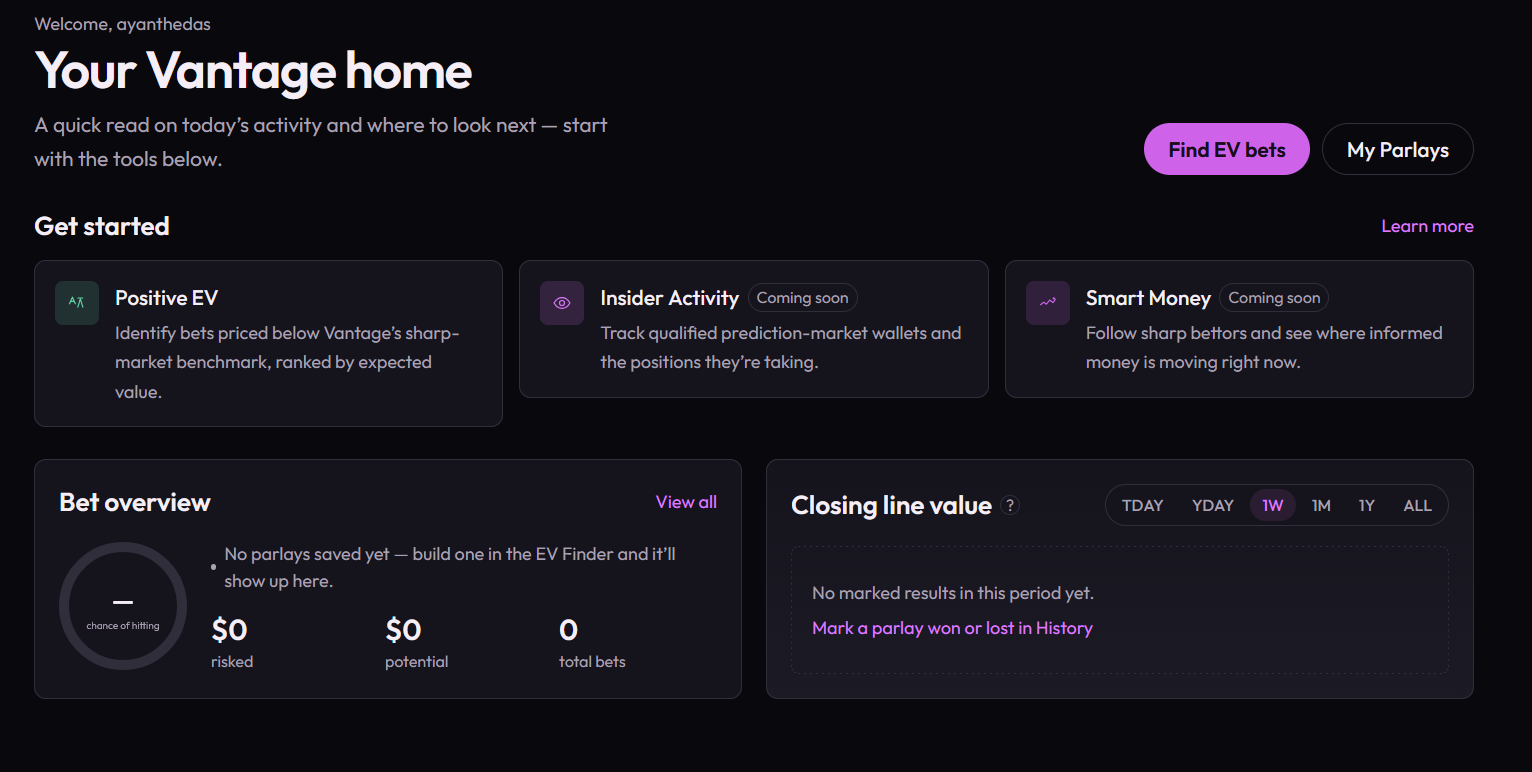
- Explore selections in a parlay builder and adjust their stake.
- Save selections and record results to understand their performance over time.
Our goal is to turn scattered prices into useful financial information. A favorable estimate doesn’t guarantee a win, but it gives users more context than a payout alone.
How we built it
We built the backend with Django and Django REST Framework, with a React frontend.
Our data comes from three sources:
- PropLine: Kalshi market prices.
- Polymarket’s Gateway API: Polymarket market prices.
- ParlayAPI: Sportsbook odds for comparison.
The backend matches equivalent events, selections, and lines across providers. It converts sportsbook odds into probabilities and adjusts for the margin built into those prices.
For an outcome with implied probability (q_i), we estimate its probability after removing that margin:
$$ p_i = \frac{q_i}{\sum_j q_j} $$
We then combine the matching sportsbook estimates using a weighted average:
$$ p = \frac{\sum_i w_i p_i}{\sum_i w_i} $$
Here, (p_i) is a sportsbook’s adjusted probability and (w_i) is its assigned weight. Reference books such as Pinnacle and FanDuel receive more weight, while unusually conflicting prices are filtered out.
We calculate expected value using:
$$ EV = pW - (1-p)S $$
Here, (p) is the estimated probability of winning, (W) is the net profit if the bet wins, and (S) is the amount at risk.
For decimal odds (d), the expected return as a percentage of the stake is:
$$ EV_{\%} = 100(pd - 1) $$
We subtract a configured cost allowance before displaying an opportunity. This is an estimate of trading costs rather than an exact platform fee calculation.
Supabase Auth and Postgres support accounts and saved user data. Persona supports identity verification during onboarding.
Suggested stakes use the user’s bankroll and a fractional Kelly calculation:
$$ f = \alpha \max\left(0,\frac{bp-(1-p)}{b}\right) $$
Here, (b=d-1) is the potential profit per dollar wagered, and (\alpha=0.25) reduces the full Kelly amount. We apply additional sizing limits before displaying the recommendation.
To keep browsing fast and reduce repeated API requests, we cache calculated opportunities. Clicking Refresh odds fetches updated data and recalculates the results.
Challenges we faced
Matching markets correctly was harder than collecting prices. Providers use different names and formats for teams, players, and markets. Even a small difference, such as Over 5.5 versus Over 6.5, makes a comparison invalid.
Large EV numbers needed investigation. Some apparent opportunities came from conflicting reference prices rather than convincing evidence of mispricing. We added checks for matching lines, outdated references, and outliers.
API availability shaped our implementation. Provider outages, coverage differences, and request limits pushed us to separate data sources and make better use of caching.
Explaining the numbers was a design challenge. Expected profit and profit if a bet wins mean different things. We worked to make that distinction clear and base dollar amounts on the user’s full stake.
What we learned
We learned that collecting more data only helps when it represents the same question. Reliable comparisons require careful matching, validation, and clear assumptions.
We also learned that a financial tool needs to explain uncertainty. A mathematically favorable bet can still lose, and a large payout can still be a poor deal. Helping users understand those differences matters as much as calculating the number.
The impact we hope to have
Vantage is designed to help young adults and casual bettors slow down, compare prices, and consider risk within a budget.
By connecting estimated probabilities, suggested stakes, and recorded results, we aim to help users understand how individual decisions affect their money over time. Our goal is to make the math accessible enough to support more informed choices, including deciding that a bet isn’t worth taking.
What's next for Vantage
Expand beyond Kalshi & Polymarket Integrate real sportsbooks (FanDuel, DraftKings, BetMGM) and DFS platforms (PrizePicks, Underdog) as tradeable venues, not just sportsbook-consensus inputs — so the EV Finder surfaces opportunities you can actually act on wherever you already bet.
AI-powered insights Layer an LLM over the existing data pipeline to explain why a line moved, summarize the sharp consensus in plain language, and flag context stats don't capture (injuries, weather, lineup news) alongside every EV Finder card.
AI-assisted market visualization Natural-language querying of the market map ("show me NBA player props with rising sharp money") and auto-generated chart annotations and parlay builder.
Built With
- api
- django
- html5
- javascript
- persona
- python
- react
- supabase
- tailwind


Log in or sign up for Devpost to join the conversation.