Inspiration
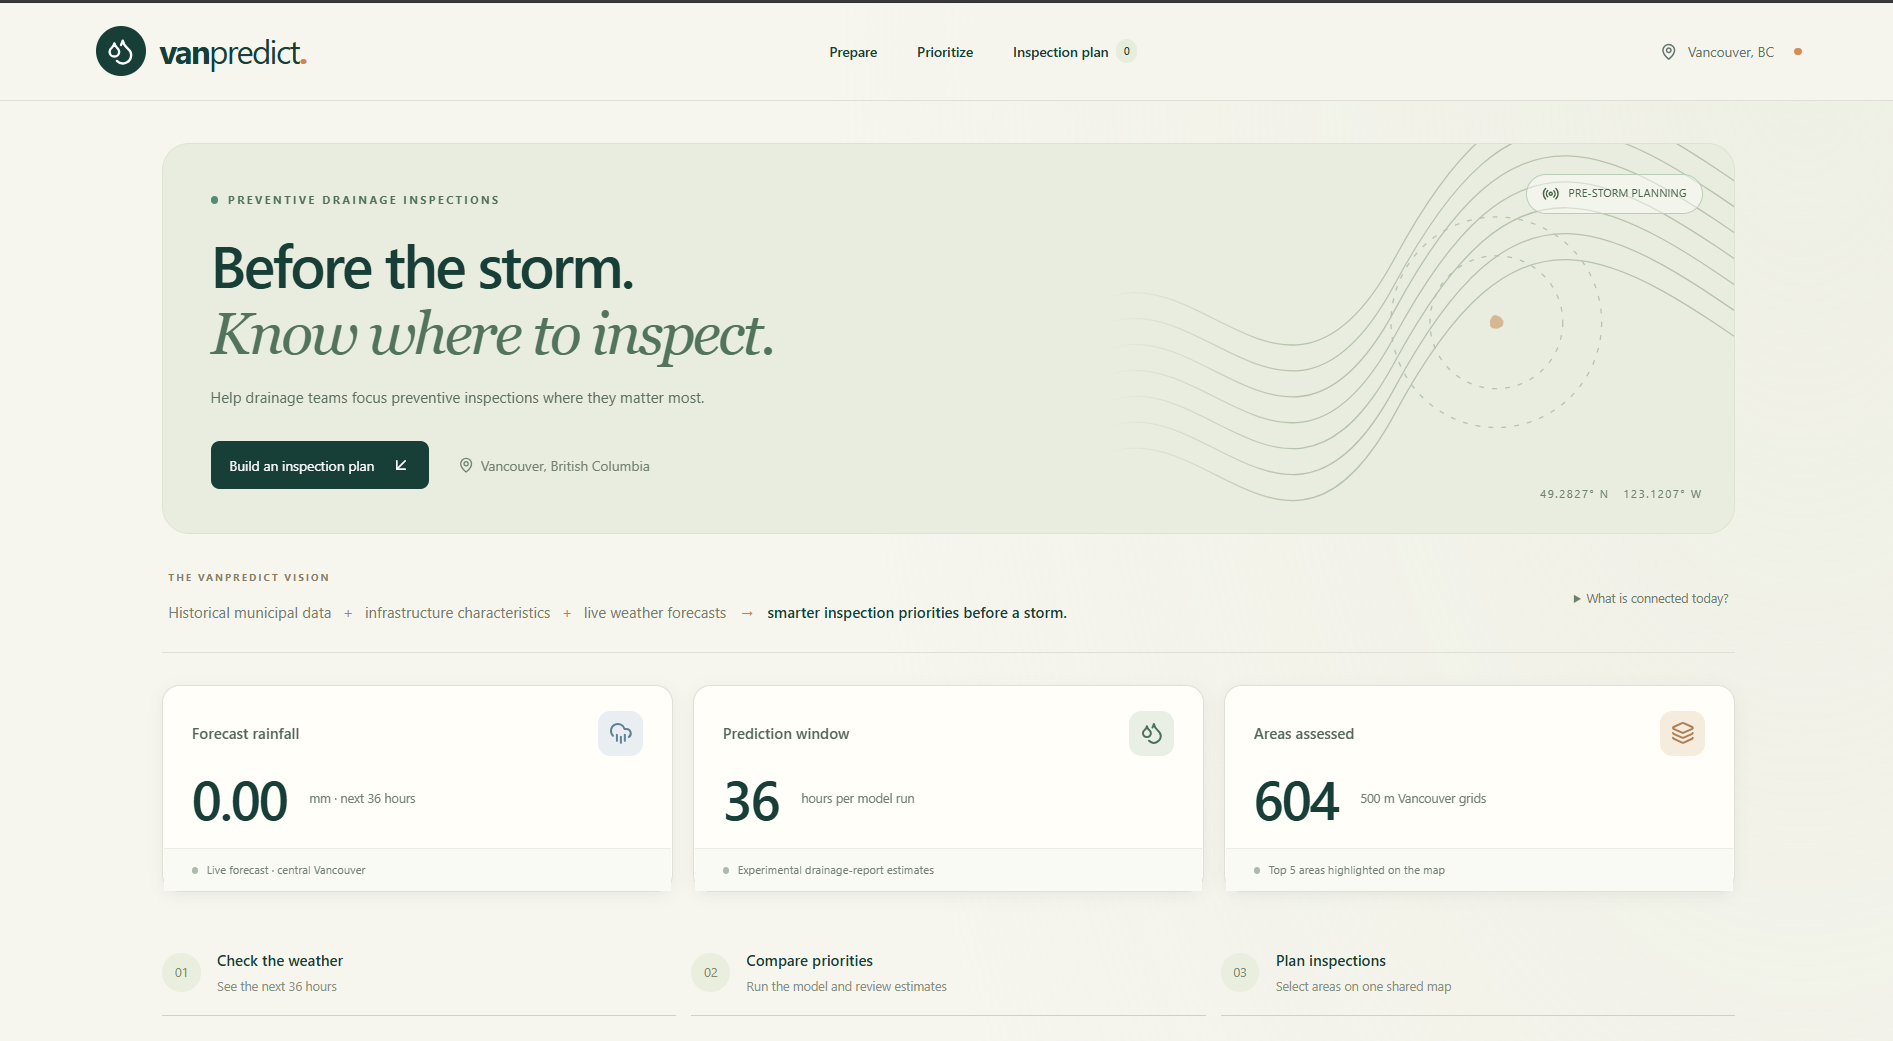
Vancouver faces frequent heavy rainfall and drainage issues. We wanted to use existing city data to predict where problems could happen before residents report them.
What it does
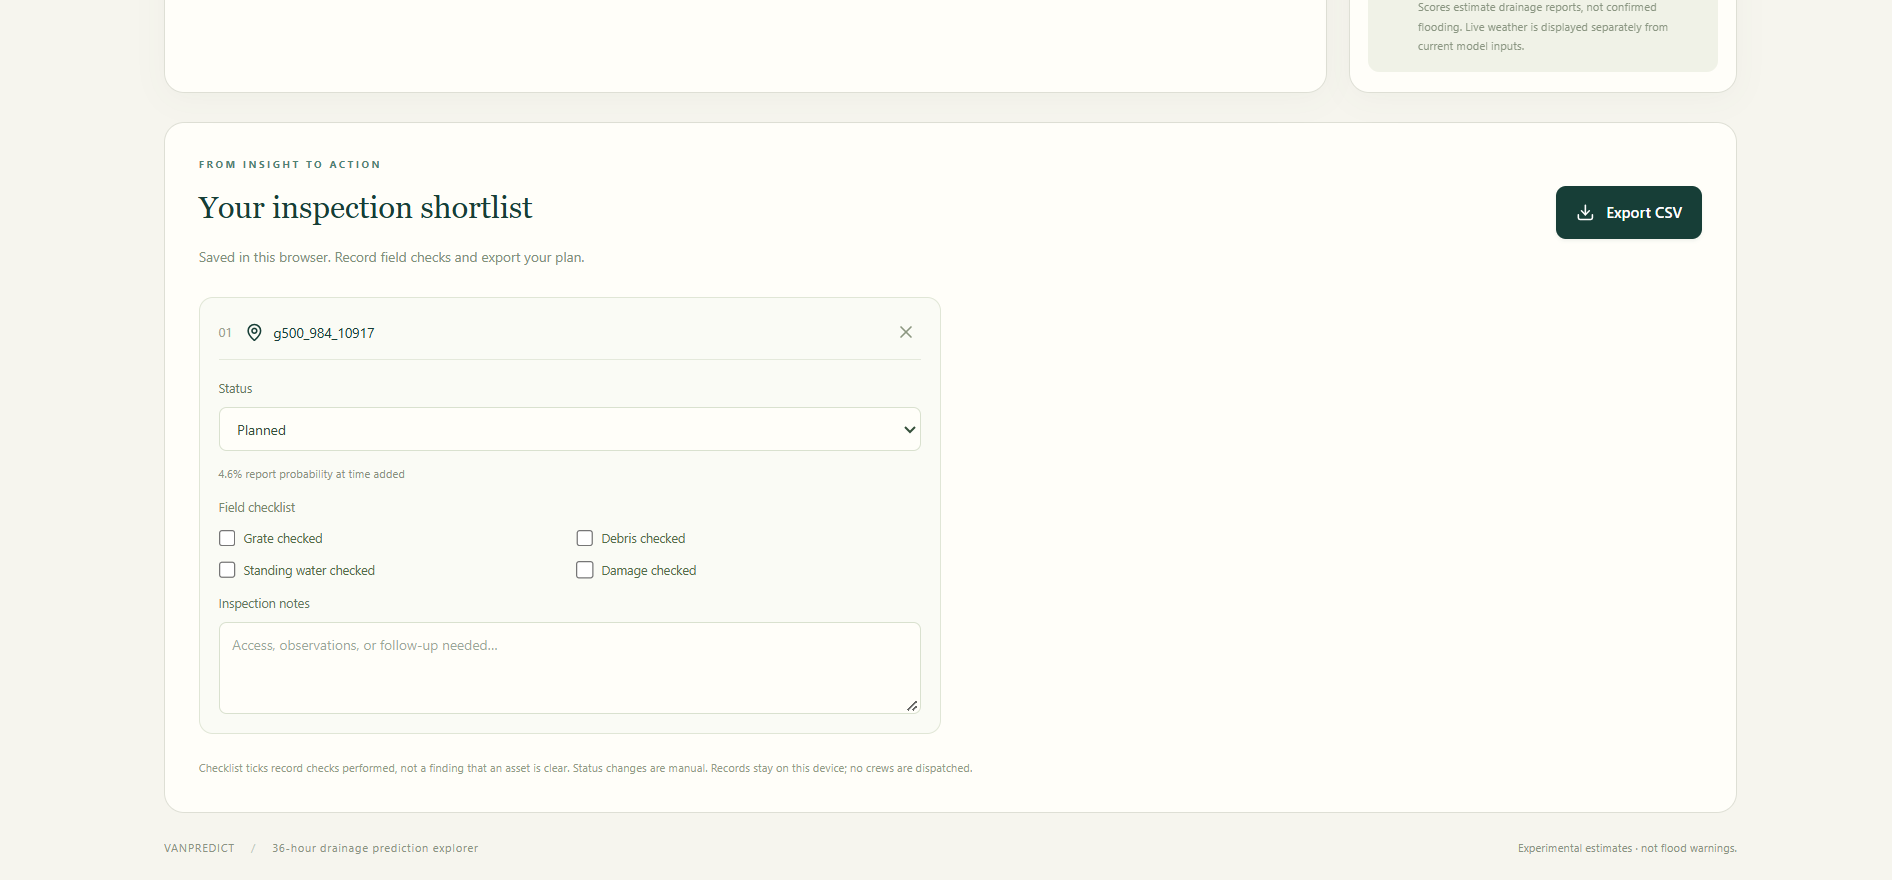
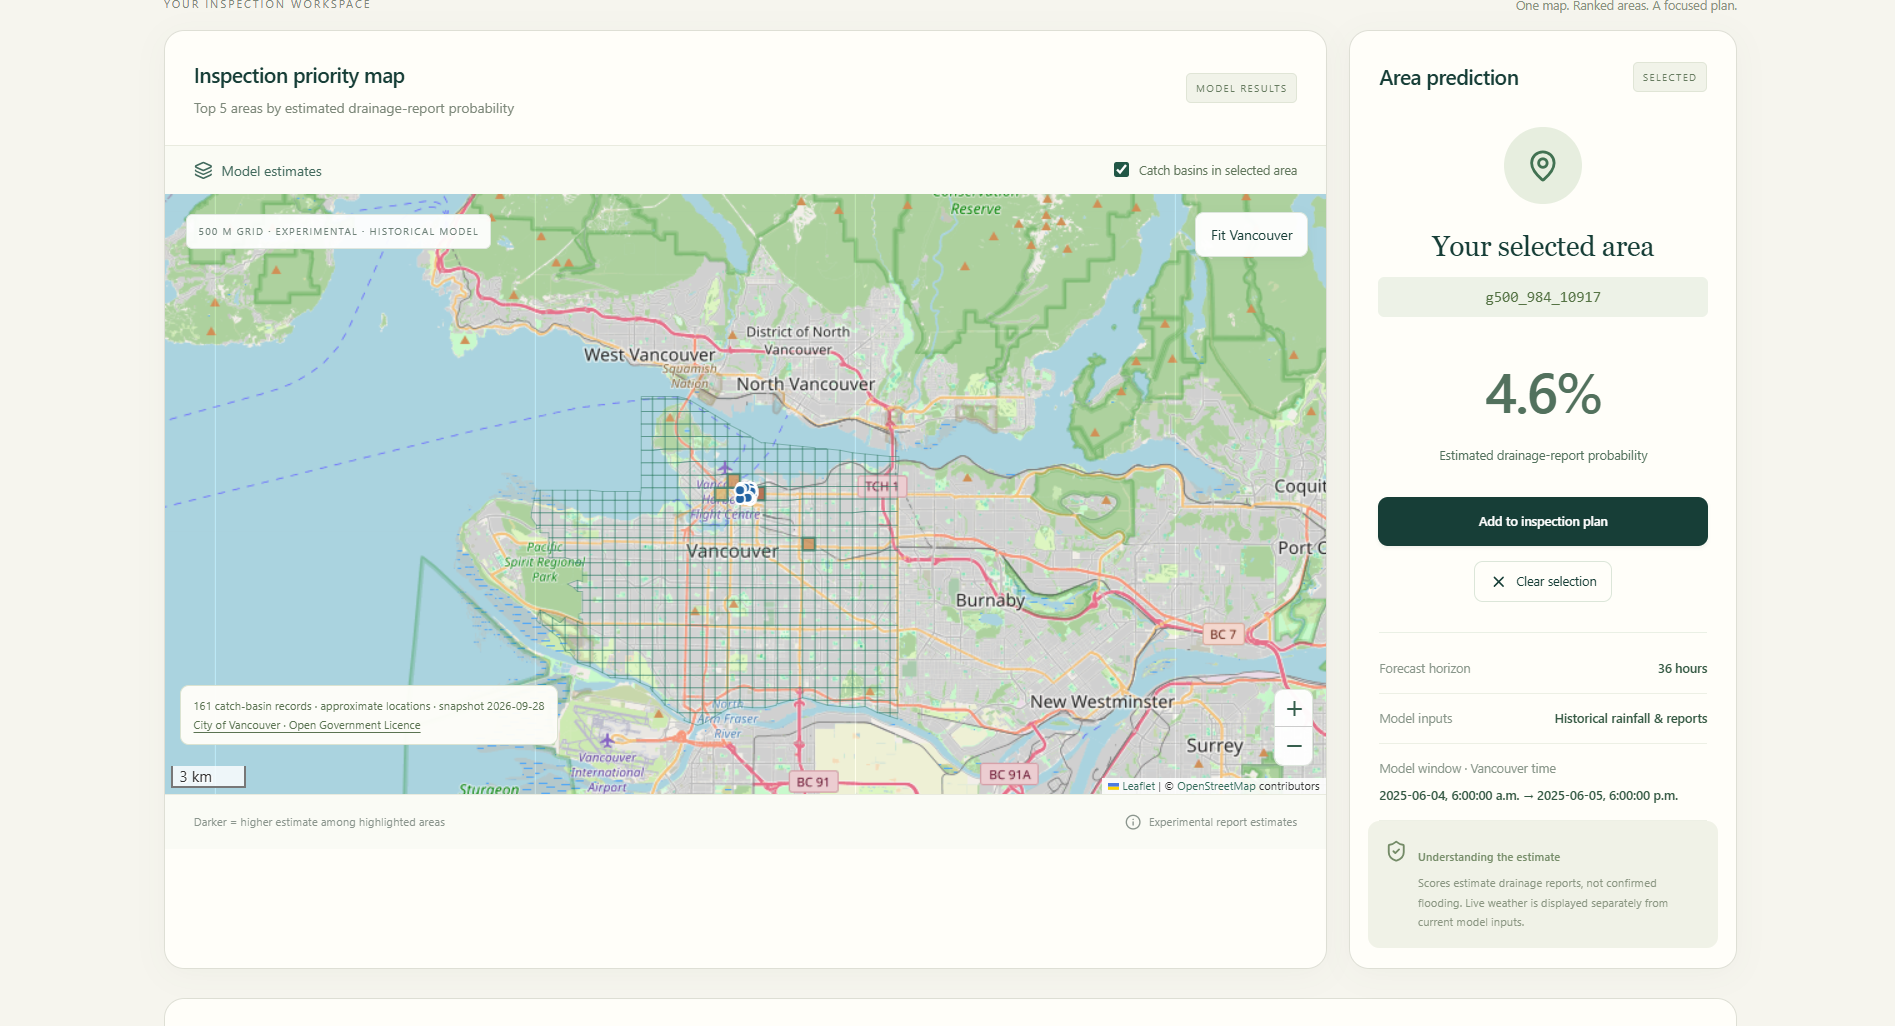
VANPREDICT predicts drainage and flooding risk across Vancouver using historical 311 complaints, rainfall, elevation, and drainage infrastructure data. It displays high-risk areas on an interactive map and can update risk using live weather data.
How we built it
We combined Vancouver 311 data, historical rainfall, LiDAR elevation data, and infrastructure locations into a common geographic grid. We engineered rainfall and terrain features, then built a Python/FastAPI backend to process and serve the data.
Challenges we ran into
The biggest challenges were missing coordinates, inconsistent timestamps, large LiDAR files, and combining datasets with different spatial formats.
Accomplishments that we’re proud of
We successfully combined multiple real-world datasets into one geospatial pipeline and built a system that can turn raw city data into location-based drainage risk.
What we learned
We learned that strong data processing and meaningful geospatial features can be just as important as the machine learning model itself.
What’s next for VANPREDICT
Next, we want to add live weather forecasts, catch basin and manhole data, stronger ML models, and automatic alerts when high-risk areas are detected.
