Inspiration
As the recent conflict in the Middle East has shown, global shipping plays a critical role in international trade, but it is also increasingly used to evade sanctions and move illegal cargo as well as commit fraud through what are known as Shadow Fleets. These vessels often disable tracking systems, change flags frequently, or transfer cargo at sea to obscure their activity.
We were inspired to build a system that helps analysts and investigators visualize these patterns more clearly. Our goal was to create a platform that turns raw maritime data into an intuitive intelligence dashboard capable of highlighting suspicious vessel behavior and uncovering potential shadow fleet networks. In doing so, we wanted to protect legitimate navigators from accidental collisions and give financial institutions a powerful tool to use in complying with anti-money laundering and Know Your Customer laws, preventing illicitly obtained funds from entering the economy.
What it does
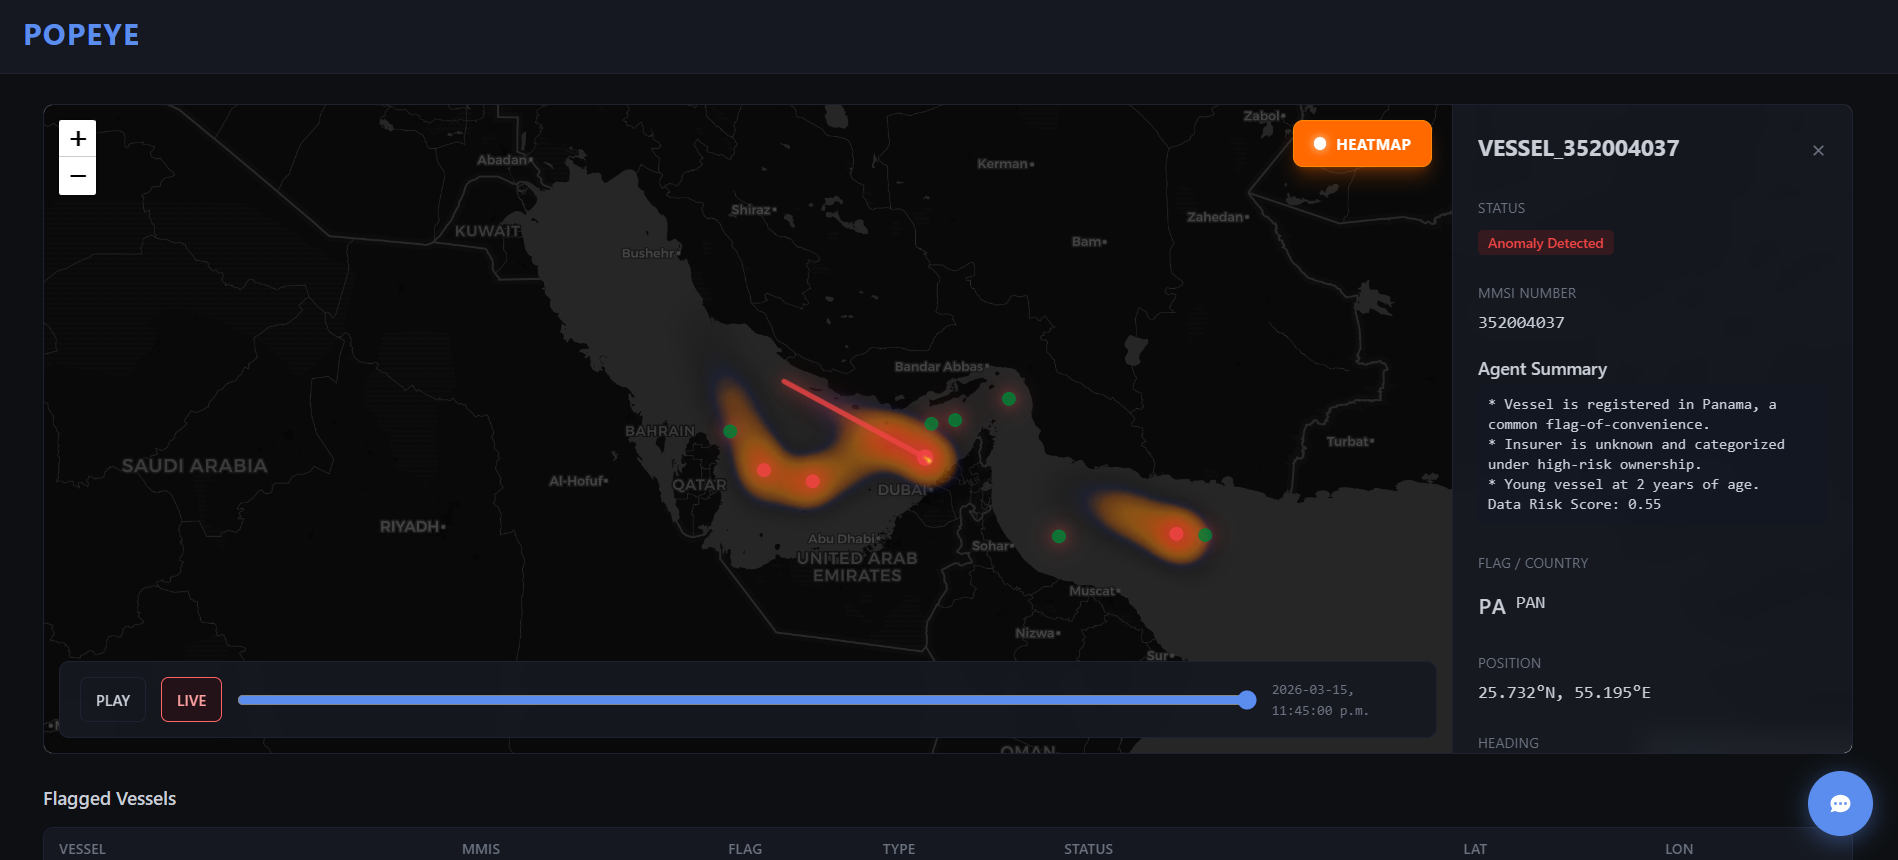
Popeye is a maritime intelligence dashboard that tracks vessels and highlights suspicious activity associated with shadow fleets.
The platform visualizes ships and routes on a global map and analyzes behavioral signals such as AIS transmission gaps, unusual route deviations, and suspicious vessel clustering. When patterns consistent with sanction evasion or illicit shipping networks appear, the system flags those vessels and groups them into potential fleet clusters, helping analysts map out the "Shadow Fleet."
How we built it
- Frontend: Interactive vessel map built with Leaflet and OpenStreetMap, supporting real-time ship tracking, route visualization, and fleet cluster exploration. TanStack Query manages data fetching and synchronization, ensuring the frontend always reflects the latest vessel positions and anomaly scores without unnecessary re-fetches
- Backend: FastAPI powers the simulation engine, data processing pipeline, and analysis endpoints, handling the heavy lifting of vessel data ingestion, anomaly score computation, and serving results to the frontend in real time. The Gemini 3.1 Flash was used to the determine the level of risk using factors like insurance, registration, and age and was used to analyze the behaviour of anomalous vessels.
- Anomaly Detection: A trajectory-based Variational Autoencoder (VAE) encodes sequences of vessel location, speed, course, and timestamp data into a compressed latent space. During inference, reconstruction error is used as a movement anomaly score, flagging vessels whose behaviour deviates from what the model has learned as normal for a given ship type
- AI Agent Layer: An agentic AI system uses Railtracks to call IBM Watson models, gathering vessel metadata, analyzing AIS gaps and routing anomalies, and generating human-readable explanations and route advice through an interactive chatbot interface. The agents also examine broader risk factors associated with a vessel, such as its registered flag state — identifying potential flags of convenience commonly used to obscure true ownership — and its insurance provider, cross-referencing these details against known risk indicators to build a more complete picture of a vessel's legitimacy
Challenges we ran into
- Tuning the VAE's latent space to detect subtle deviations without over-flagging routine course corrections
- Integrating the multiple layers of the system — the VAE anomaly scores, the IBM Watson AI agent, and the FastAPI backend — into a coherent pipeline where each component communicated reliably and outputs from one layer fed meaningfully into the next
- Surfacing all of this complexity through a clean, responsive frontend, ensuring that the geospatial map, anomaly data, and AI-generated insights all came together into a seamless user experience without overwhelming the interface
- Prompt engineering the AI chat agent to produce actionable intelligence reports rather than raw data summaries
Accomplishments that we're proud of
- Successfully bridged a deep learning anomaly detection model with a generative AI layer, turning abstract VAE outputs into clear, human-language explanations
- Built a dual-perspective UX that lets users switch seamlessly between a global fleet cluster overview and a granular single-vessel analysis
- Transformed large volumes of noisy maritime data into high-fidelity, actionable intelligence
What we learned
- How VAEs can model normal movement patterns and surface anomalies when vessel trajectories deviate from learned behavior
- How to integrate multiple AI components — anomaly detection, LLM reasoning, and geospatial visualization — into a cohesive end-to-end pipeline
What's next for Popeye
- Expand to larger, real-time global vessel data streams
- Improve behavioral models and the AI analysis layer for greater detection accuracy
- Integrate satellite imagery as an additional data source, enabling visual confirmation of suspicious vessel behavior such as ship-to-ship transfers or AIS spoofing that may not be fully captured by tracking data alone
- Develop deeper investigative tools to help analysts understand how coordinated shadow fleet networks operate across the world
Built With
- fastapi
- html/css
- ibm-watson
- json
- langgraph
- nextjs
- python
- railtracks
- react
- tailwind
- tanstack-query
- vitejs
 Lu")


Log in or sign up for Devpost to join the conversation.