Inspiration
We wanted to create something that makes it easy for the city to view the most severe environmental problems and take action on it. So we were inspired to create an application that creates graphs for multiple different types of environmental issues and compares them with the safe limit and allows the city to make decisions based on which factor is the most significant.
What it does
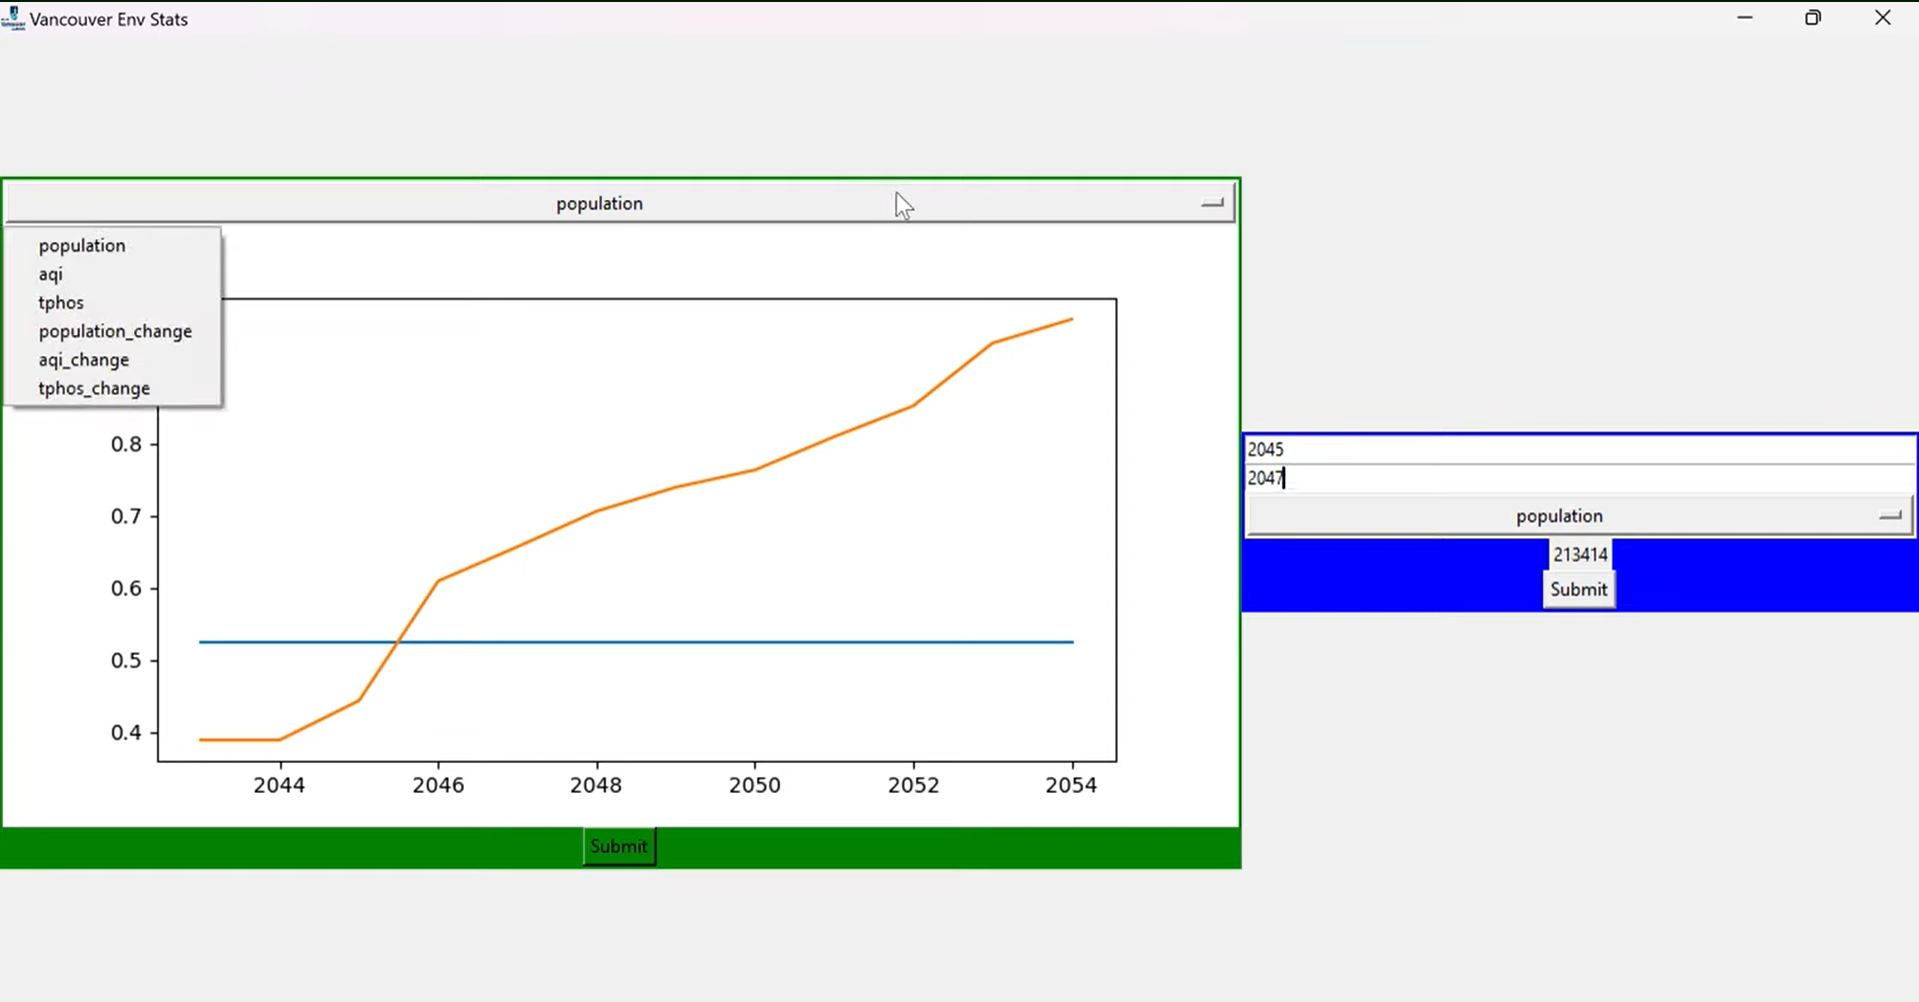
Our program gets information from a csv file and turns all of the data about population, aqi, and phosphorus levels into a graph with years. It also makes calculations based on these values to get the difference between user inputted years of environmental data from Vancouver.
How we built it
We used Python to code this, and we used pandas library to analyze the data and matplot to create the graphs. We also used tkinter to create the UI. We also created a csv file for the data in VS Code. All of our coding was also done in VS Code with LiveShare that allowed use to work together on the same file.
Challenges we ran into
We had a lot of challenges, including running out of time to implement a structure that allows the government to visualize a priority list based on proportional differences between the current values and the safe value. We also had trouble coming up with an idea initially, so there were more variables that we didn't have time to draw the data from like nitrogen presence in water or car emissions, etc.
Accomplishments that we're proud of
Some accomplishments that we're proud of are being able to visualize the data efficiently and also being able to switch between different graphs quickly through a dropdown menu.
What we learned
We learned about different ways to represent data in Python using matplot library and how to use tkinter to design a good UI.
What's next for Vancouver Environmental Stats Program
We hope to implement the priority list in the future. We also hope the the environment doesn't get as bad as it is in our dataset. (:


Log in or sign up for Devpost to join the conversation.