-
-
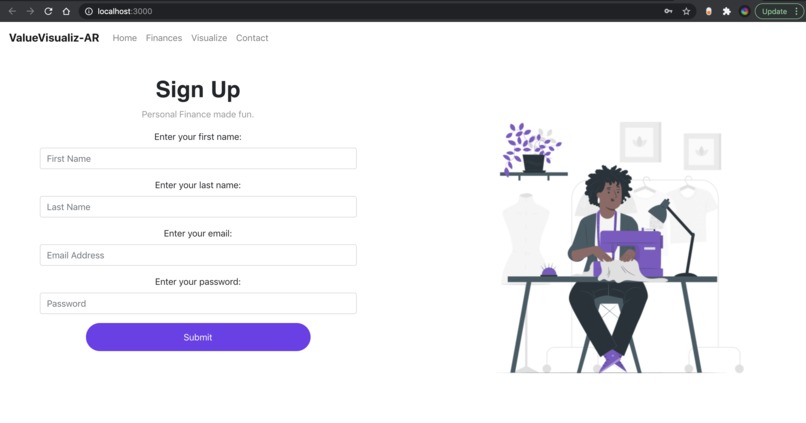
Login
-
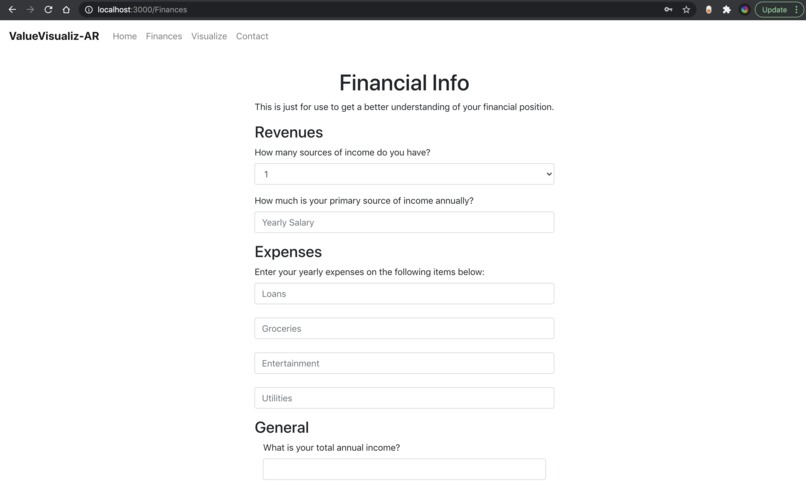
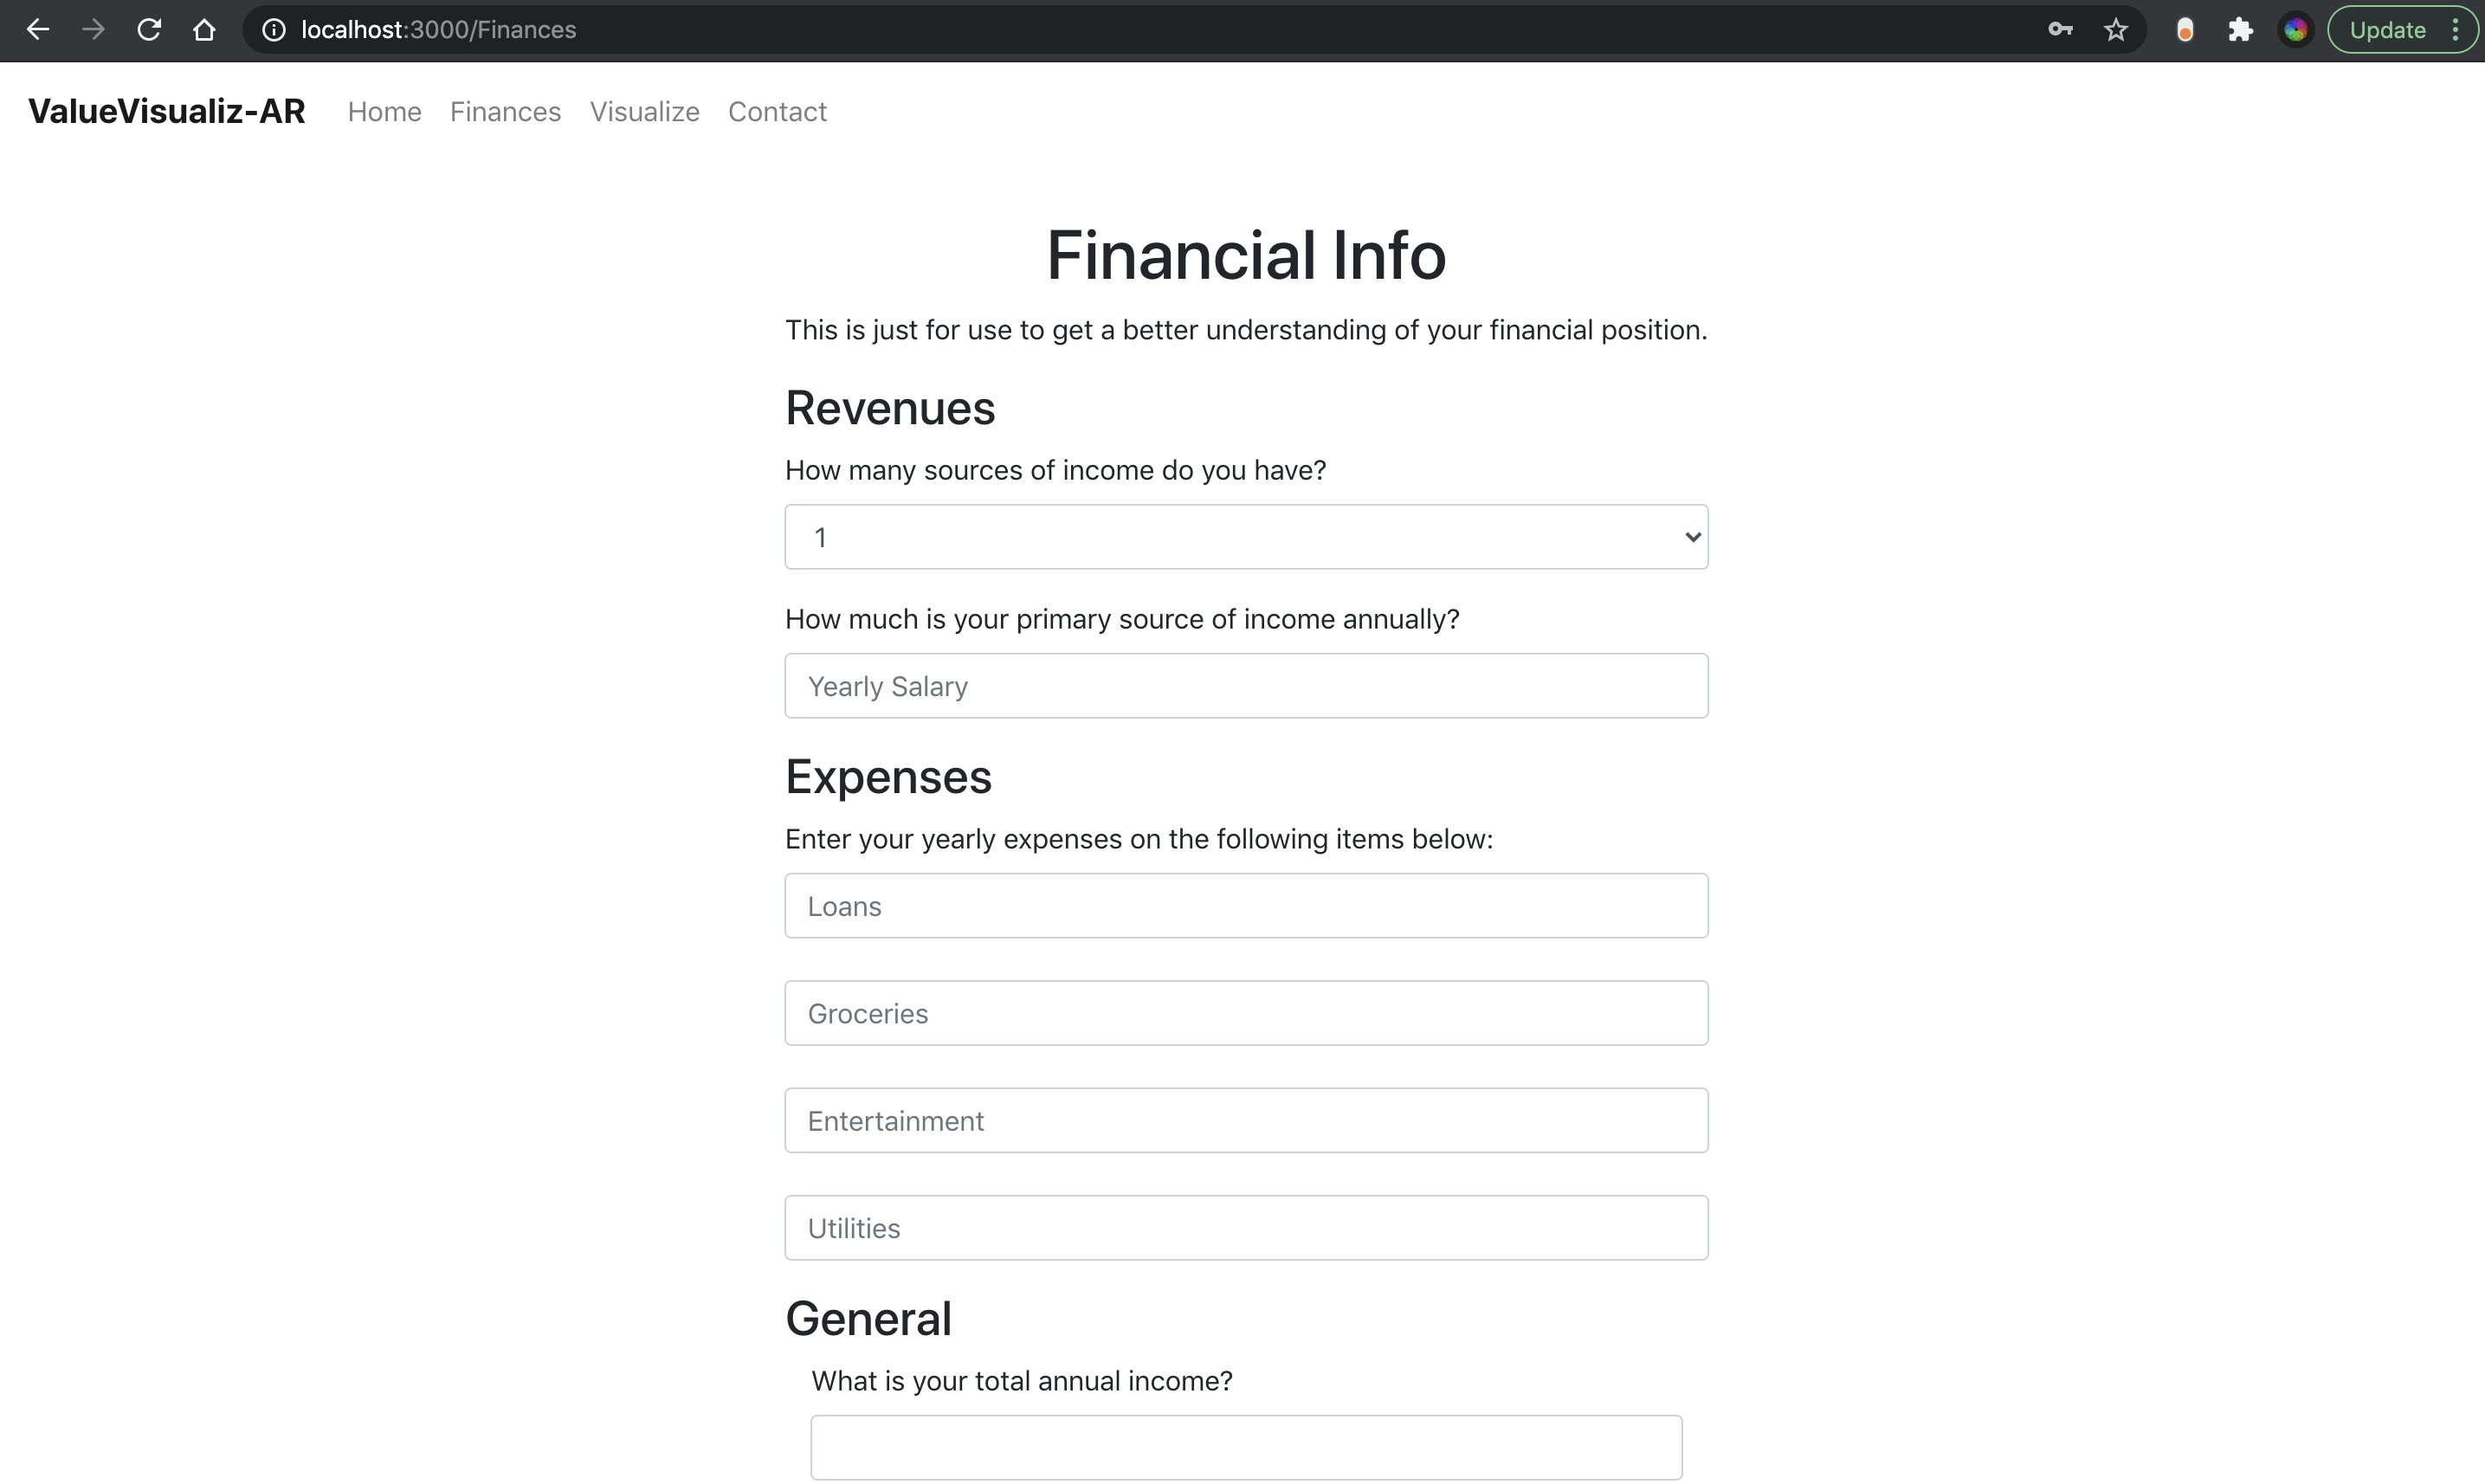
Financial Questions
-
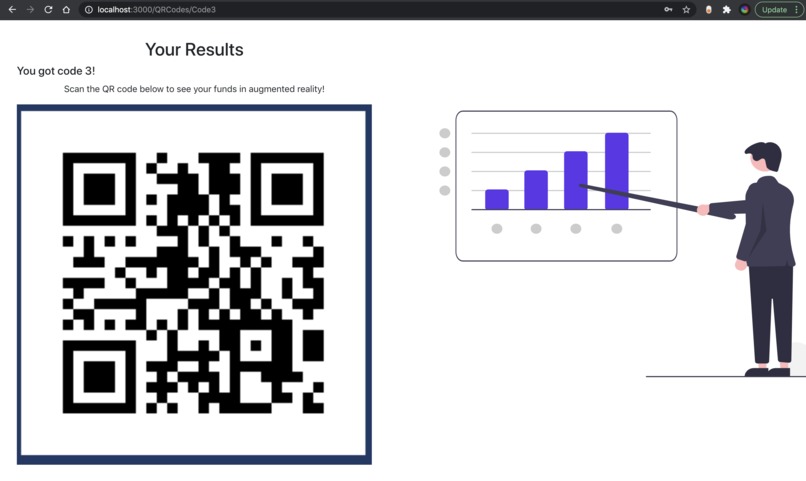
QRCode
-
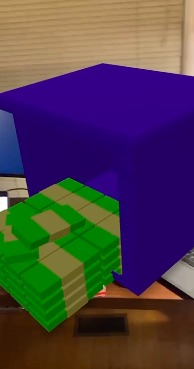
AR Example


Inspiration
As university students, we empathize with the struggle of paying off student loans and working tireless hours trying to complete schoolwork. Money spent on ordering food over the course of a week often becomes an afterthought during the midterm week where the last thing we want to spend our time on is making meals. It is too easy to be reckless with our money. That is why we spoke to Melissa, a third-year engineering student who gets classic difficulties of university life. We realized that there is a need in the market to better visualize people's personal finances.
What it does
Our solution has two components; one being the website which harnesses and gathers user data, the second being the AR experience powered by EchoAR’s system. With these two hand in hand, we hope to deliver an interactive user experience where people see how they stand financially in real-time in a unique way.
How we built it
1) Miro board to better ideate what issues are prevalent in our lives and what we want to address.
2) The prototype and demo are displayed using Figma.
3) Discussed potential stacks we could use to best execute the project.
4) Original idea used the same software and languages as mentioned below. However, changed from Excel and MongoDB to using EchoAR as our back-end and react as our front-end.
Challenges we ran into
1) EchoAR can only create custom animations using Unity. With our original plan being to use excel to generate the 3D charts and present them using EchoAR, we had to pivot and discover new ways to deliver a similar message with different content.
2) React routers.
3) Using MERN stack for the first time.
4) Tried to incorporate MongoDB.
Accomplishments that we're proud of
1) Working AR prototype that helps visualize finances by placing users in 5 different categories.
2) Introduction to the back-end (MongoDB and Node.js) for some members.
What we learned
1) Learned how to use React, Bootstrap, and AR in daily life.
2) Trying to figure out how to create custom images in augmented reality.
What's next for Value Visualiz-AR
1) Custom graphs and charts in augmented reality.
2) Helping users track their progress in achieving their budgeting and saving goals.
3) Creating special AR models for users when they reach their milestones.

Log in or sign up for Devpost to join the conversation.