-
-
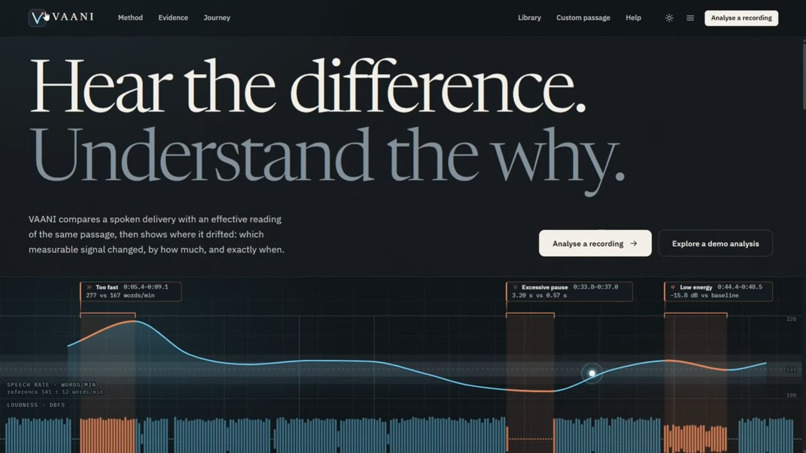
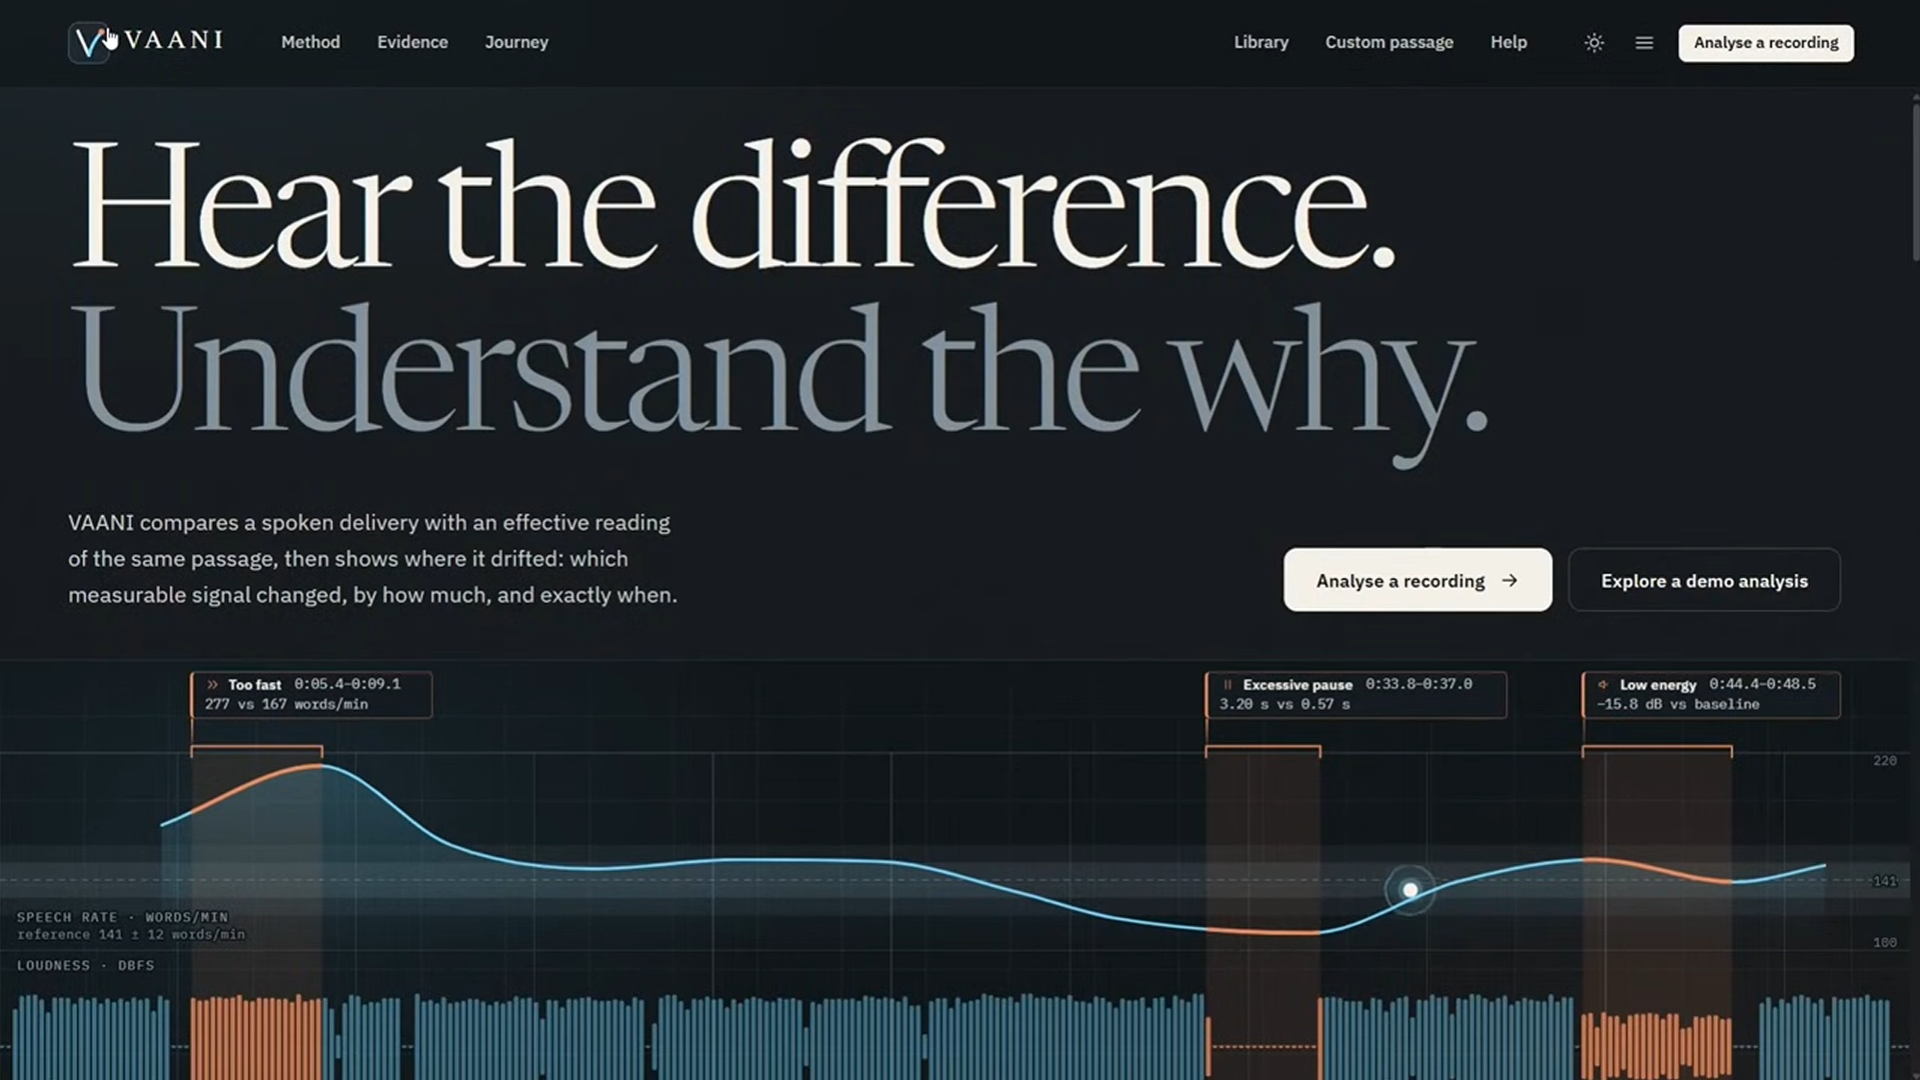
Landing page
-
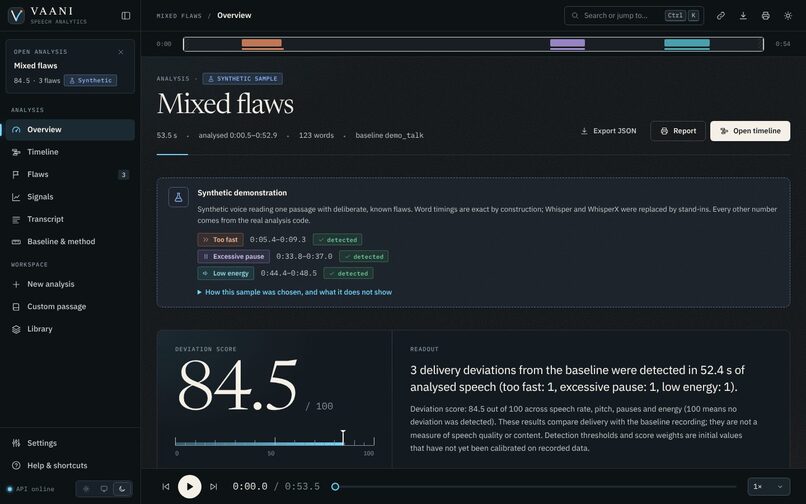
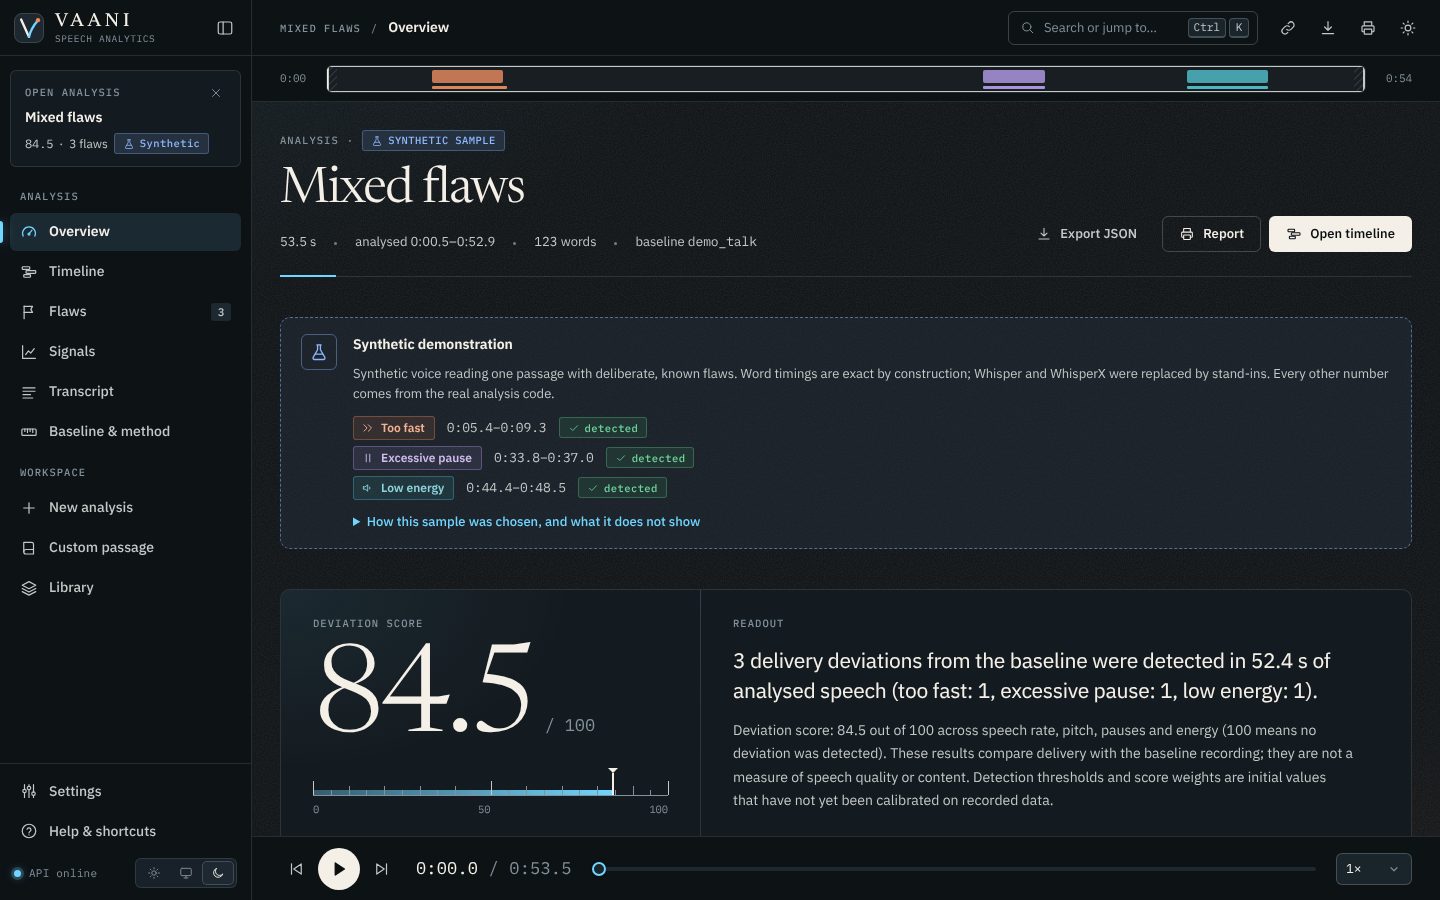
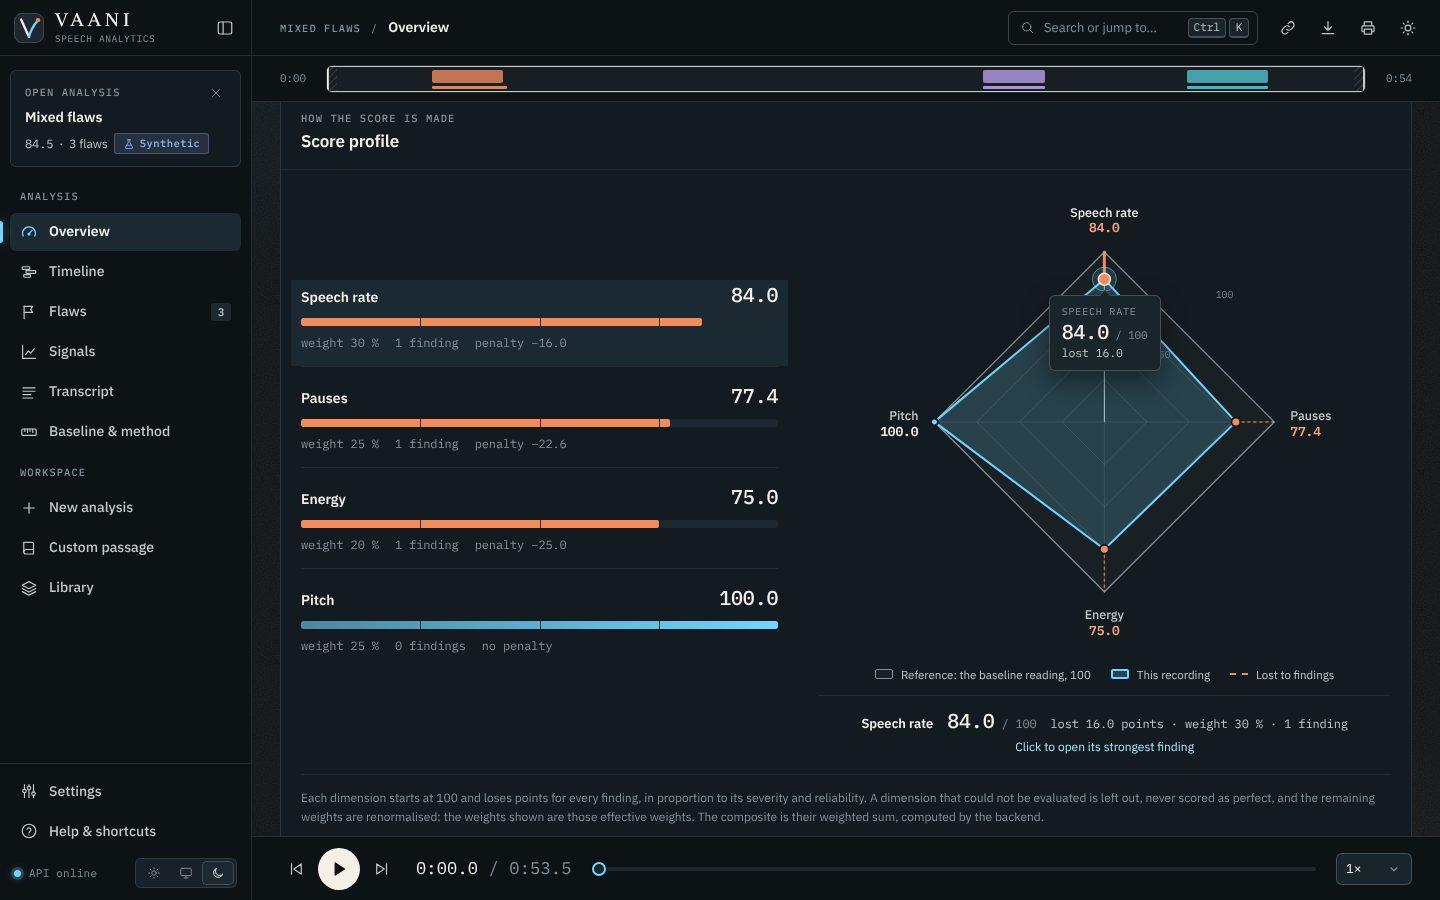
Overview
-
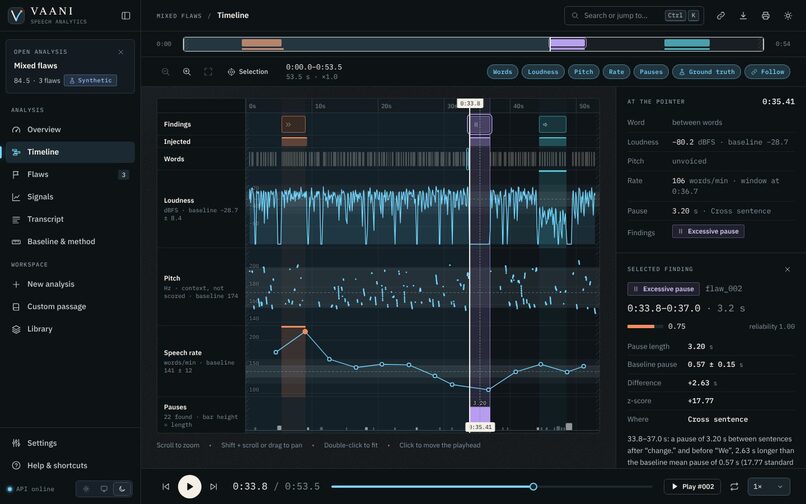
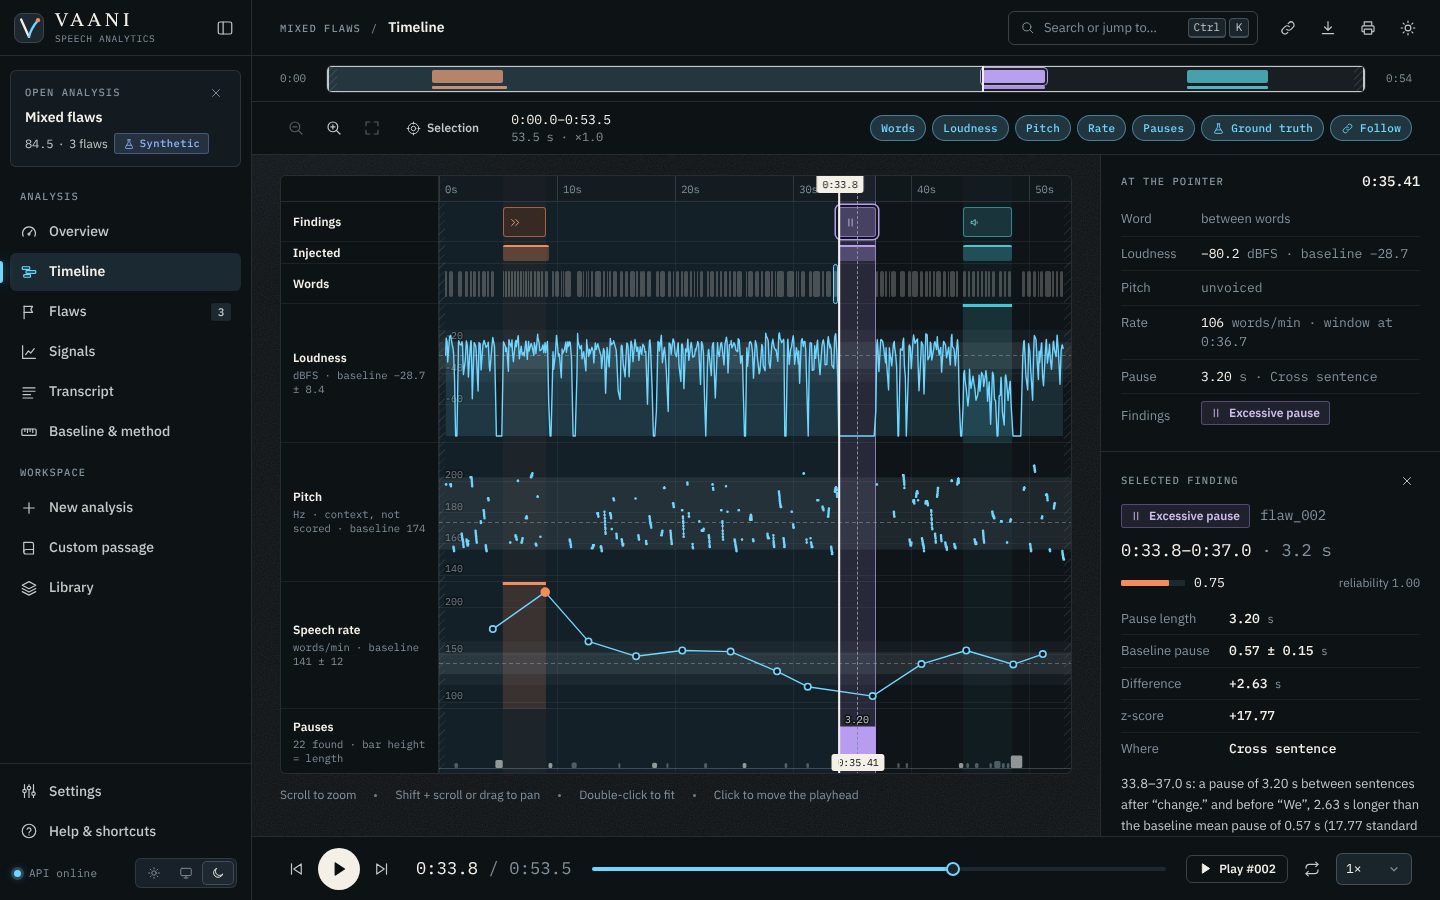
Timeline
-
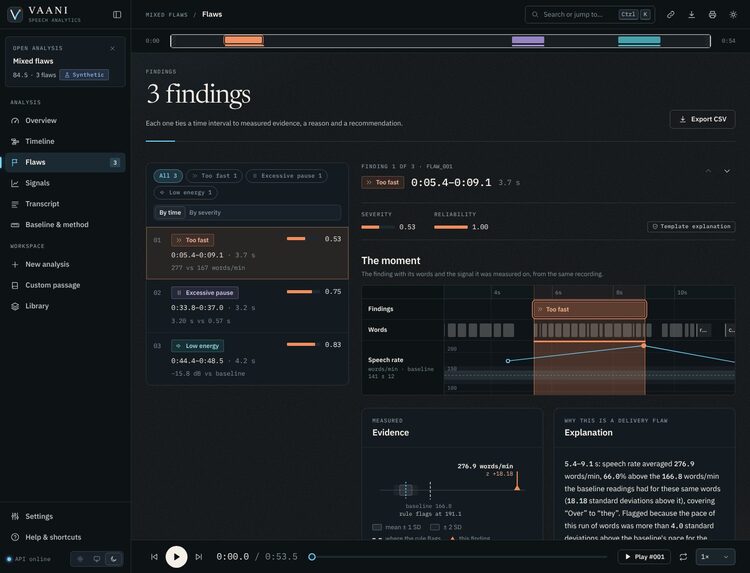
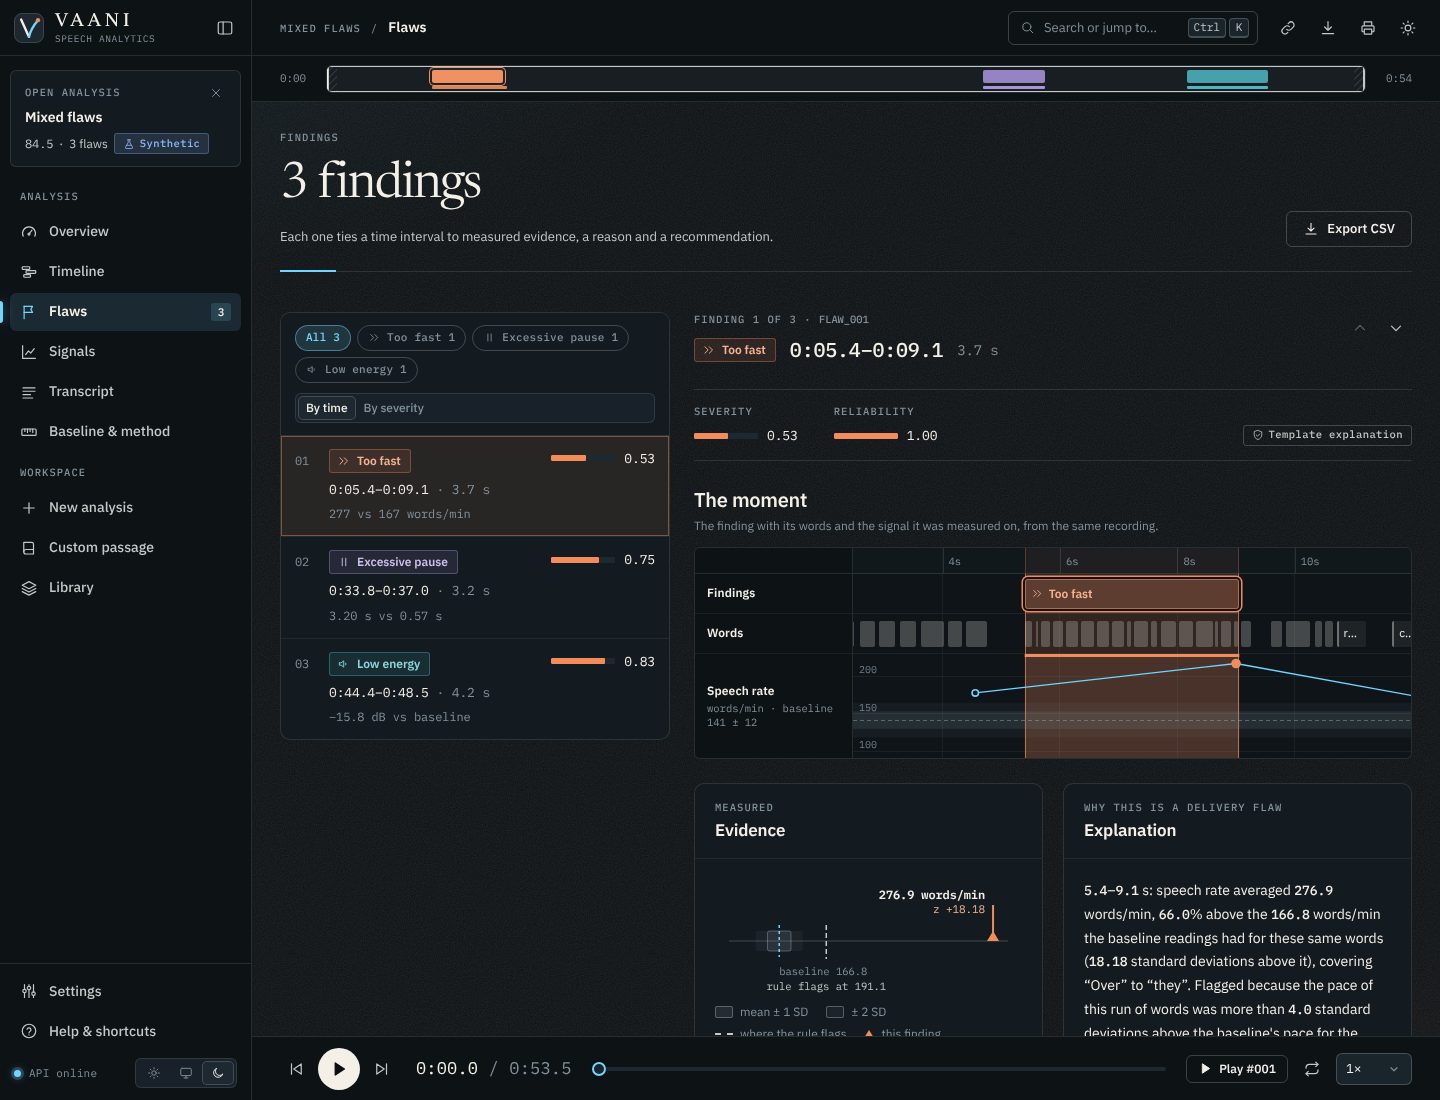
Flaws
-
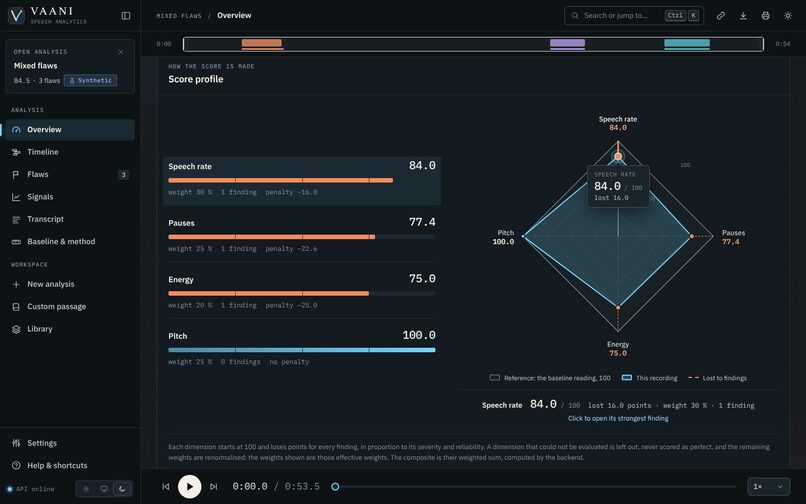
Radar graph
-
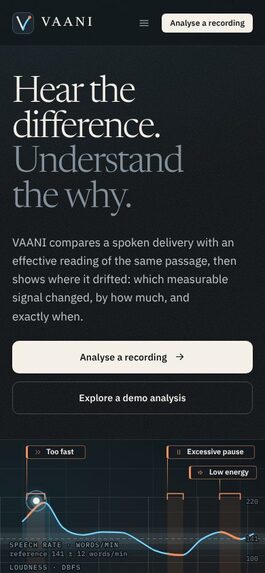
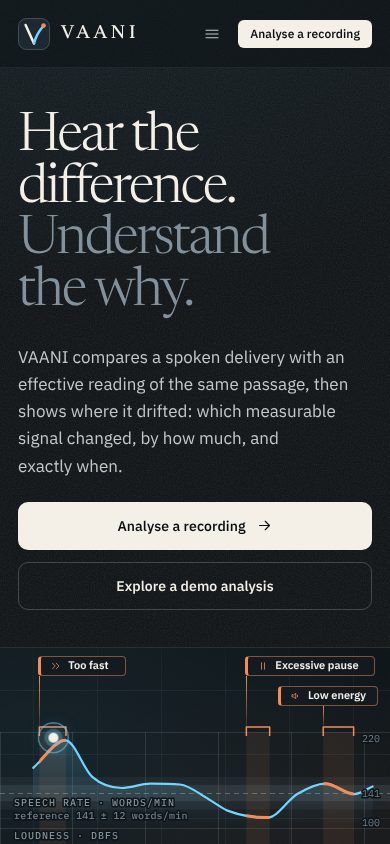
Mobile view
Inspiration
"Speak more clearly." "You rushed that part." Feedback on speech is usually vague, subjective, or a single number. A speaker can't act on it: which part, how much, compared with what? Generic "speech quality" scores also compare people with an imaginary average voice, so they judge the text and the speaker instead of the delivery.
We wanted feedback that shows its work: the exact seconds, the measurement, the reason, and what to try next. That is what Track C asks for, and it is what VAANI does. Hear the difference. Understand the why.
What it does
VAANI compares a recording of a passage with a baseline made from good readings of the same passage. It finds where the delivery deviates and pins each finding to a time interval on word boundaries.
For every finding you get:
- When: start and end in seconds
- What was measured: for example 276.9 words/min against 166.8 for the same words
- The flaw type: too fast, too slow, excessive pause, low energy, high energy, flat pitch
- Why it is a delivery flaw: an explanation built from the measurements
- What to do: a recommendation based on the baseline's own values
A 0–100 score summarises the findings. It is plain arithmetic over them (100 means no deviation), so you can reproduce it by hand from the result.
The dashboard has a live home-page instrument, a timeline that puts pitch, loudness, speech rate, pauses and words on one zoomable axis linked to audio playback, a score-profile radar, per-finding evidence, a transcript view, a printable report, and CSV/JSON export. Custom passage lets anyone paste their own text, record two to six good readings to make a baseline, and then analyse their own reading against it.
How we built it
Pipeline: audio → preprocessing (16 kHz mono, speech-level scaling) → Whisper transcription → WhisperX forced alignment → feature extraction (pYIN pitch, MFCC, energy, speech rate, pauses) → baseline normalisation → word-by-word contrastive comparison → flaw detection → severity → deterministic scoring → evidence-backed explanation → API → dashboard.
- Contrast, not an average. The baseline keeps, for every word of the passage, how long it took, how loud it was, and how much the pitch moved across several good readings. A naturally long word or an expected pause is not mistaken for a flaw.
- Deterministic by design. The same input and configuration always give the same findings, scores, and the same
analysis_id, a hash of everything the result depends on. - Evidence before explanation. Explanations are templates filled from measured evidence. An independent guard rejects any sentence containing a number that was not measured. No LLM runs anywhere.
- The backend owns the truth. The React dashboard only draws what the FastAPI backend returns, and its TypeScript types are generated from the API's OpenAPI document.
- Quality. 1,389 backend tests and 386 dashboard tests, an axe-core accessibility audit with no violations across 70 page and state combinations, and 42 end-to-end browser checks.
Severity combines the size of the change with how long it lasted. Each finding costs its dimension $30 \times \text{severity}$ points, and the composite is a weighted sum: speech rate 30 %, pitch 25 %, pauses 25 %, energy 20 %.
Challenges we ran into
- Telling a flaw from the text. One average pace per passage can't separate a rushed sentence from a sentence of short words. We built a word-level baseline profile so each word is judged against how good readers read that word.
- Making numbers trustworthy. We needed every figure on screen to be traceable to a measurement, so we separated detection, scoring, and explanation, and added the number guard.
- Loudness across recordings. Different microphones and gains made energy hard to compare, so we scale each recording by its typical speech level.
- A dashboard that stays honest. Rendering many signals on one time axis while keeping playback, hover, zoom, and accessibility working took a purpose-built SVG charting layer and a single design system.
Accomplishments that we're proud of
- Findings are grounded to the word: the interval, the evidence, the explanation, and the recommendation form one chain.
- A reproducible score that can be recomputed by hand from the API response.
- A complete product, not just a model: API, dashboard, in-browser recorder, custom passages, dataset tooling, and a technical report.
- Everything runs on your own machine, and the dashboard talks only to its own server.
What we learned
Good feedback is specific, comparable, and explainable. Grounding every claim in a measurement and keeping the numerical pipeline deterministic made the whole system easier to test, easier to trust, and easier to explain.
What's next for VAANI
- Detection of pitch instability and reduced vocal clarity
- Coaching text phrased by an LLM that receives only the measured fact sheet and must pass the same number guard
- More speakers and passages in the dataset kit


Log in or sign up for Devpost to join the conversation.