Inspiration
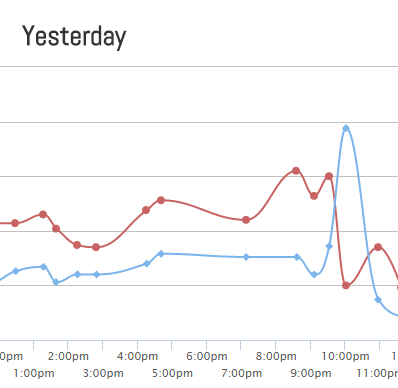
The UWO gym publishes headcounts on Twitter every half hour or so. We decided to graph and analyze that data.
How it works
We use Twitter's API to download the tweets, use basic NLP to parse the data from them, store, average, graph, and analyze them. We use Highcharts for graphs and MySQL for storage.
Challenges I ran into
Parsing the data from tweets was a challenge, as the UWO gym twitter often publishes unconventionally-formatted numbers. In addition, creating variable charts was a difficult task to do.
Accomplishments that I'm proud of
The CSS took a while but was worth it. When we went public, we got a huge amount of hits, which was nice.
What I learned
- CSS layouts
- Lots of JavaScript
- Some data analytics
- Test often and rigorously
What's next for UWO Gym Stats
The twitter account we pulled data from has been indefinitely suspended by UWO's staff, so we have no idea.

Log in or sign up for Devpost to join the conversation.