Inspiration
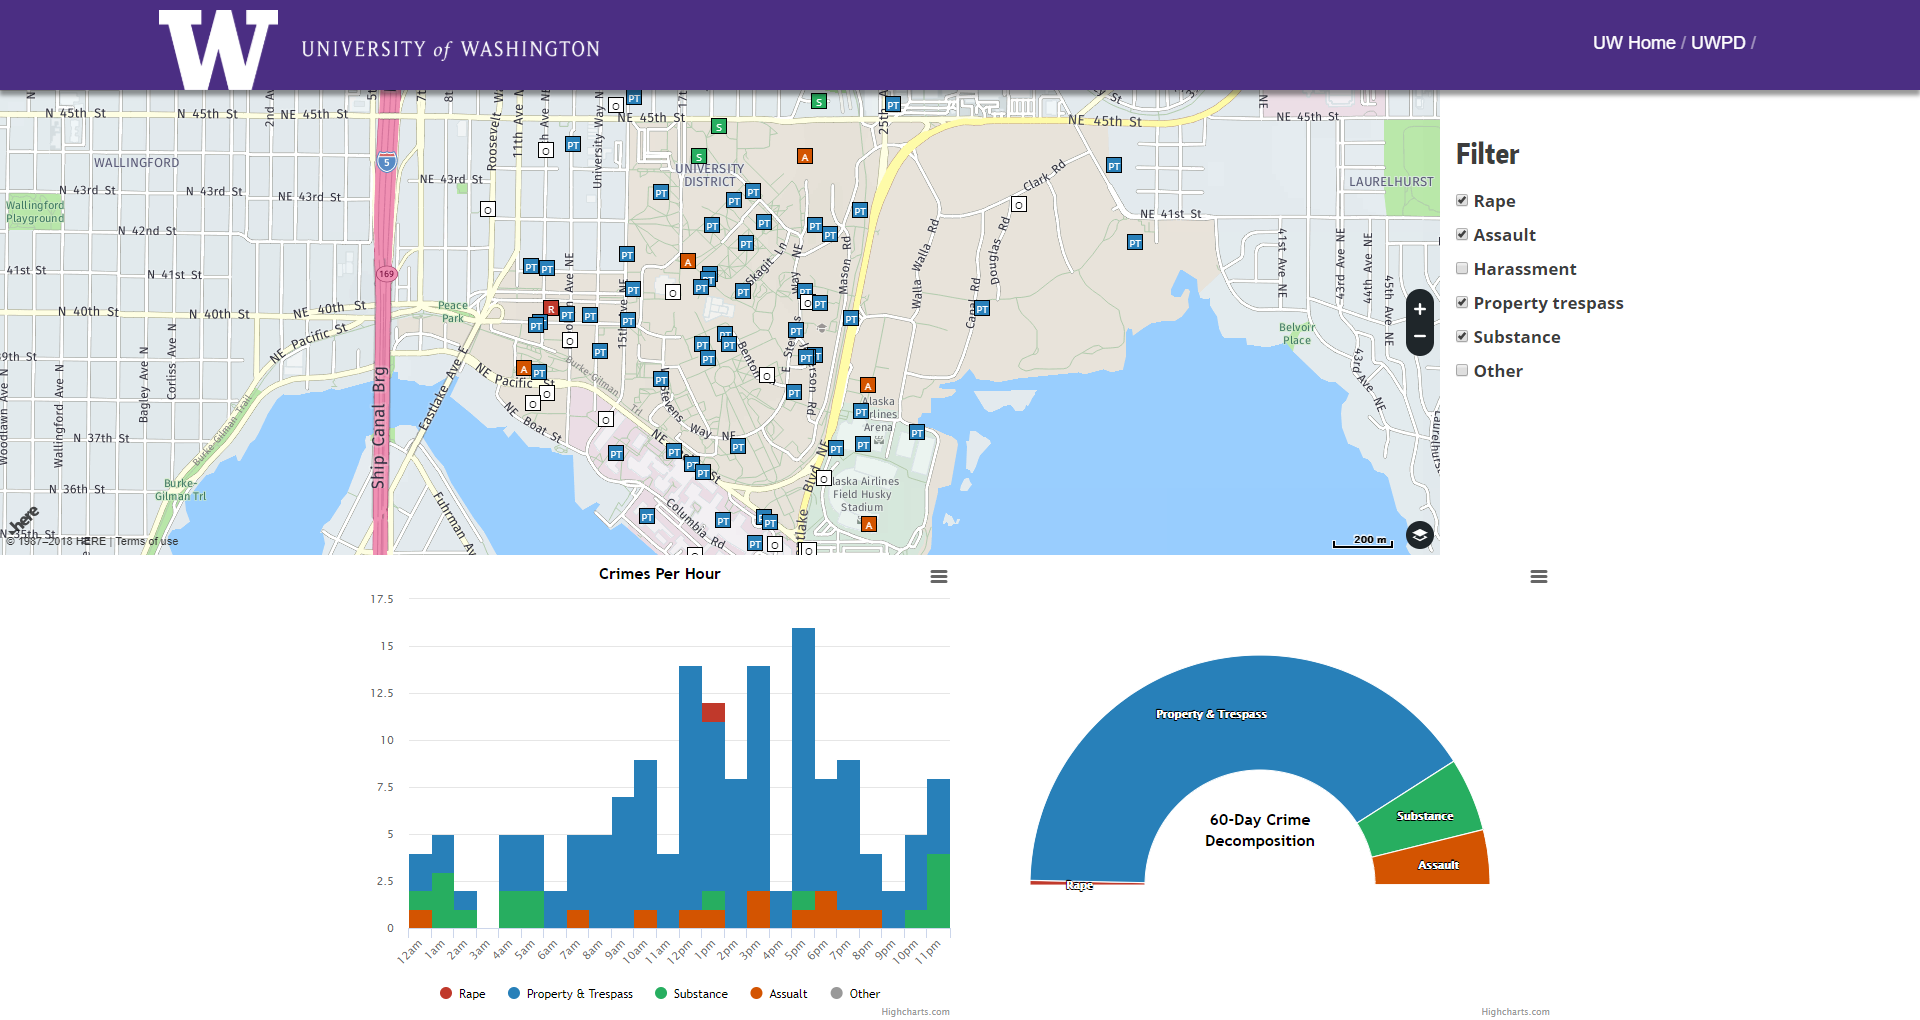
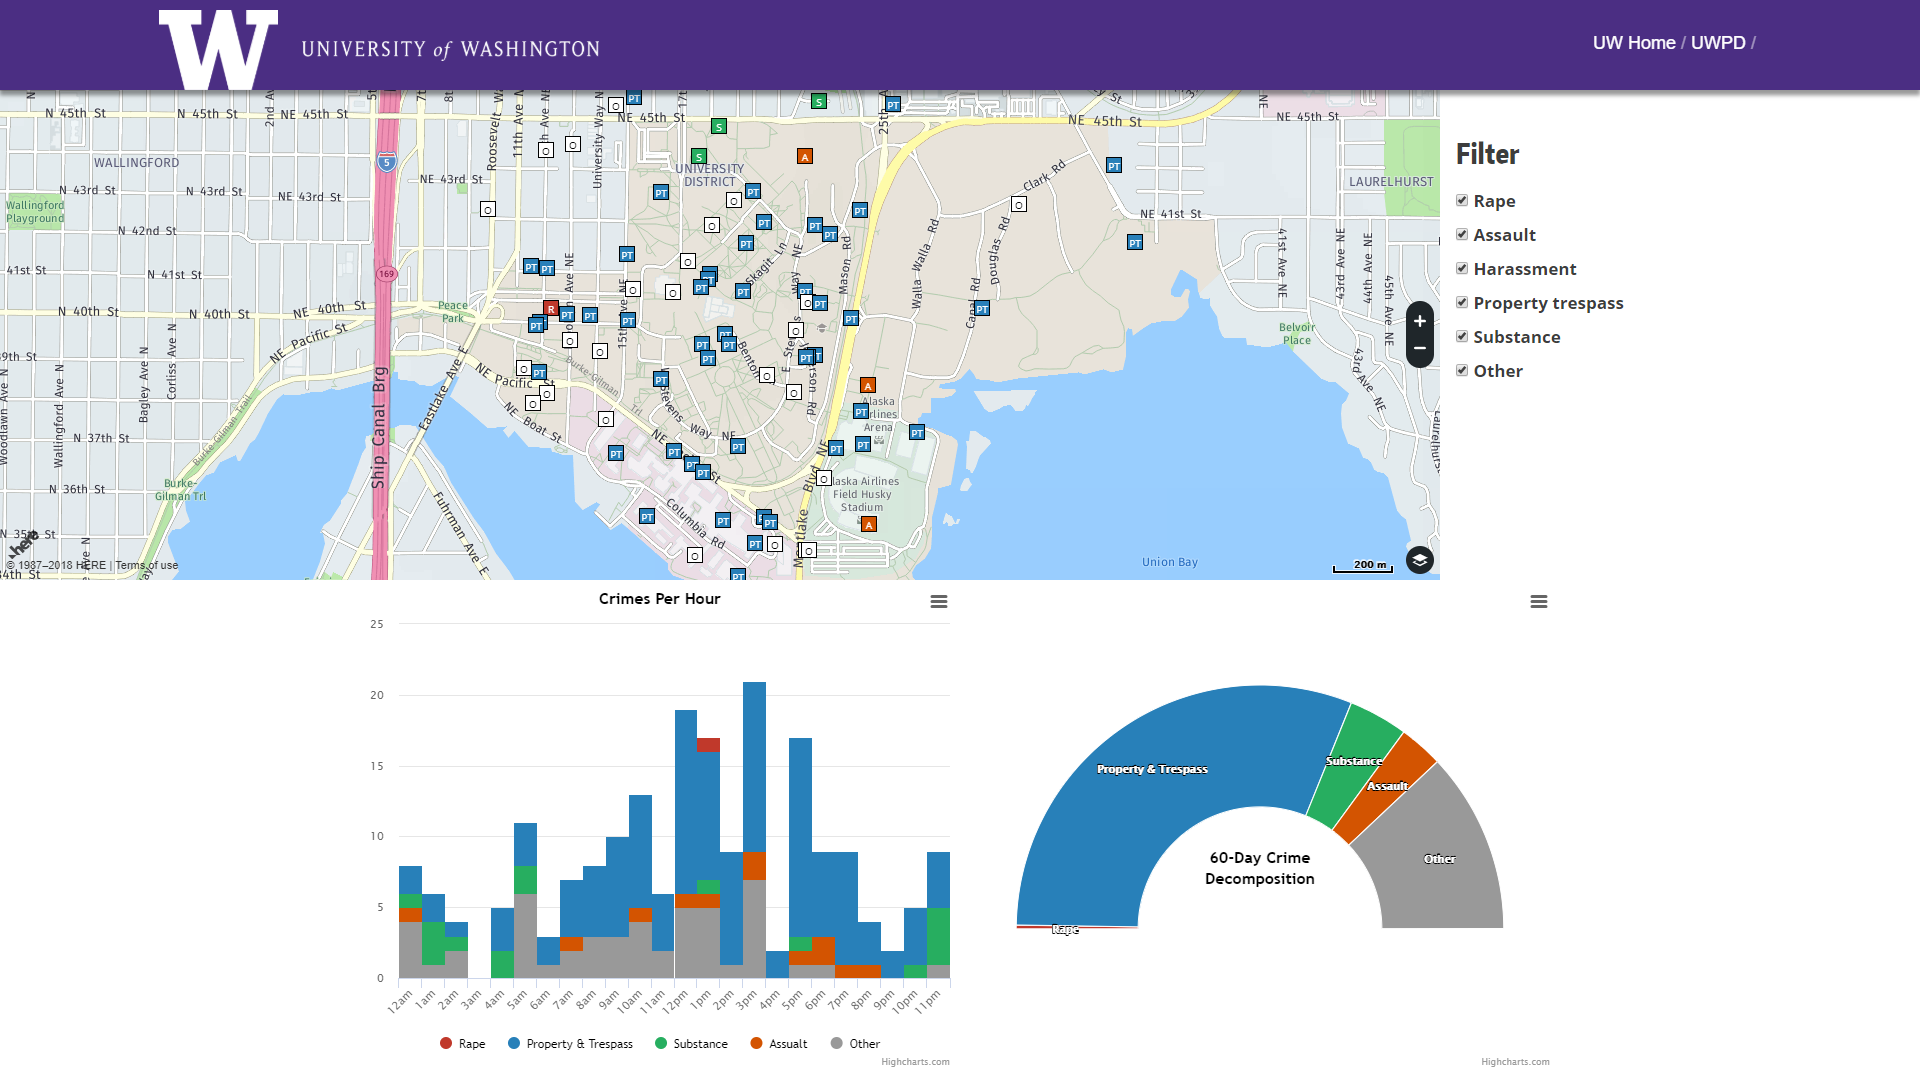
The UW Campus Police Department (UWPD) has a public-facing website that contains crime data from the past 60 days. However, the data are contained within an embedded PDF on the web page, making them largely inaccessible to interpretation. Our goal was to scrape the embedded PDF and visualize the crime data in a user-friendly way.
What it does
Scrapes the PDF data from the UW 60-day crime log and converts it to a machine-readable format that is then plotted in multiple ways for visual intake.
How we built it
- Python web scraper
- JavaScript front-end
Challenges we ran into
- Azure deployment of our web page was difficult and we kept running into GET request errors. We moved our website to a backup, temporary location (linked below) in case of build failures.
- Sometimes the first couple of loads of the web page are "bad loads". Refreshing or using developer tools eventually works.
- PDFs aren't the best format for data and we ran into line break issues.
Accomplishments that we're proud of
We're proud we were able to parse-out data from the PDF and learn new skills.
What we learned
New front-end libraries and tools.
What's next for UW Crime Log
Talk to Chief Vinson at UWPD and integrate this visualization into their Wordpress website.
Built With
- azure
- domains.com
- google-cloud
- google-geocoding
- here
- highcharts
- javascript
- python


Log in or sign up for Devpost to join the conversation.