Inspiration
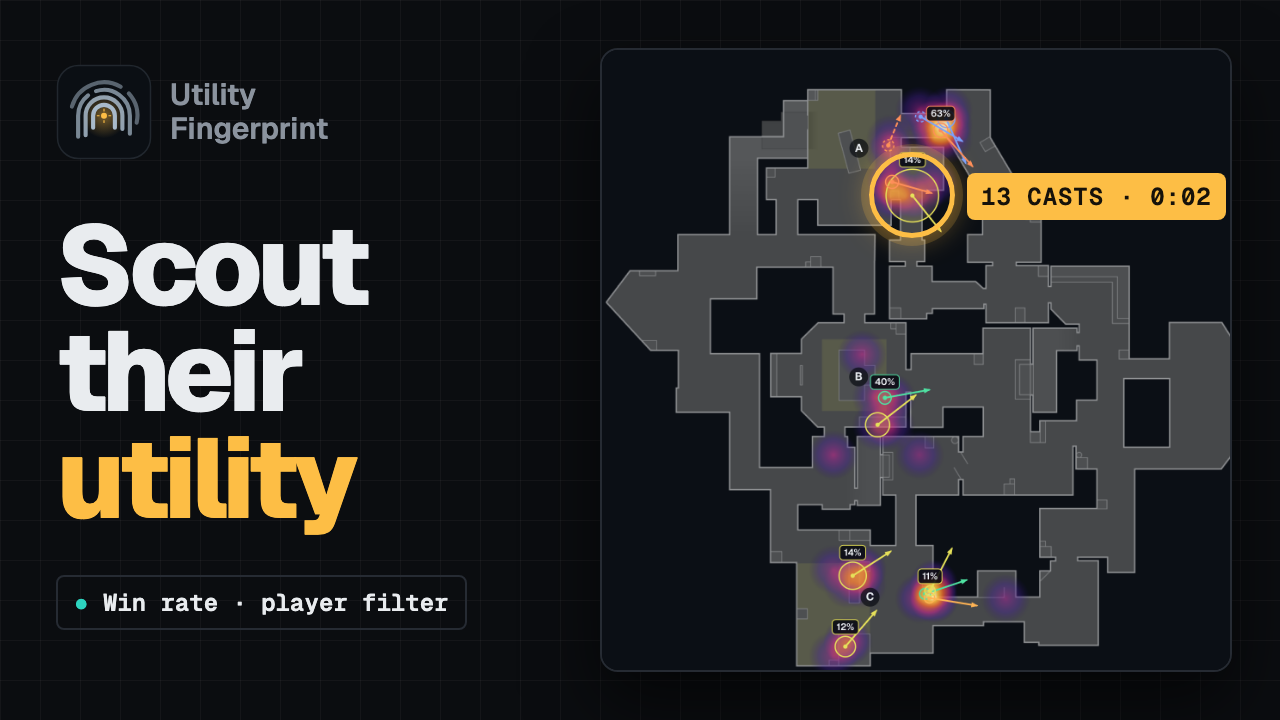
Scouting a VALORANT opponent still means scrubbing VODs to answer spatial questions: which smoke goes out at barrier drop on Haven defense, from where, and who holds the Operator on which side. Stat dashboards (last year's winning approach) answer "how many", not "where" and "when". We wanted the opponent's habits on one minimap, with a written report a coach can trust because every number in its claims is checked against a cited fact.
What it does
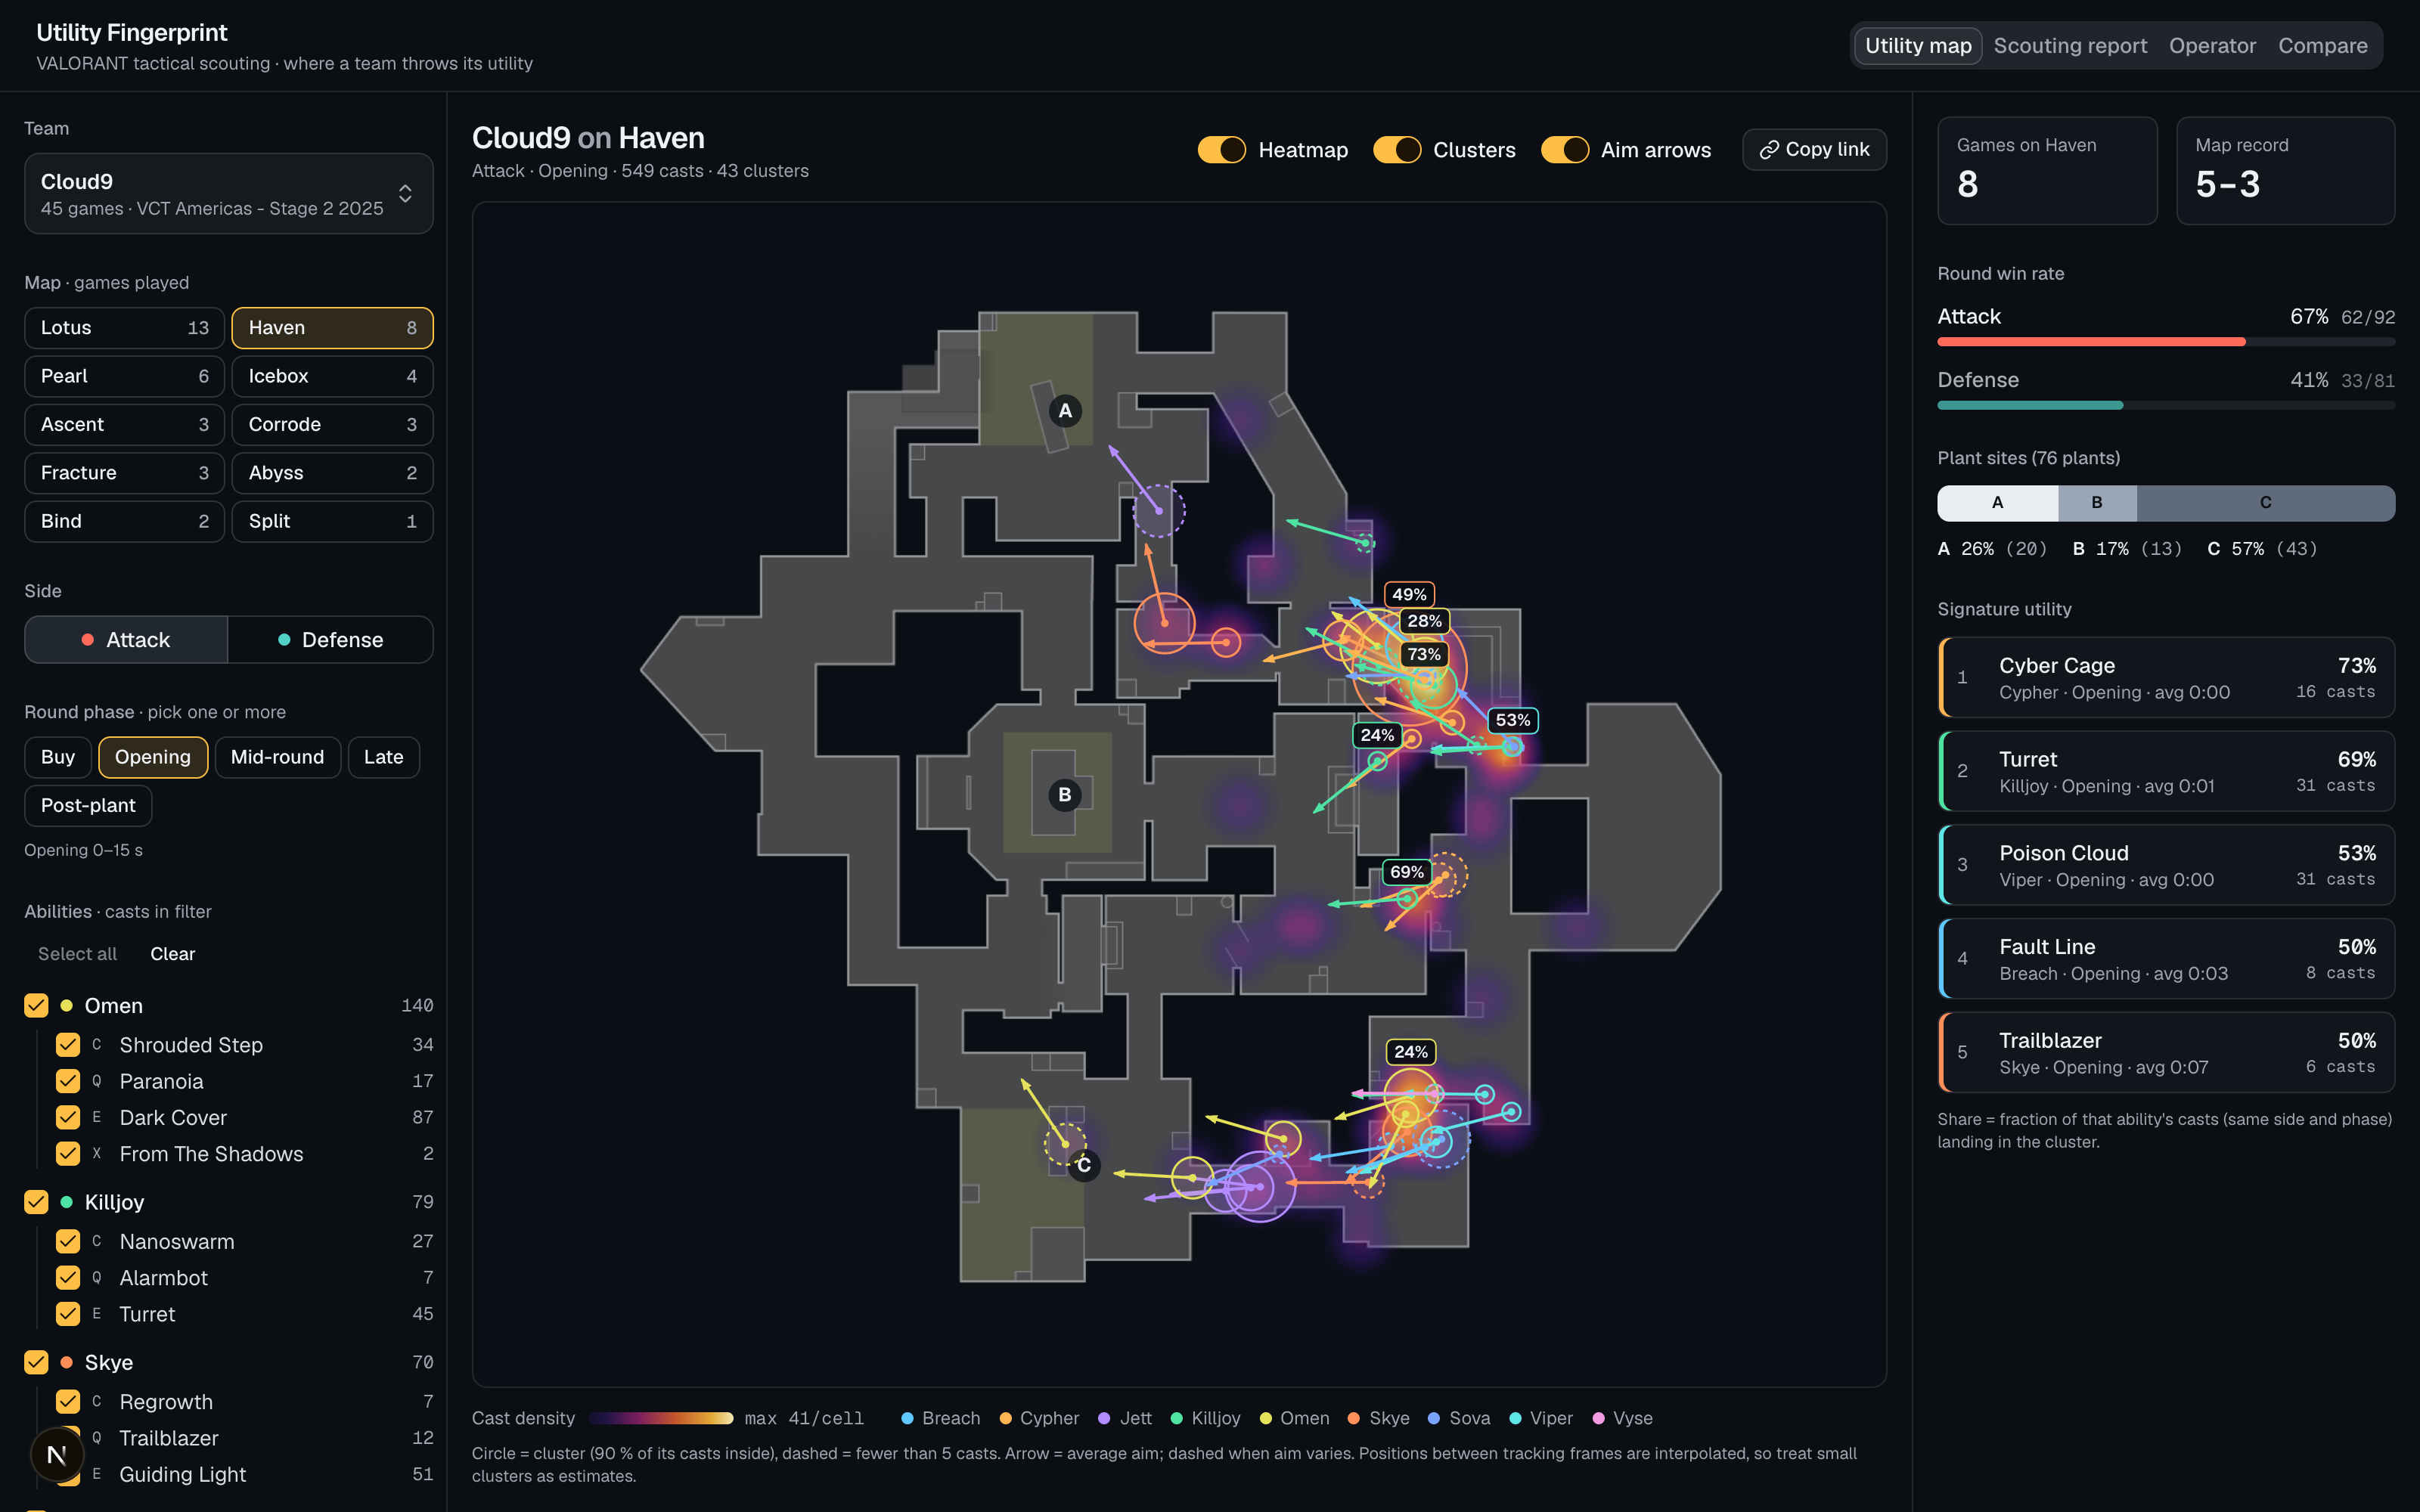
- Utility map: heatmap, DBSCAN clusters and aim arrows of where a team's players stood when casting each ability, filtered by map, side, round phase (buy, opening 0–15 s, mid 15–45 s, late, post-plant) and ability. Clicking a cluster shows the agent, its share of casts and its timing.
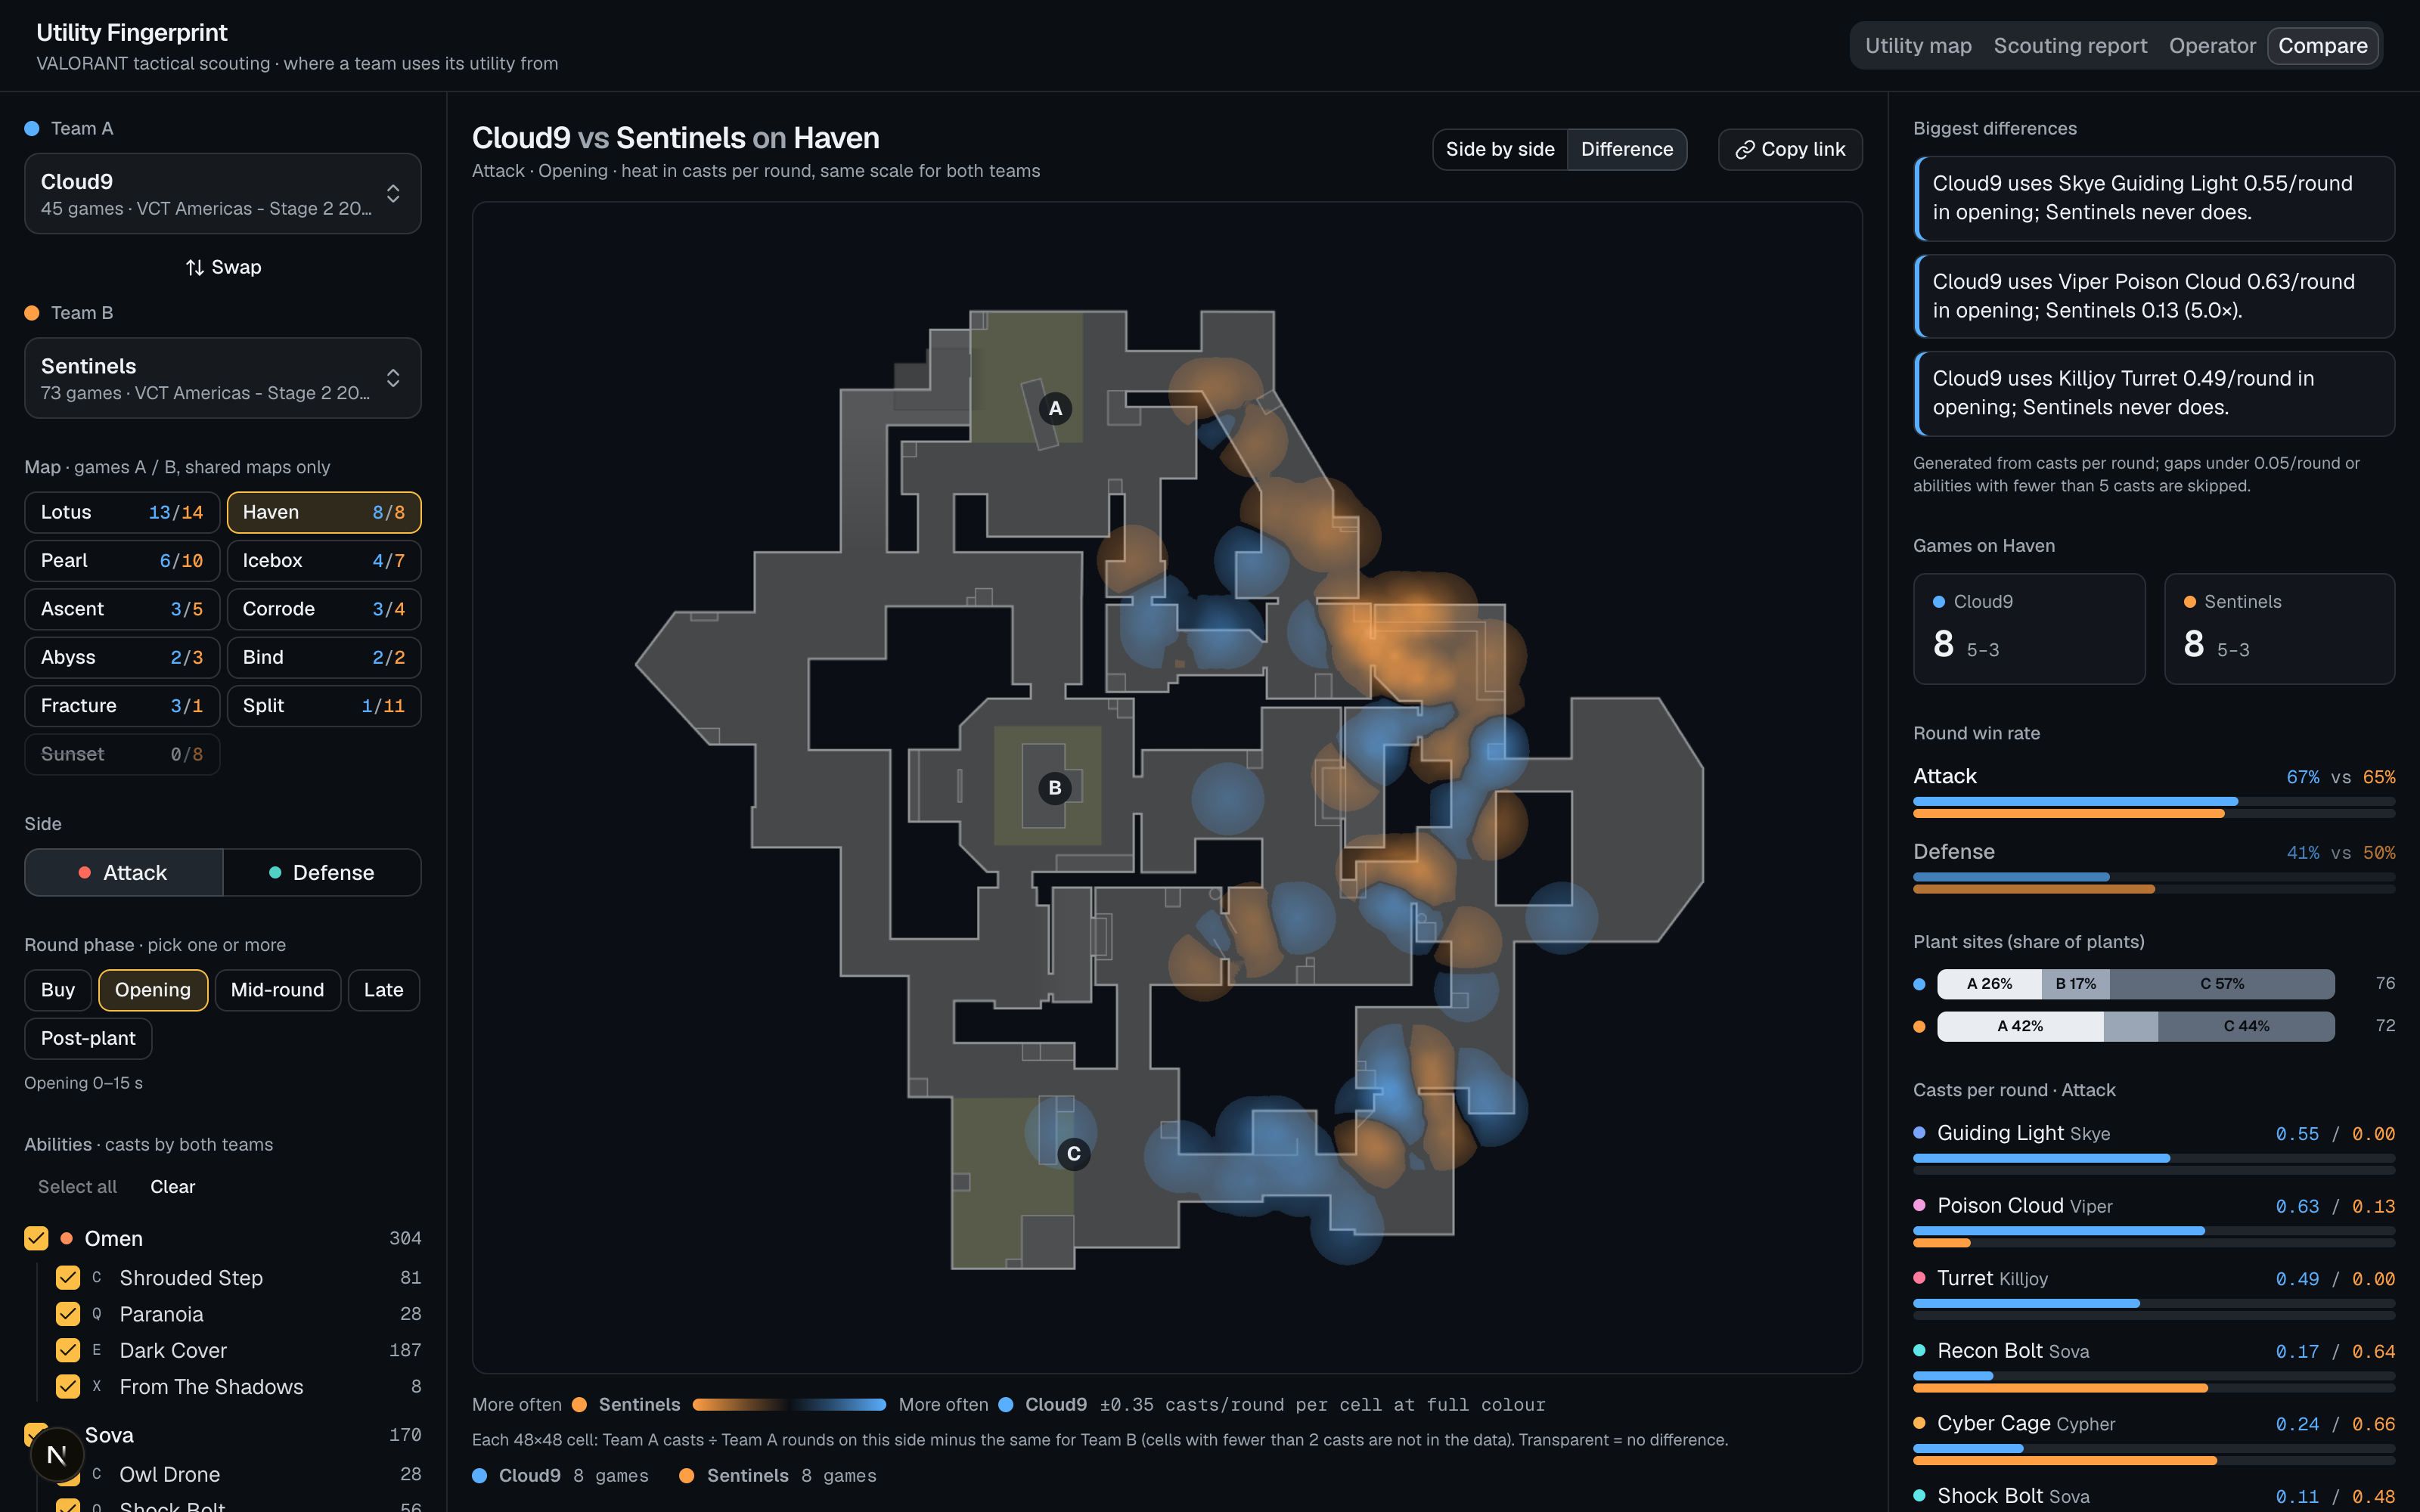
- Compare: two teams side by side or as a diff heatmap, normalised per round played so sample sizes compare fairly.
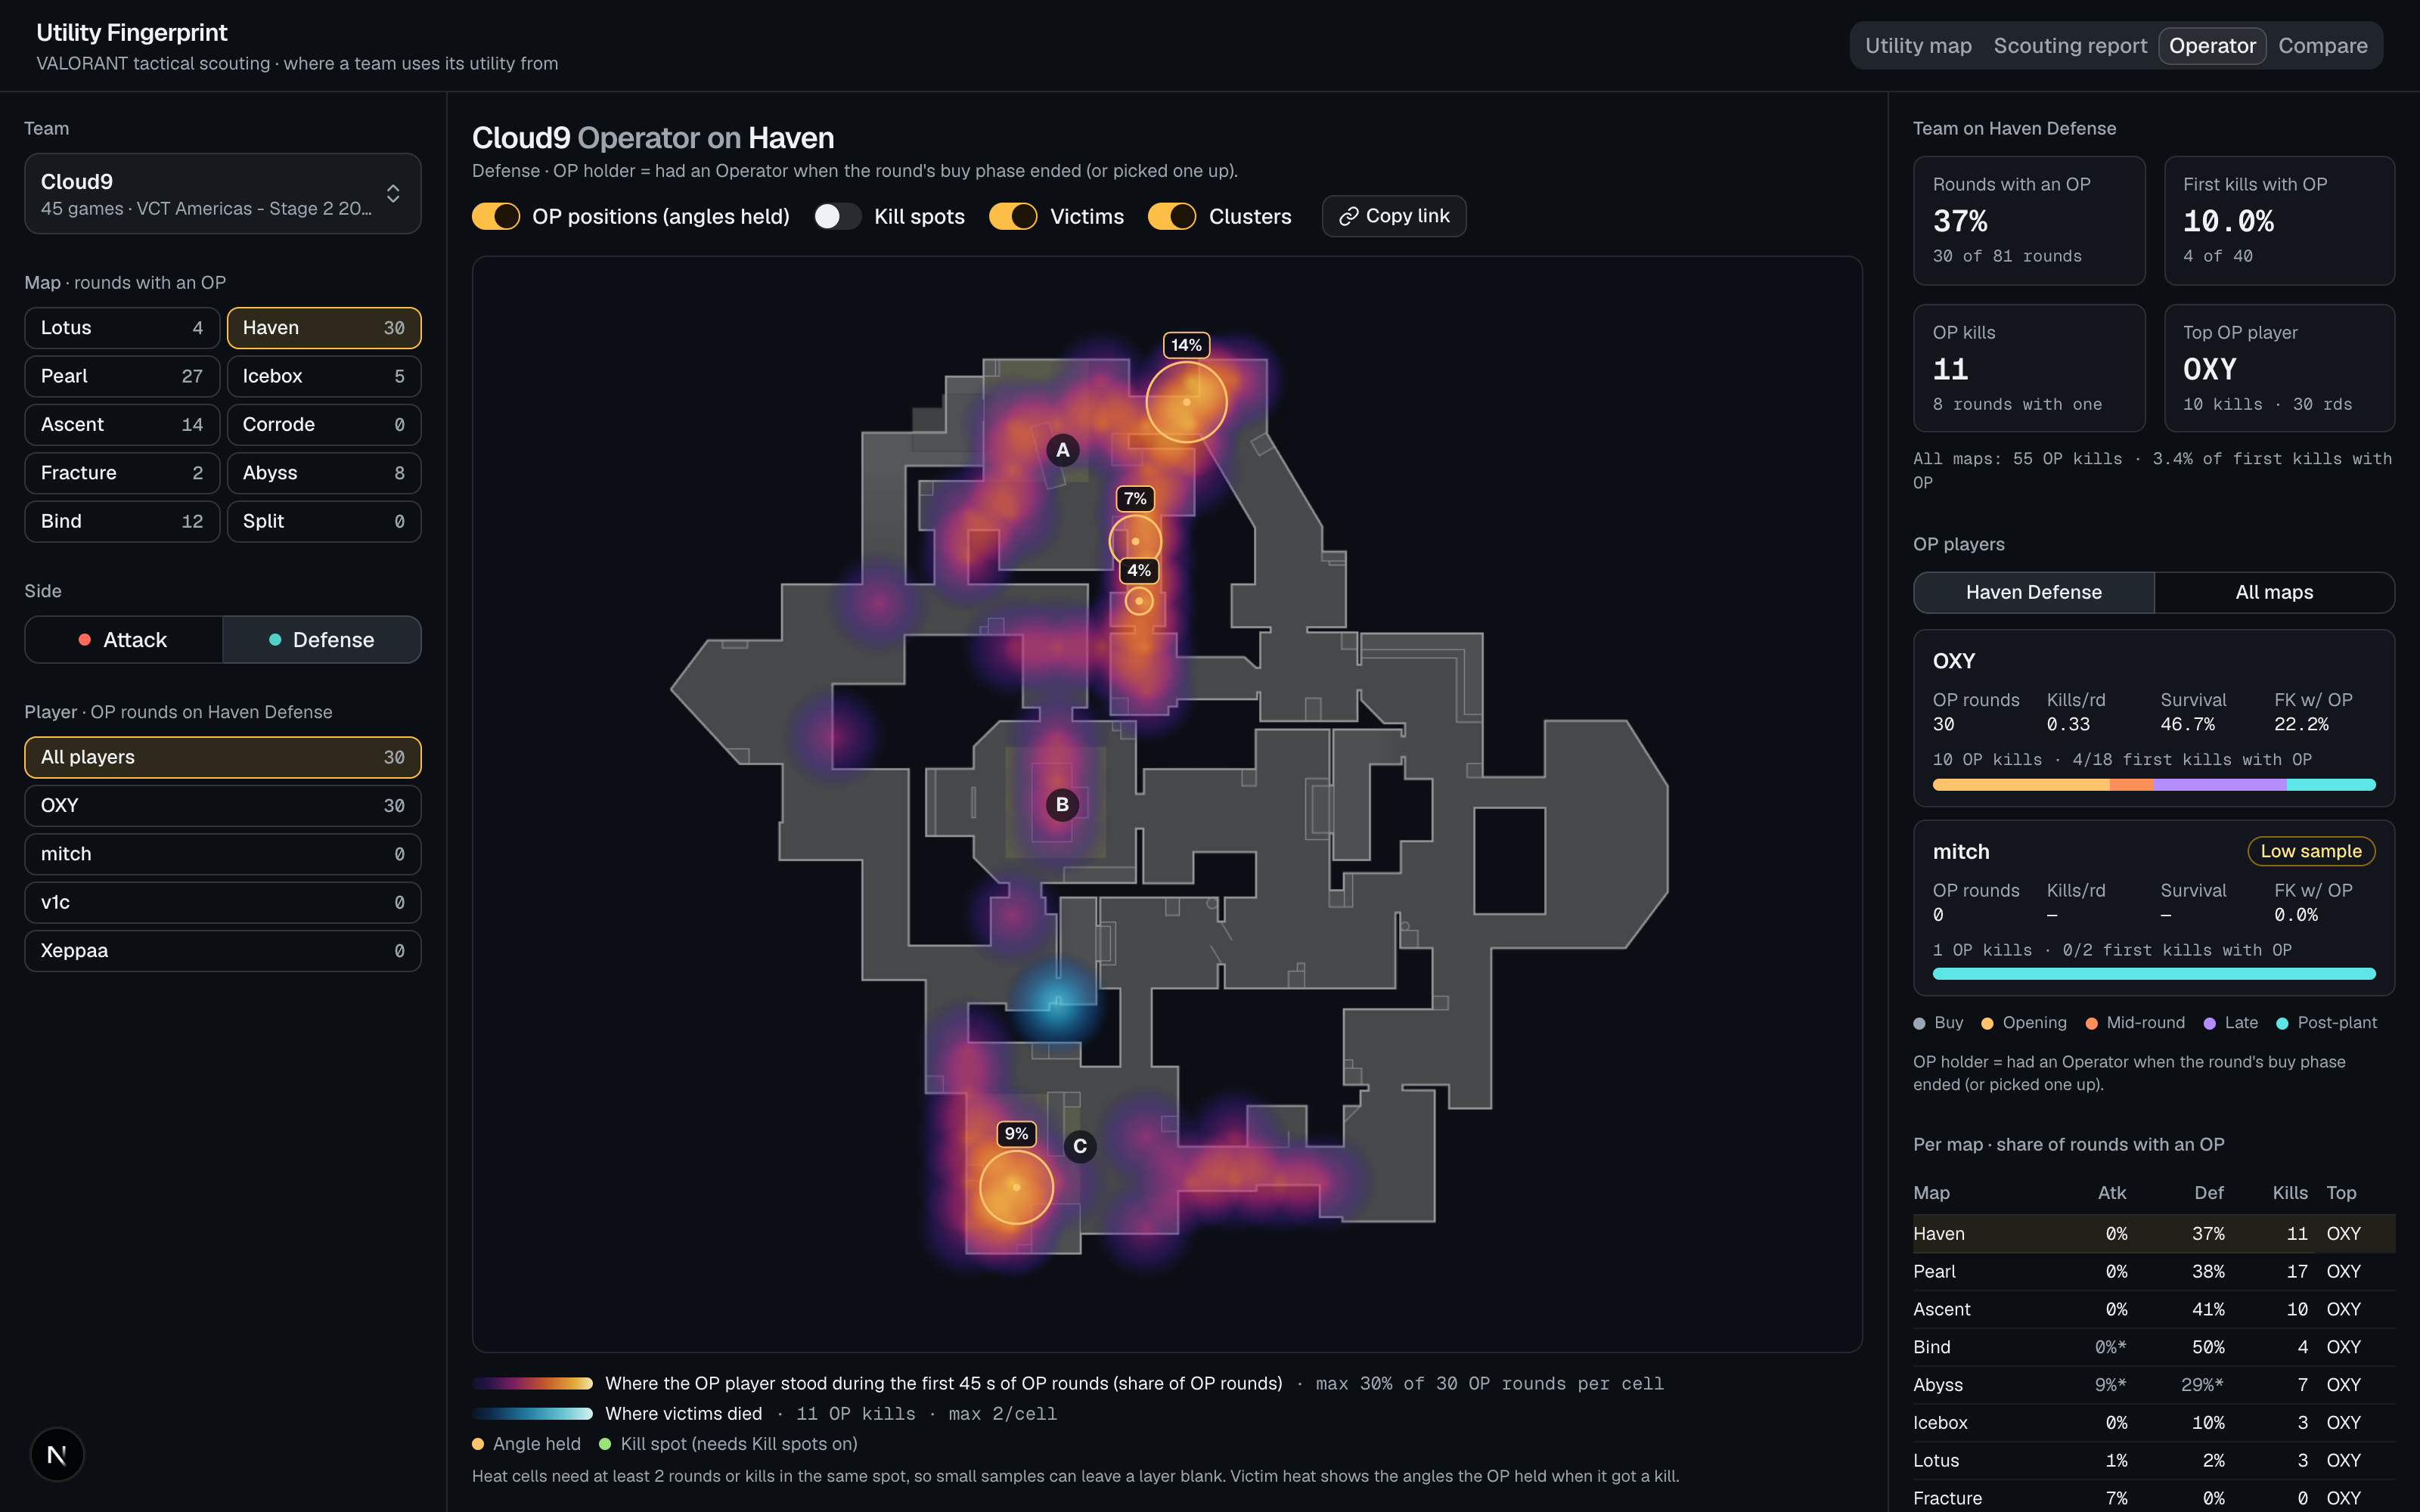
- Operator profiler: who holds the Operator, how often per map and side, kills, survival, share of first kills, and the angles held: holder positions in the first 45 s, kill and victim positions, clusters. Example: Cloud9's OXY held it in 97 rounds for 49 kills, with 46.4 % survival.
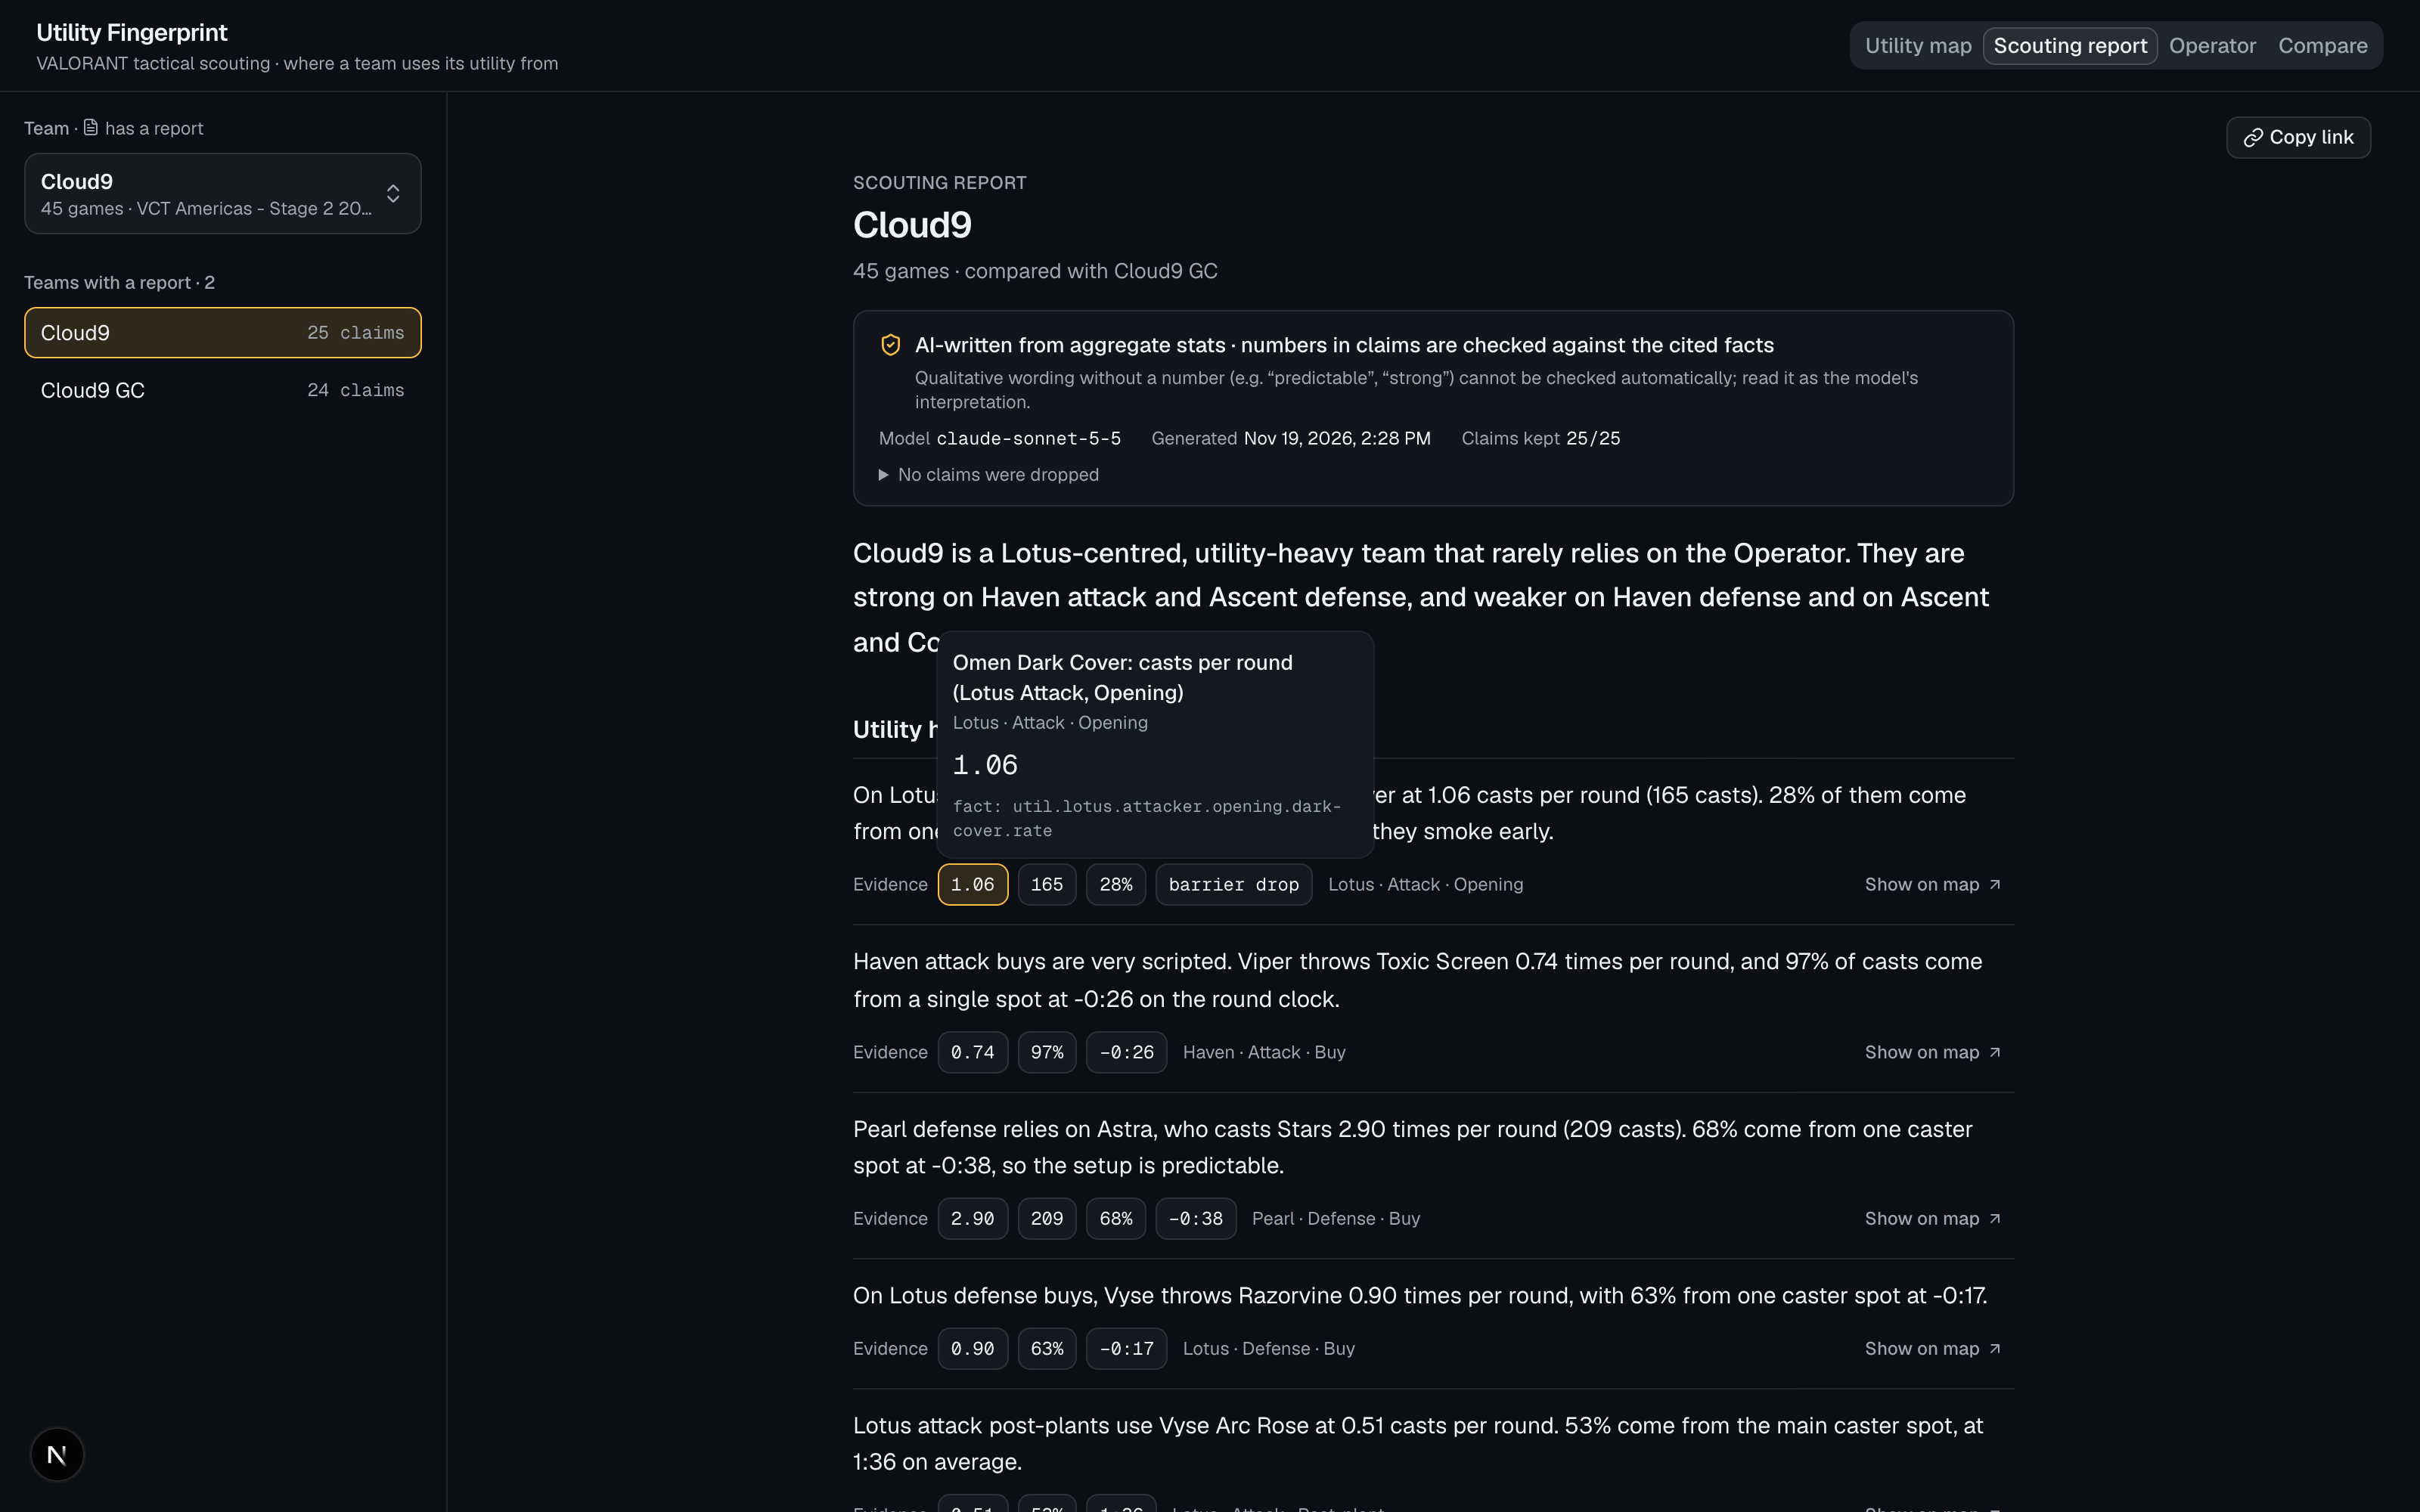
- Scouting report: a Claude-written report per team (headline, utility, Operator, map pool, versus reference, counter-strategies). Every claim cites its facts; clicking a fact shows the value, and each claim opens the matching dashboard view.
- Every view is a URL, so a coach can share exactly what they see.
How we built it
- ETL (Python, Polars, zstandard): streams 856 GRID series in parallel into local Parquet: 2,078 games, 42,529 rounds, 297,113 kills, 1,509,904 ability casts.
- Calibration: GRID coordinates mapped to valorant-api.com minimaps with swapped axes, proven on Haven (100.0 % of sampled plants on the drawn map, 95.6 % on site pixels).
- Definitions verified on the data: round phases from freezetime end, sides from round winners (majority
switch at round 13: 98.99 %), one first kill per round, Operator holders from the freezetime-end inventory plus
kills that prove a holder (
kill_inferred). - Aggregates: heat grids keep only cells with ≥ 2 events, DBSCAN clusters, per-round rates; 143 teams, ~31 MB of JSON, no raw rows.
- Reports: deterministic fact sheet (≤ 150 facts) →
claude-sonnet-5-5with structured JSON output → number validator → one retry → cache. - Web: Next.js static export, TypeScript, Tailwind, shadcn/ui, canvas 2D minimap, URL state, keyboard navigation for clusters, print layout for the report.
- Tooling: WebStorm 2026.3 with Junie (Junie built the report's "Export PDF" feature). Development was assisted by Claude Code (logged in
docs/ai-workflow-log.md).
Challenges we ran into
- The minimap axes are swapped. The naive transform put plants off-site; we proved the swapped formula with plant positions, site pixels and callout distances.
- No Operator purchase or pickup events. We derived holders from inventory snapshots and inferred holders from Operator kills: 423 inferred stints, and now all 8,667 Operator kills are attributed to a holder (505 were not before the fix).
- LLMs invent numbers. We built a validator that rejects any number not matching a cited fact, plus number words and multipliers it cannot check.
- Licensing. The data cannot be redistributed, so all derived files are git-ignored and blocked by a pre-commit hook; we asked the organizers before hosting the aggregates, and they confirmed it is permitted.
Accomplishments that we're proud of
- A spatial "fingerprint" per team, not another stat table: utility caster spots and Operator angles per side and phase.
- 20 scouting reports in which every number in a claim is validated against cited facts;
report --checkfinds 0 problems in the Cloud9 reports. - Rules checked against the data instead of assumed (sides, overtime, first kills, calibration).
- 53 automated tests; the full pipeline rebuilds in about 6 minutes on a laptop.
What we learned
- Verify every game rule on the data: side switching in overtime and GRID reversals were only visible there.
- Constrain the model rather than trust it: cited fact ids plus a number validator turned a fluent report into a checkable one.
- Normalise per round before comparing teams; raw counts mostly measure how many games a team played.
What's next
- Estimate utility landing spots from caster position and aim direction.
- Matchup reports: counters for team A against team B specifically.
- Fingerprint trends across tournament stages.
- A semantic check on report wording (side/map consistency) on top of the number check.
Built With
- anthropic-api
- canvas
- claude
- claude-code
- grid
- junie
- next.js
- parquet
- polars
- python
- react
- scikit-learn
- shadcn-ui
- tailwindcss
- typescript
- uv
- valorant-api
- webstorm
- zstandard
