-
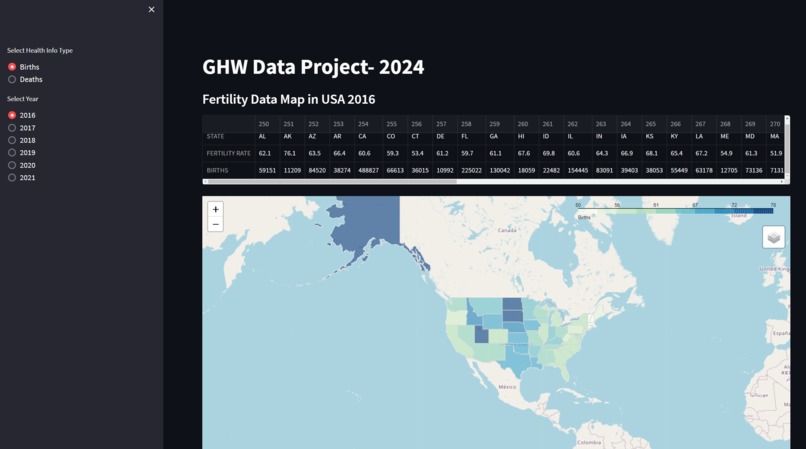
Map Visual of birth rates.

Inspiration
I wanted to know and summarize what is happening within the US in regards to life.
What it does
It is an interactive map of the US that shows the fertility rates and deaths in the US from about 2018 to 2021
How we built it
I used folium, streamlit, choropleth to create the map. As well as gathered data from the cdc.
Challenges we ran into
Gathering the data and making sure it worked with program gave me a couple of hiccups. Other than that, giving the ability to a user to switch between years was challenging.
Accomplishments that we're proud of
The maps work as well as being able to add in the change in years and between the two different maps.
What we learned
I learned how to better work with the data as well as understood how choropleths work a bit better.
What's next for USA Birth and Death Data
Creating a new map to show the differences in population due to the difference between birth and death rate. As well as adding in data to show the top cause of death for the year.

Log in or sign up for Devpost to join the conversation.