-
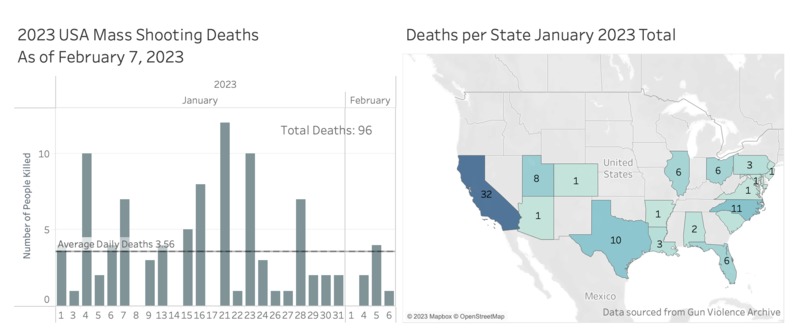
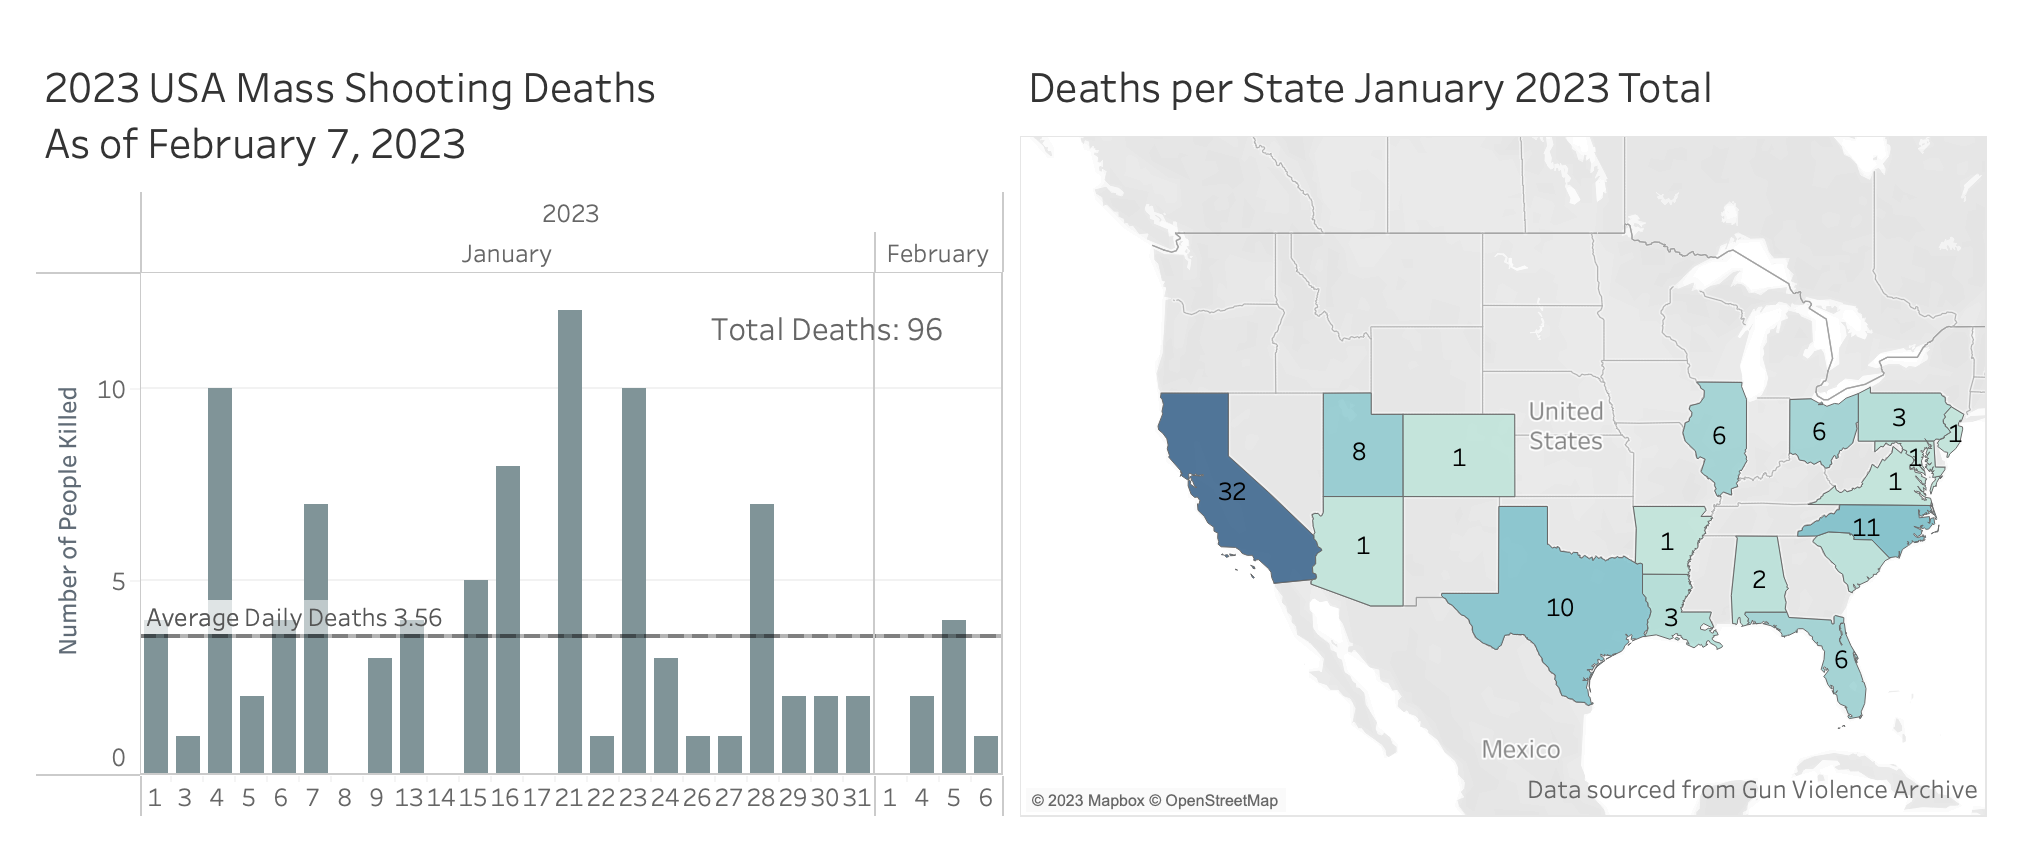
Deaths per state and deaths across the US
Inspiration
My daughter asked me the other day how many mass shooting deaths there had been this year because it already felt like so many for just being February. I saw this data viz opportunity and it was the first thing that came to mind.
What it does
It is my first attempt at using Tableau, so a basic set of data viz, one with a bar graph showing number of deaths per state as well as the average and grand total. Also a separate heat map that shows areas with more deaths per state as colored more darkly.
How we built it
I downloaded a CSV dataset from https://www.gunviolencearchive.org/reports/mass-shooting here. Downloaded Tableau Public and uploaded the CSV.
Drug around the various parameters until I figured out what did what, found the "Show Me" button (lifesaver!) and the learned how to alter formatting and editing to create a Dashboard.
Challenges we ran into
Trying to figure out how to have a legend that showed the grand total of shooting deaths. Didn't figure out how to change all the colors around, mostly just the ones used for the heat map and bar chart. Would have liked to change the background to something dark.
Accomplishments that we're proud of
Not bad for 45 minutes and figuring out how to add the right columns and rows :) Udemy was quite helpful with a beginner class!
What we learned
Tableau is really intuitive once your realize you can pretty much drag and drop everything into where you'd like it to go/calculate with/further niche down etc.
What's next for US Mass Shooting Deaths 2023
This is a depressing topic and I don't plan on using this platform as my place for advocacy or change right now, but maybe in the future.
Built With
- gunviolencearchive.org
- tableau


Log in or sign up for Devpost to join the conversation.