-
-
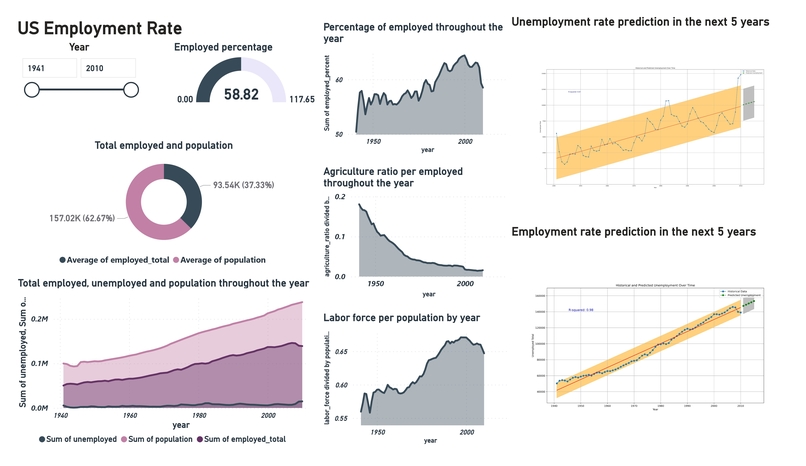
Power BI- US Employment Rate Analysis Dashboard

US Employment Data Analysis
Welcome to the US Employment Data Analysis project! This project delves into the realm of employment data using the Employment in the U.S. dataset. Our goal is to explore historical employment trends, create predictive models, craft compelling visualizations, and offer insights into the world of employment statistics.
Note: This project has been created for the Youth Data Hackathon on DevPost, a platform for innovative data solutions.
Data Source
Our dataset originates from datahub.io, serving as a valuable source of information on employment, unemployment, population, labor force, and more.
Data Description
The dataset contains several columns, each providing essential employment-related information:
year: The recorded year.population: The total population.labor_force: The labor force size.population_percent: The percentage of the population.employed_total: The count of employed individuals.employed_percent: The percentage of the employed population.agriculture_ratio: The ratio of individuals employed in agriculture.nonagriculture_ratio: The ratio of individuals employed in non-agriculture sectors.unemployed: The number of unemployed individuals.unemployed_percent: The percentage of the unemployed population.not_in_labor: The count of individuals not in the labor force.footnotes: Additional explanatory notes.
Highlights of Our Analysis
Employment Trends
- Examining historical employment trends reveals a steady increase in total employment in the US, closely aligned with population growth.
- Despite this general trend, we observed instances where the growth in employment did not match the population increase, with noticeable declines in employment around the year 2010.
Force Labor Composition
- Our analysis highlights the shift in labor force composition over time. The percentage of individuals employed in agriculture has significantly decreased, while non-agricultural employment has risen.
Predictive Models
- We developed predictive models for employed and unemployed populations. Our models offer forecasts and confidence intervals, allowing us to identify periods beyond these bounds, which indicate recession periods.
Pre and Post-Recession Analysis
- We analyzed employment and unemployment patterns during recession periods in the US, focusing on the 1981-1982 and 2008-2009 economic downturns. We observed significant changes in these periods, emphasizing the importance of understanding economic cycles.
Power BI Visualization
- We will be using Power BI to create interactive and insightful visualizations to enhance our understanding of the employment data.
System Requirements
To ensure a smooth project experience, please ensure the following software packages are installed on your system:
- Python (Python 3.x recommended)
- NumPy
- pandas
- scikit-learn
- matplotlib
Contribute
While this project is primarily the creation of JinnOppa and kecebongalau, we welcome ideas for enhancements, additional analyses, and other improvements. If you have any suggestions, please reach out to:
- Eugene Winata at [[email protected]]
- Emilio Garvin at [[email protected]]
We're eager to collaborate with you!
License
This project operates under the MIT License and is open-source.
Get in Touch
For questions, inquiries, or assistance, don't hesitate to contact either JinnOppa or our partner kecebongalau. We're here to assist you.
Join us on this journey of exploring US employment data and uncovering valuable insights. We hope you enjoy this project!


Log in or sign up for Devpost to join the conversation.