Inspiration
As a student in the US, I wanted to explore US educational finances for a financial hack!
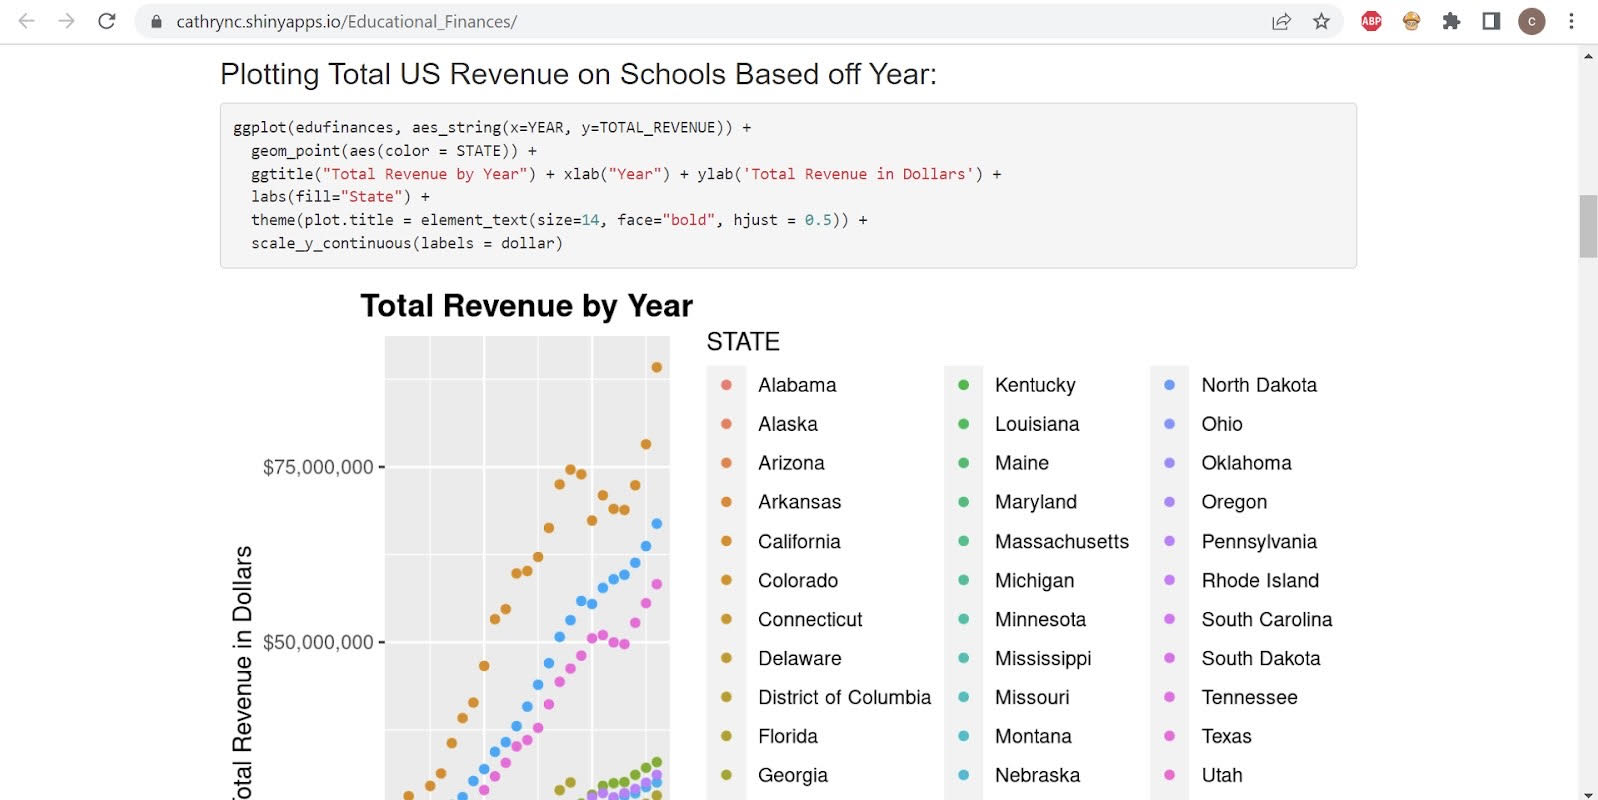
What it does
Data visualization of US Educational Finances specifically expenditure and revenue.
How we built it
Used US Educational Finances dataset from Kaggle and built with R. Deployed with Shiny.
What we learned
Became more familiar with data science in R.
What's next for US Educational Finances Data Exploration
Creating more plots and trying different regressions.

Log in or sign up for Devpost to join the conversation.