-
-

Covid19 Infection Insights Dashboard
-

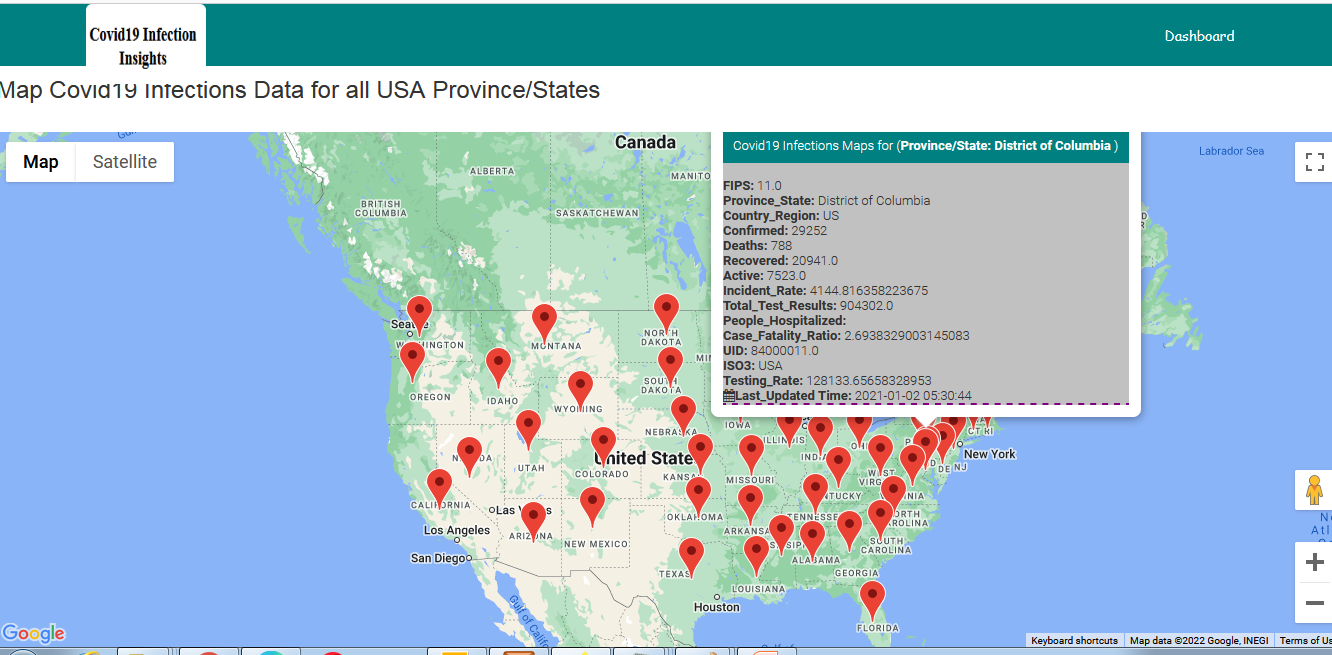
Map of Covid19 Infections Data for all USA Province or States
-
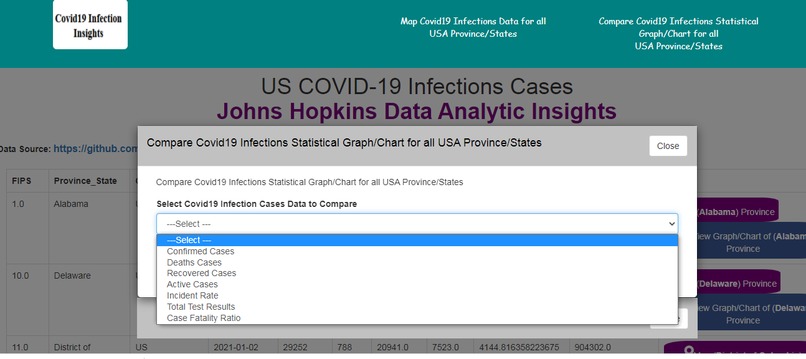
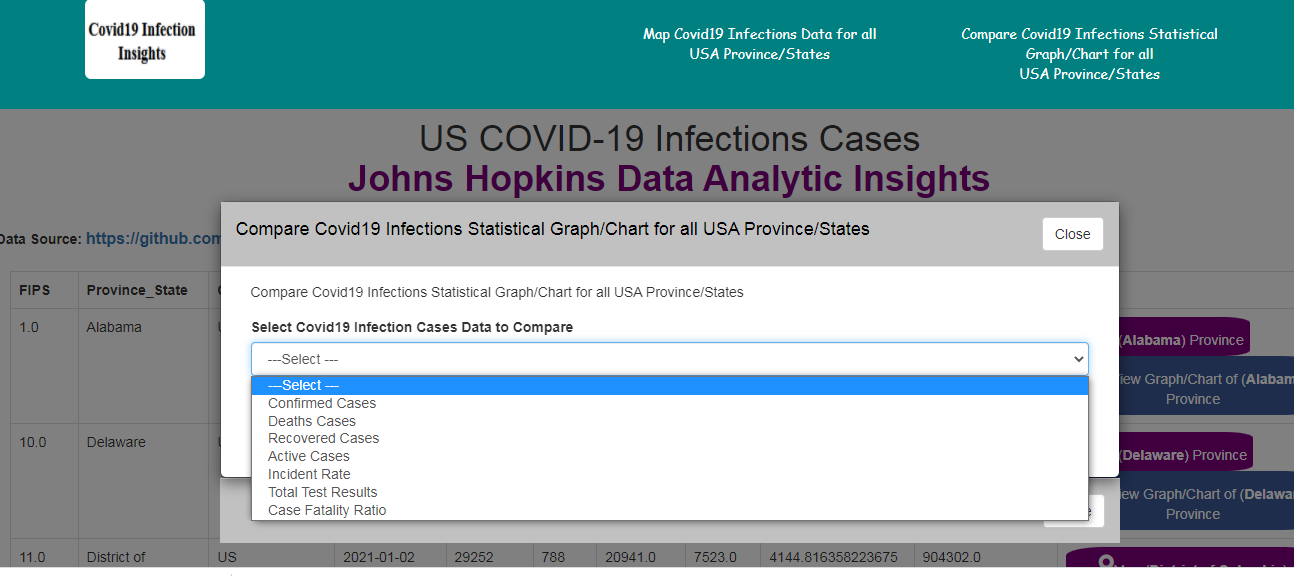
Covid19 Infections Cases Statistical analytical Comparism for all USA Province or States
-
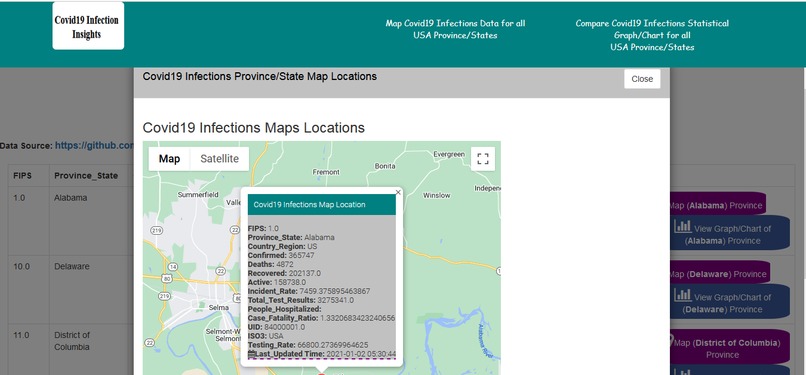
Covid19 Infection Data Google Mapping for a Single Province
-

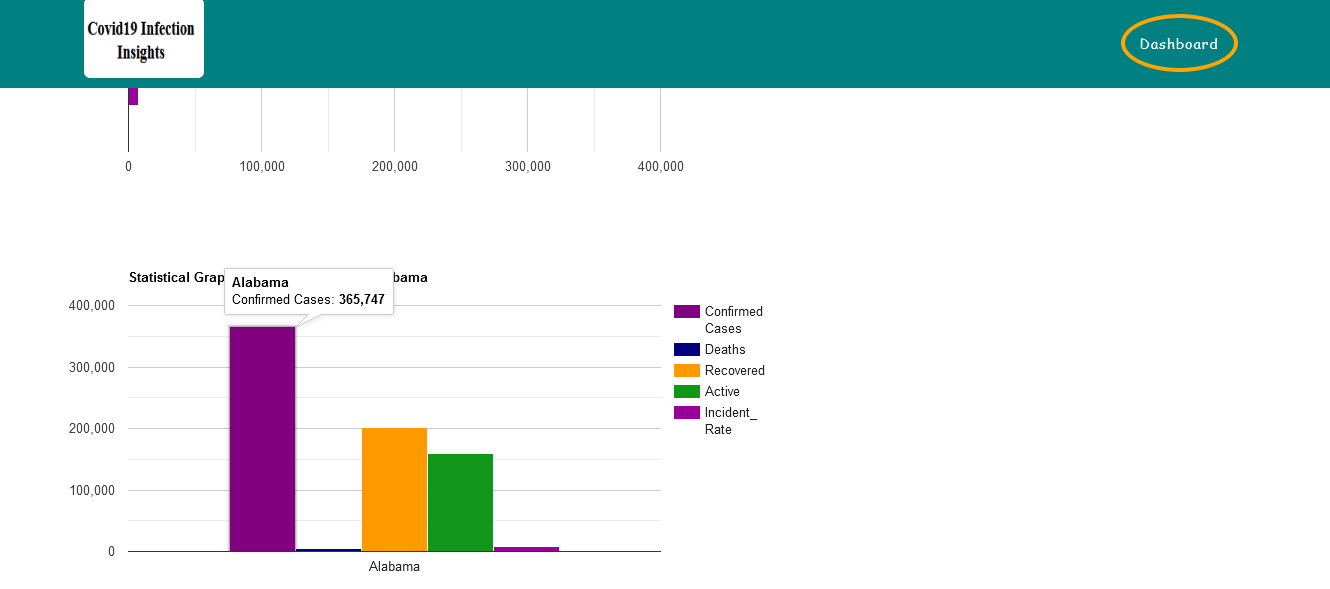
Covid19 Infection Data Graph and Chart Analytic Insights for a Single Province orState in US
-
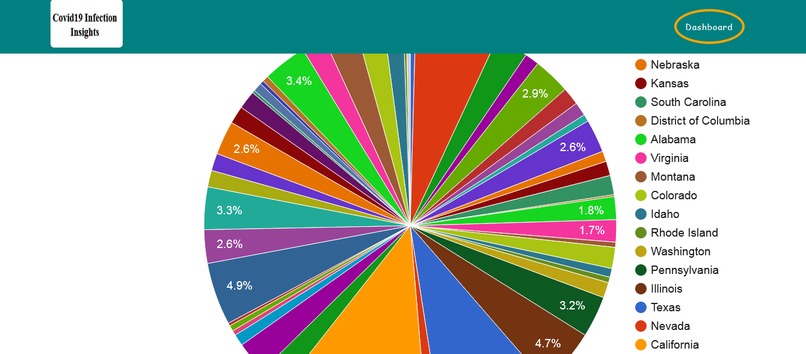
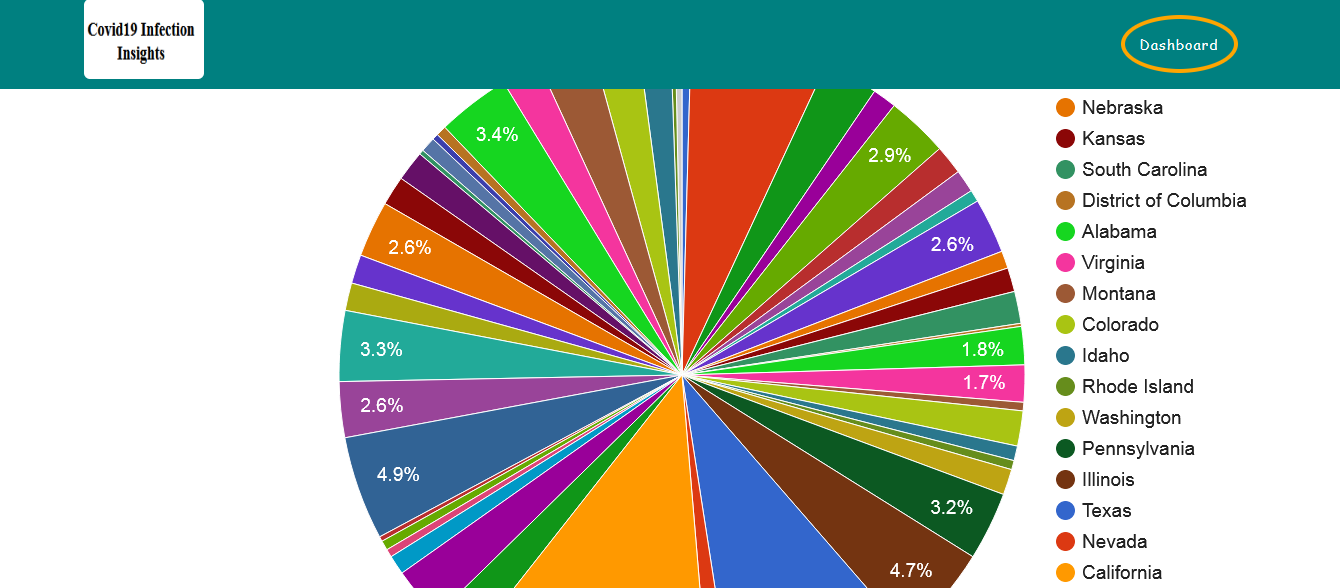
Pie Charts Statistical Graphs Comparism of Covid-19 Cases for all US Provinces or States
-

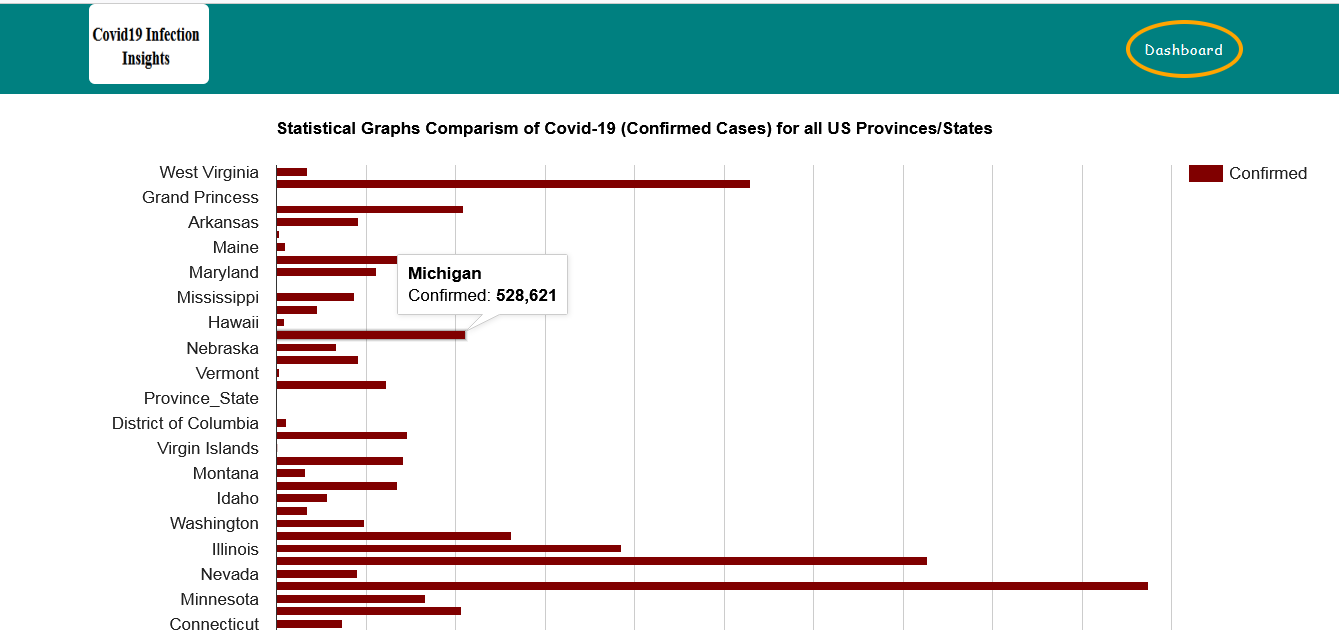
Statistical Graphs Comparism of Covid-19 Cases for all US Provinces or States
-

Tigergraph Database Vertex
-

Tigergraph Database Vertex

Inspiration
Analyzing datasets of previous Covid19 Infection cases can be used to predict and provides insights into the Next Wave of Covid powered by Tigergraph Database, Google Location Mapping and Google Statistical/Graph Charts Visualizations and distribution analysis.
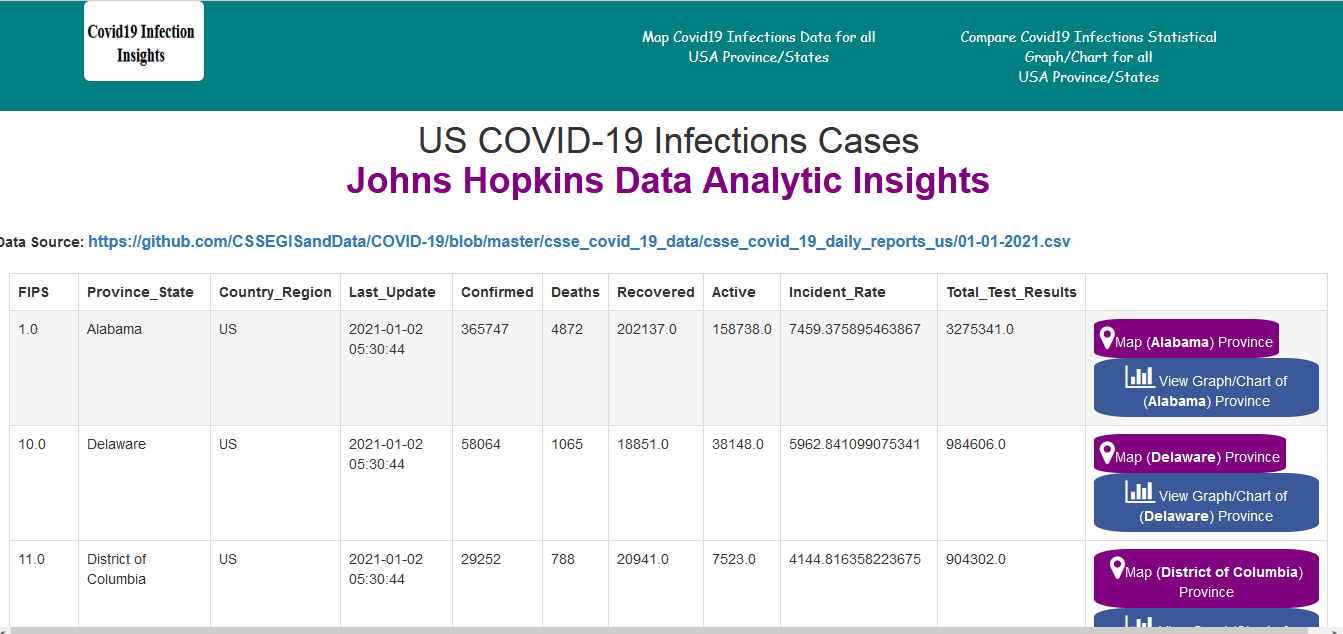
In this application, We leverage Johns Hopkins US Covid-19 Infection Cases Datasets to provide Researchers, Lab Technicians etc. more insights into Covid-19 infection Cases within the 50 States of United State of America.
Dataset Source:
https://github.com/CSSEGISandData/COVID-19/blob/master/csse_covid_19_data/csse_covid_19_daily_reports_us/01-01-2021.csv
What it does
1.) With the above Johns Hopkins US Covid-19 Infection Datasets in csv Files powered by Tigergraph Database Analytics, Reasearchers, Lab Technologist, Data Scientist etc. could be able to predict the Province/State with the highest or Lowest Covid-19 Cases, what causes the increase or decline in the infections.
The application leverages Johns Hopkins US Covid-19 Infection Datasets imported into Tigergraph Database to predict and infer various Province/States in US for their respective number of recorded:
1.) Confirmed Cases.
2.) Deaths Cases..
3.) Recovered Cases..
4.) Active..
5.) Incident Rate..
6.) Total Test Results..
7.) People Hospitalized..
8.) Case Fatality Ratio..
9.) Testing Rate..
10.) Hospitalization Rate..
2.) The Application Leverages various latitudes and Longitudes in the John Hopkins US Covid-19 Infections Datasets for various Provinces/States in 50 States of United State to map Covid-19 infection cases for each US Province/State on Google Map for easy Covid-19 infection data access.
3.) The Application Leverages Google Statistical/Graph Charts to analyze and Compare various Johns Hopkins US Covid-19 Infection Datasets for various Provinces/States within 50 States of United State for Covid-19 infection cases visualizations and Data Charts distributions analysis.
Power-points Presentation
Power-points presentation of the application can be downloaded with the link below
https://fredjarsoft.com/tigergraph_powerpoints/Covid19-Insights.pptx
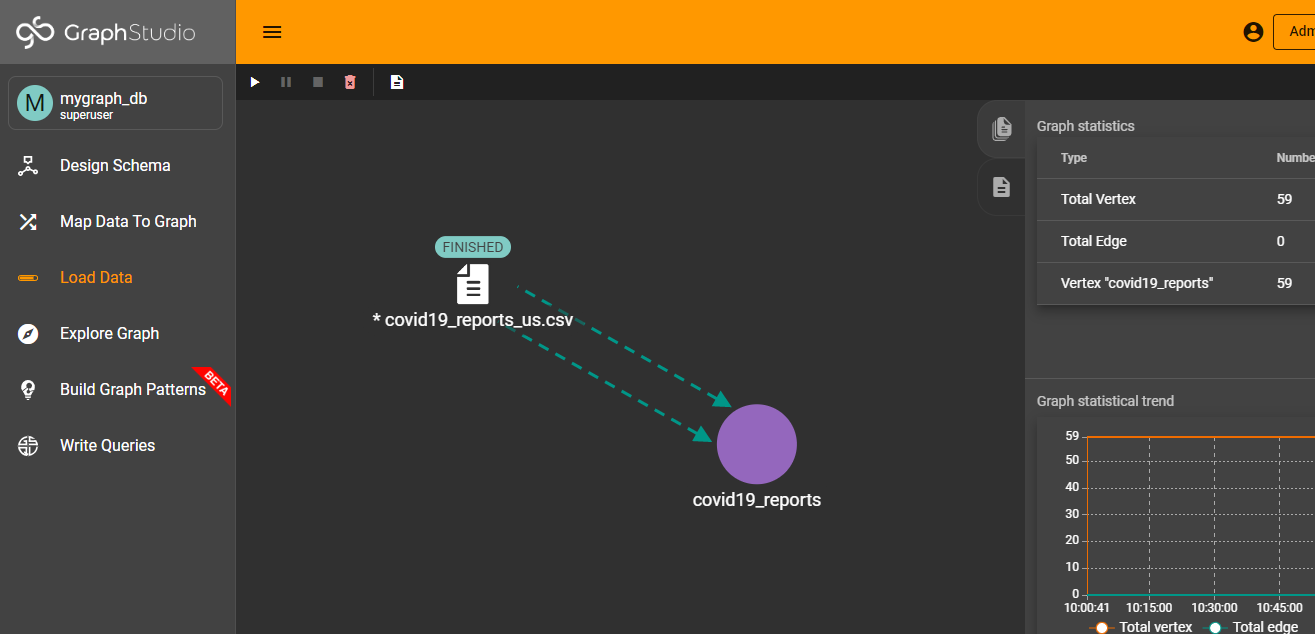
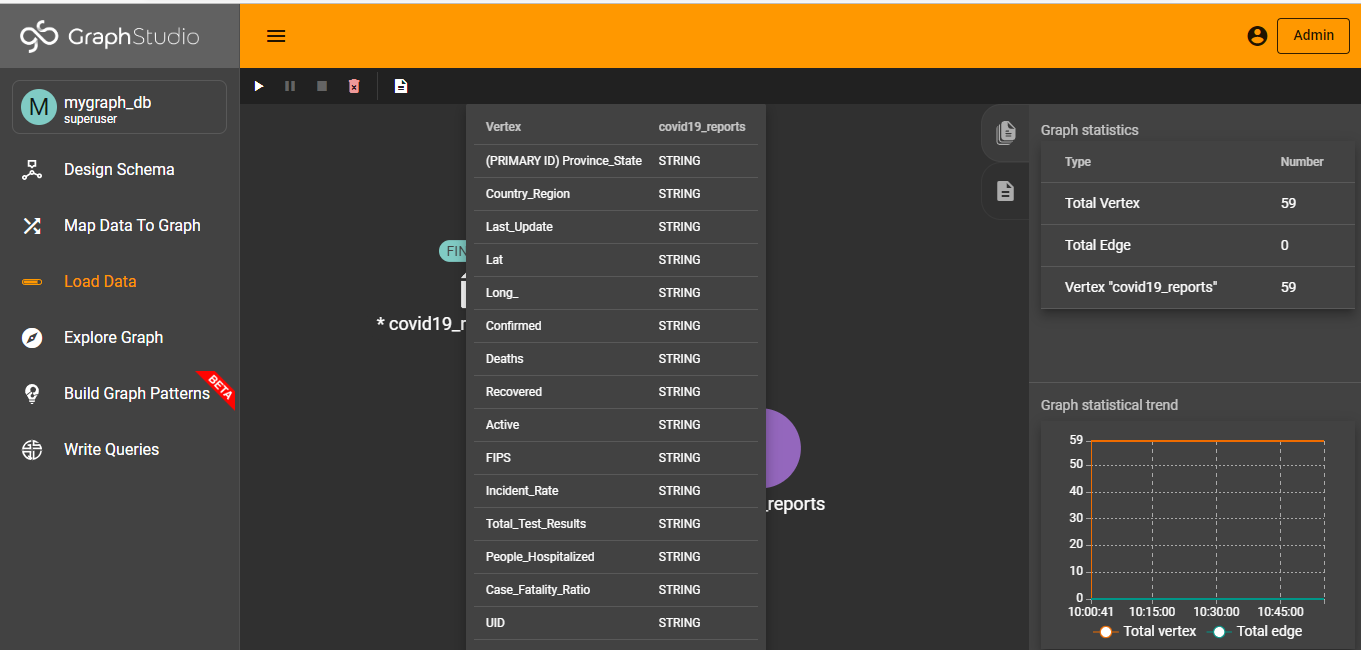
Tigergraph Databse Vertex Created
To build this application, We created 1 Tigergraph Vertex with varying data types
1.) Covid19_reports: This Vertex stores imported John Hopkins US Covid-19 Infection Cases Datasets for data manipulations and queries on the application web interface.
Tiger Restful API Used
To build this application, We used various Tigergraph Restful API and Curl Request via PHP.
https://docs.tigergraph.com/tigergraph-server/current/api/
https://docs.tigergraph.com/tigergraph-server/current/api/built-in-endpoints
Restful API used includes:
1.) Insert/Upsert Restful API: This API is used to insert Data into Tigergraph Vertex.
2.) Updates Restful API: This API is used to Update Data into Tigergraph Vertex..
3.) Delete Restful API : This API is used to delete data to and from Tigergraph Vertex...
4.) Query Restful API: This API is used to query and select data to and from Tigergraph Vertex...
5.) Filter & Sorting Restful API: This API is used to filter and select data to and from Tigergraph Vertex... And many more.
How we built it
This application was built using Tigergraph Database, PHP, Curl, Ajax, Jquery,Google address Geo-coding API, Google Address Reverse Geo-coding API, Google Map Javascript API and more..
What's next for US Covid-19 Infections Insights
coming soon

Log in or sign up for Devpost to join the conversation.