Inspiration: Working as a ramp agent sparked my interest in exploring air travel trends, such as fares, passenger volumes, and airline growth.
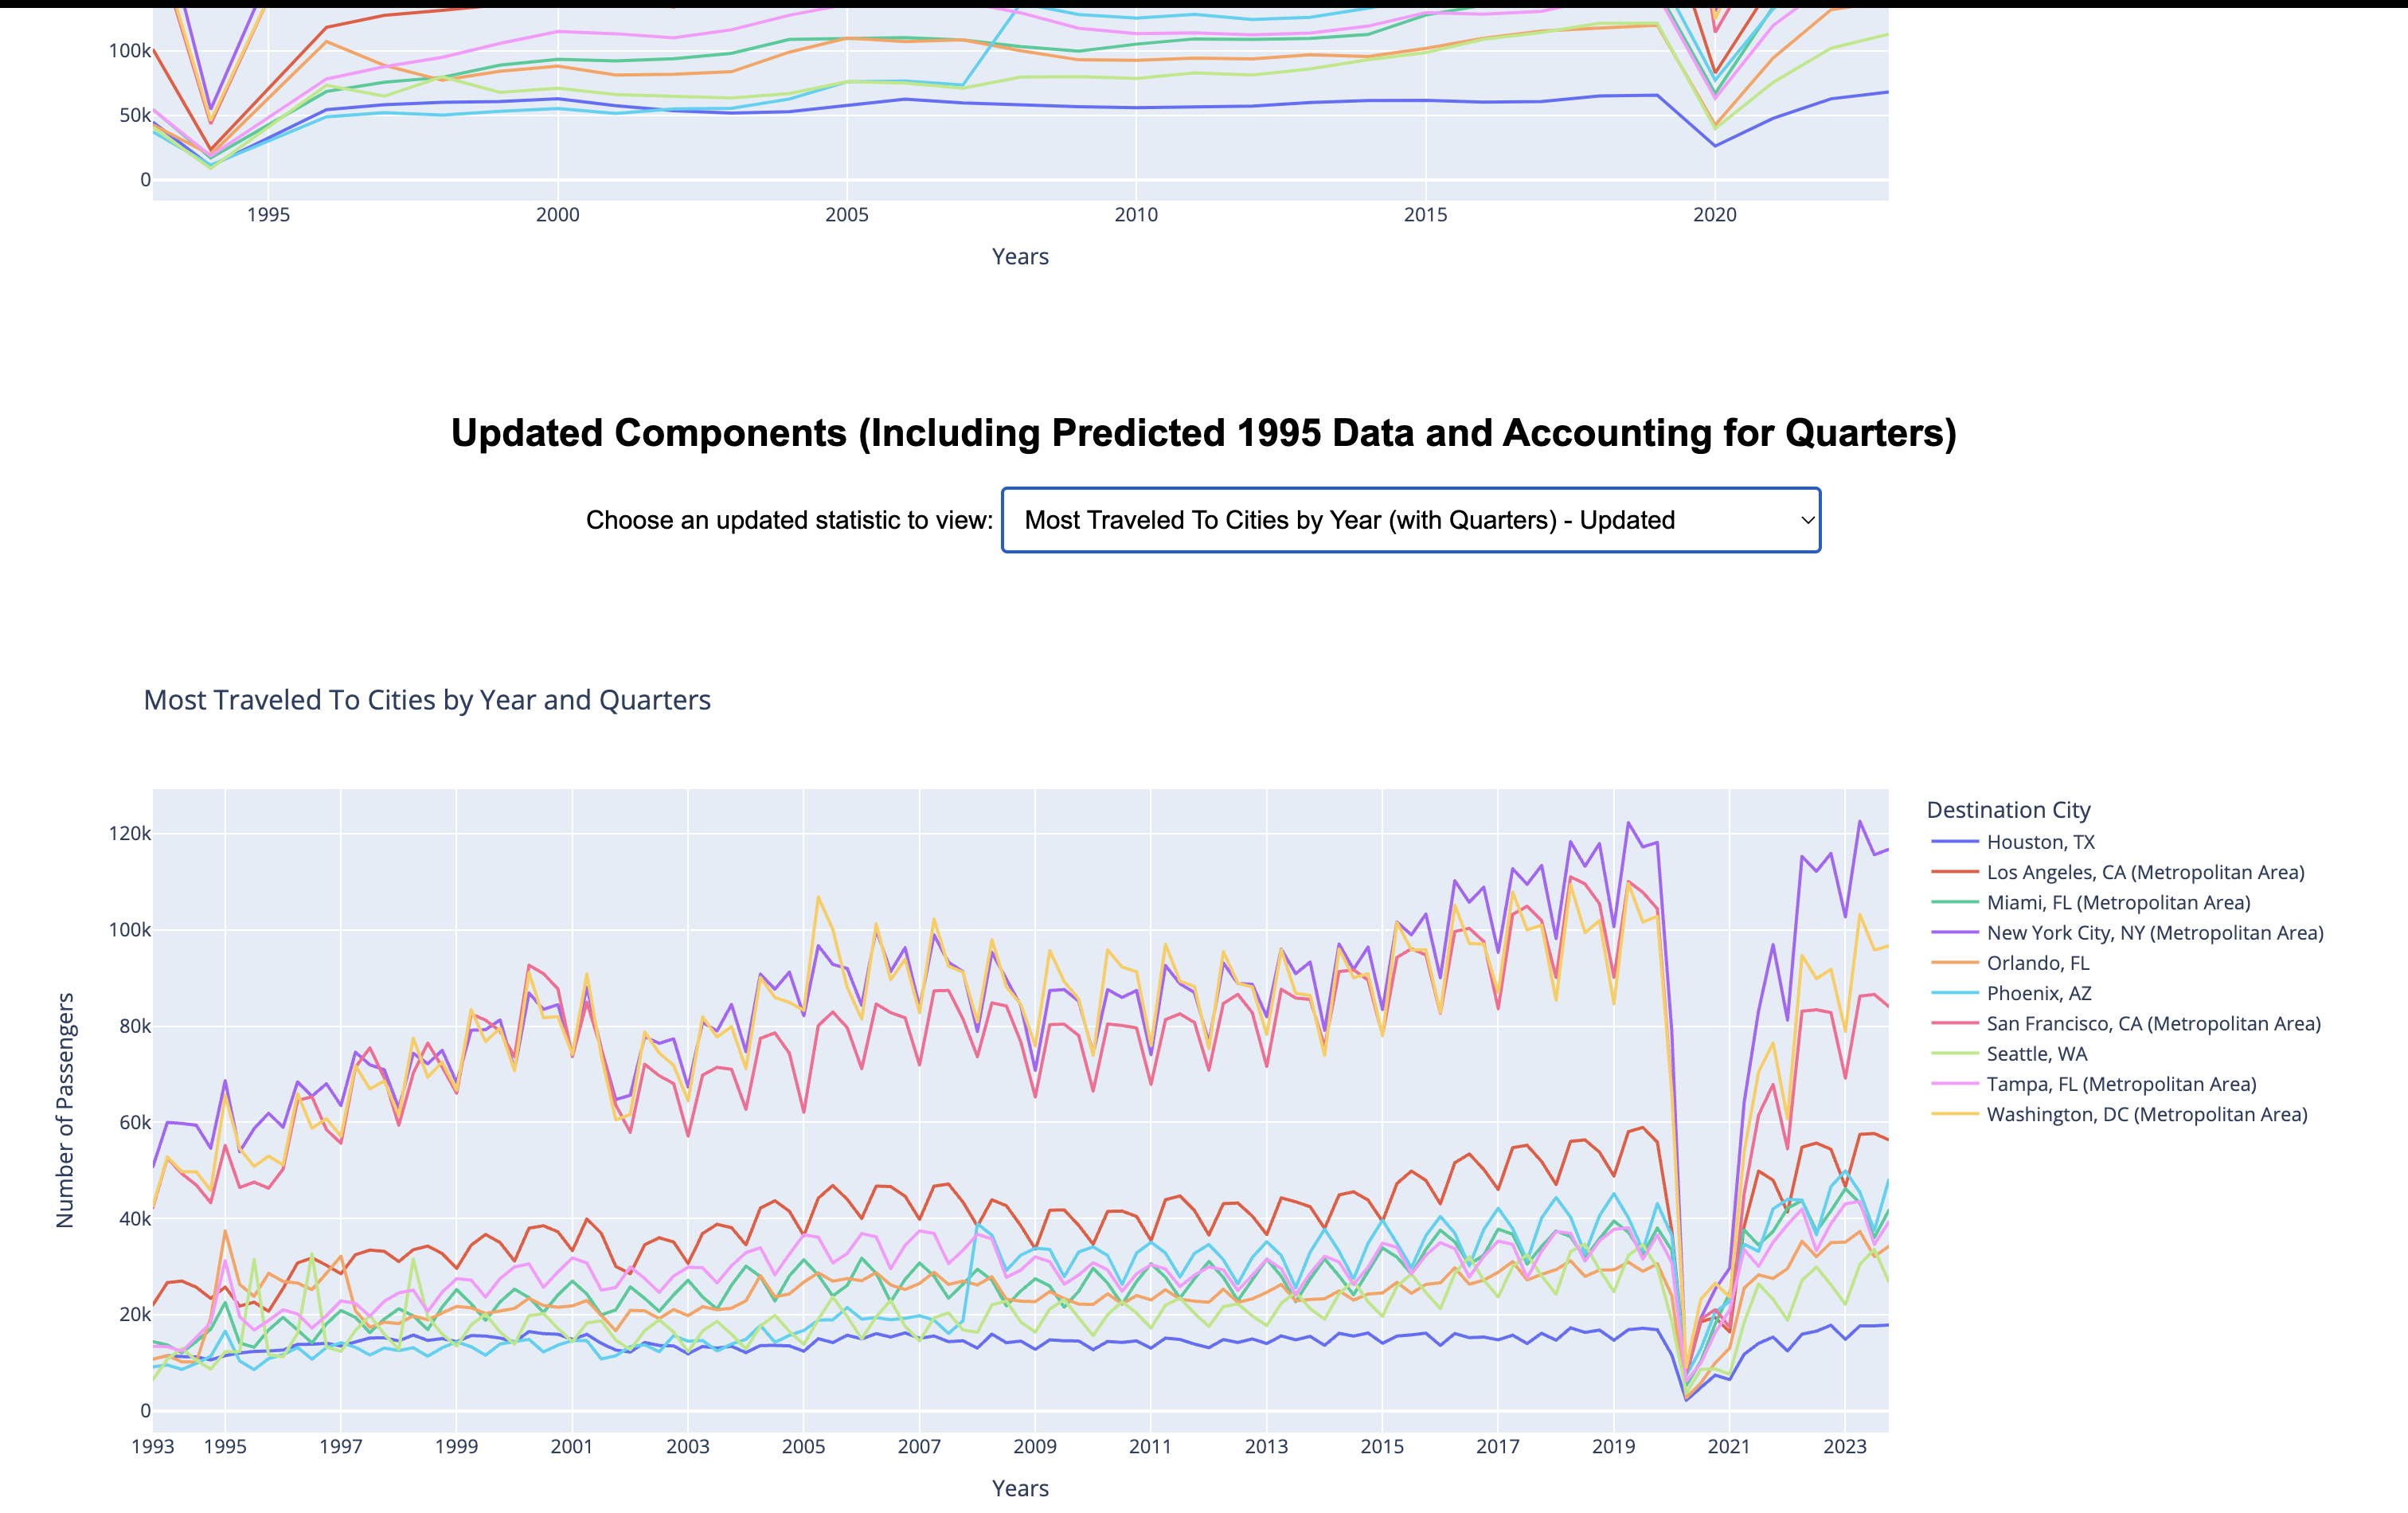
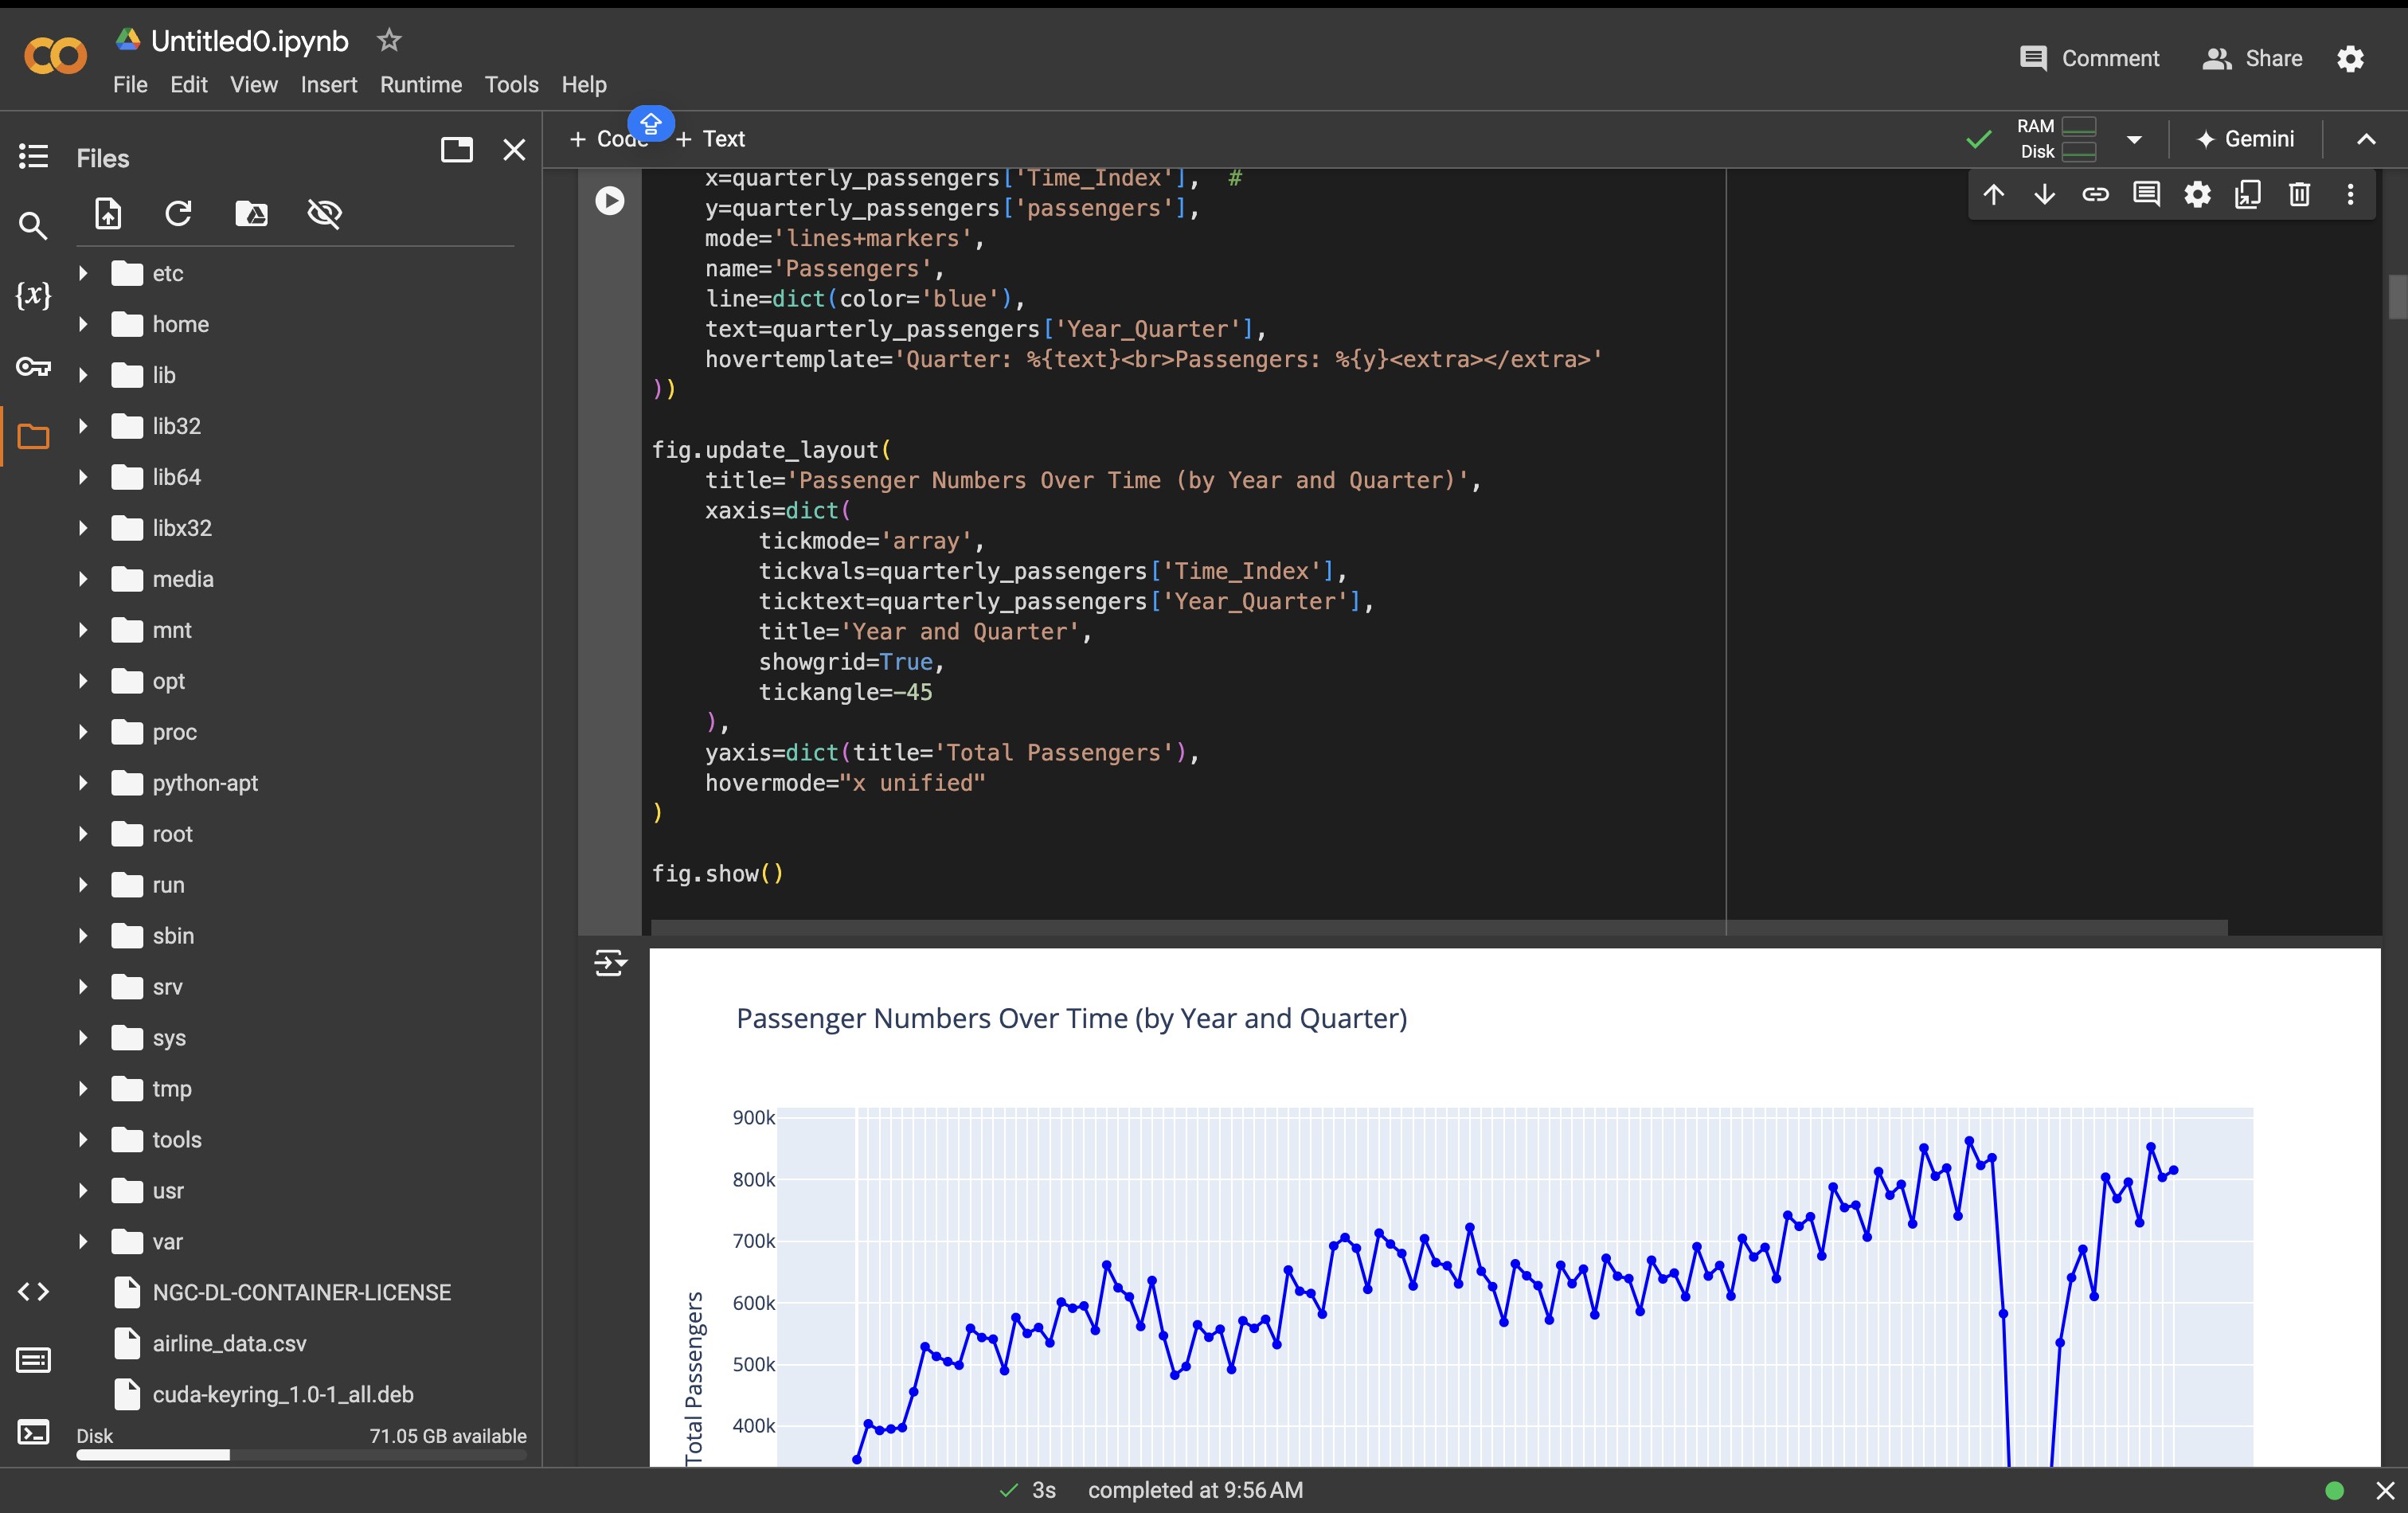
What it does: Our project provides a user-friendly, interactive website that visualizes airline data from 1993 to 2023. It predicts missing data, like the 1995 values, using statistical methods to ensure a complete dataset.
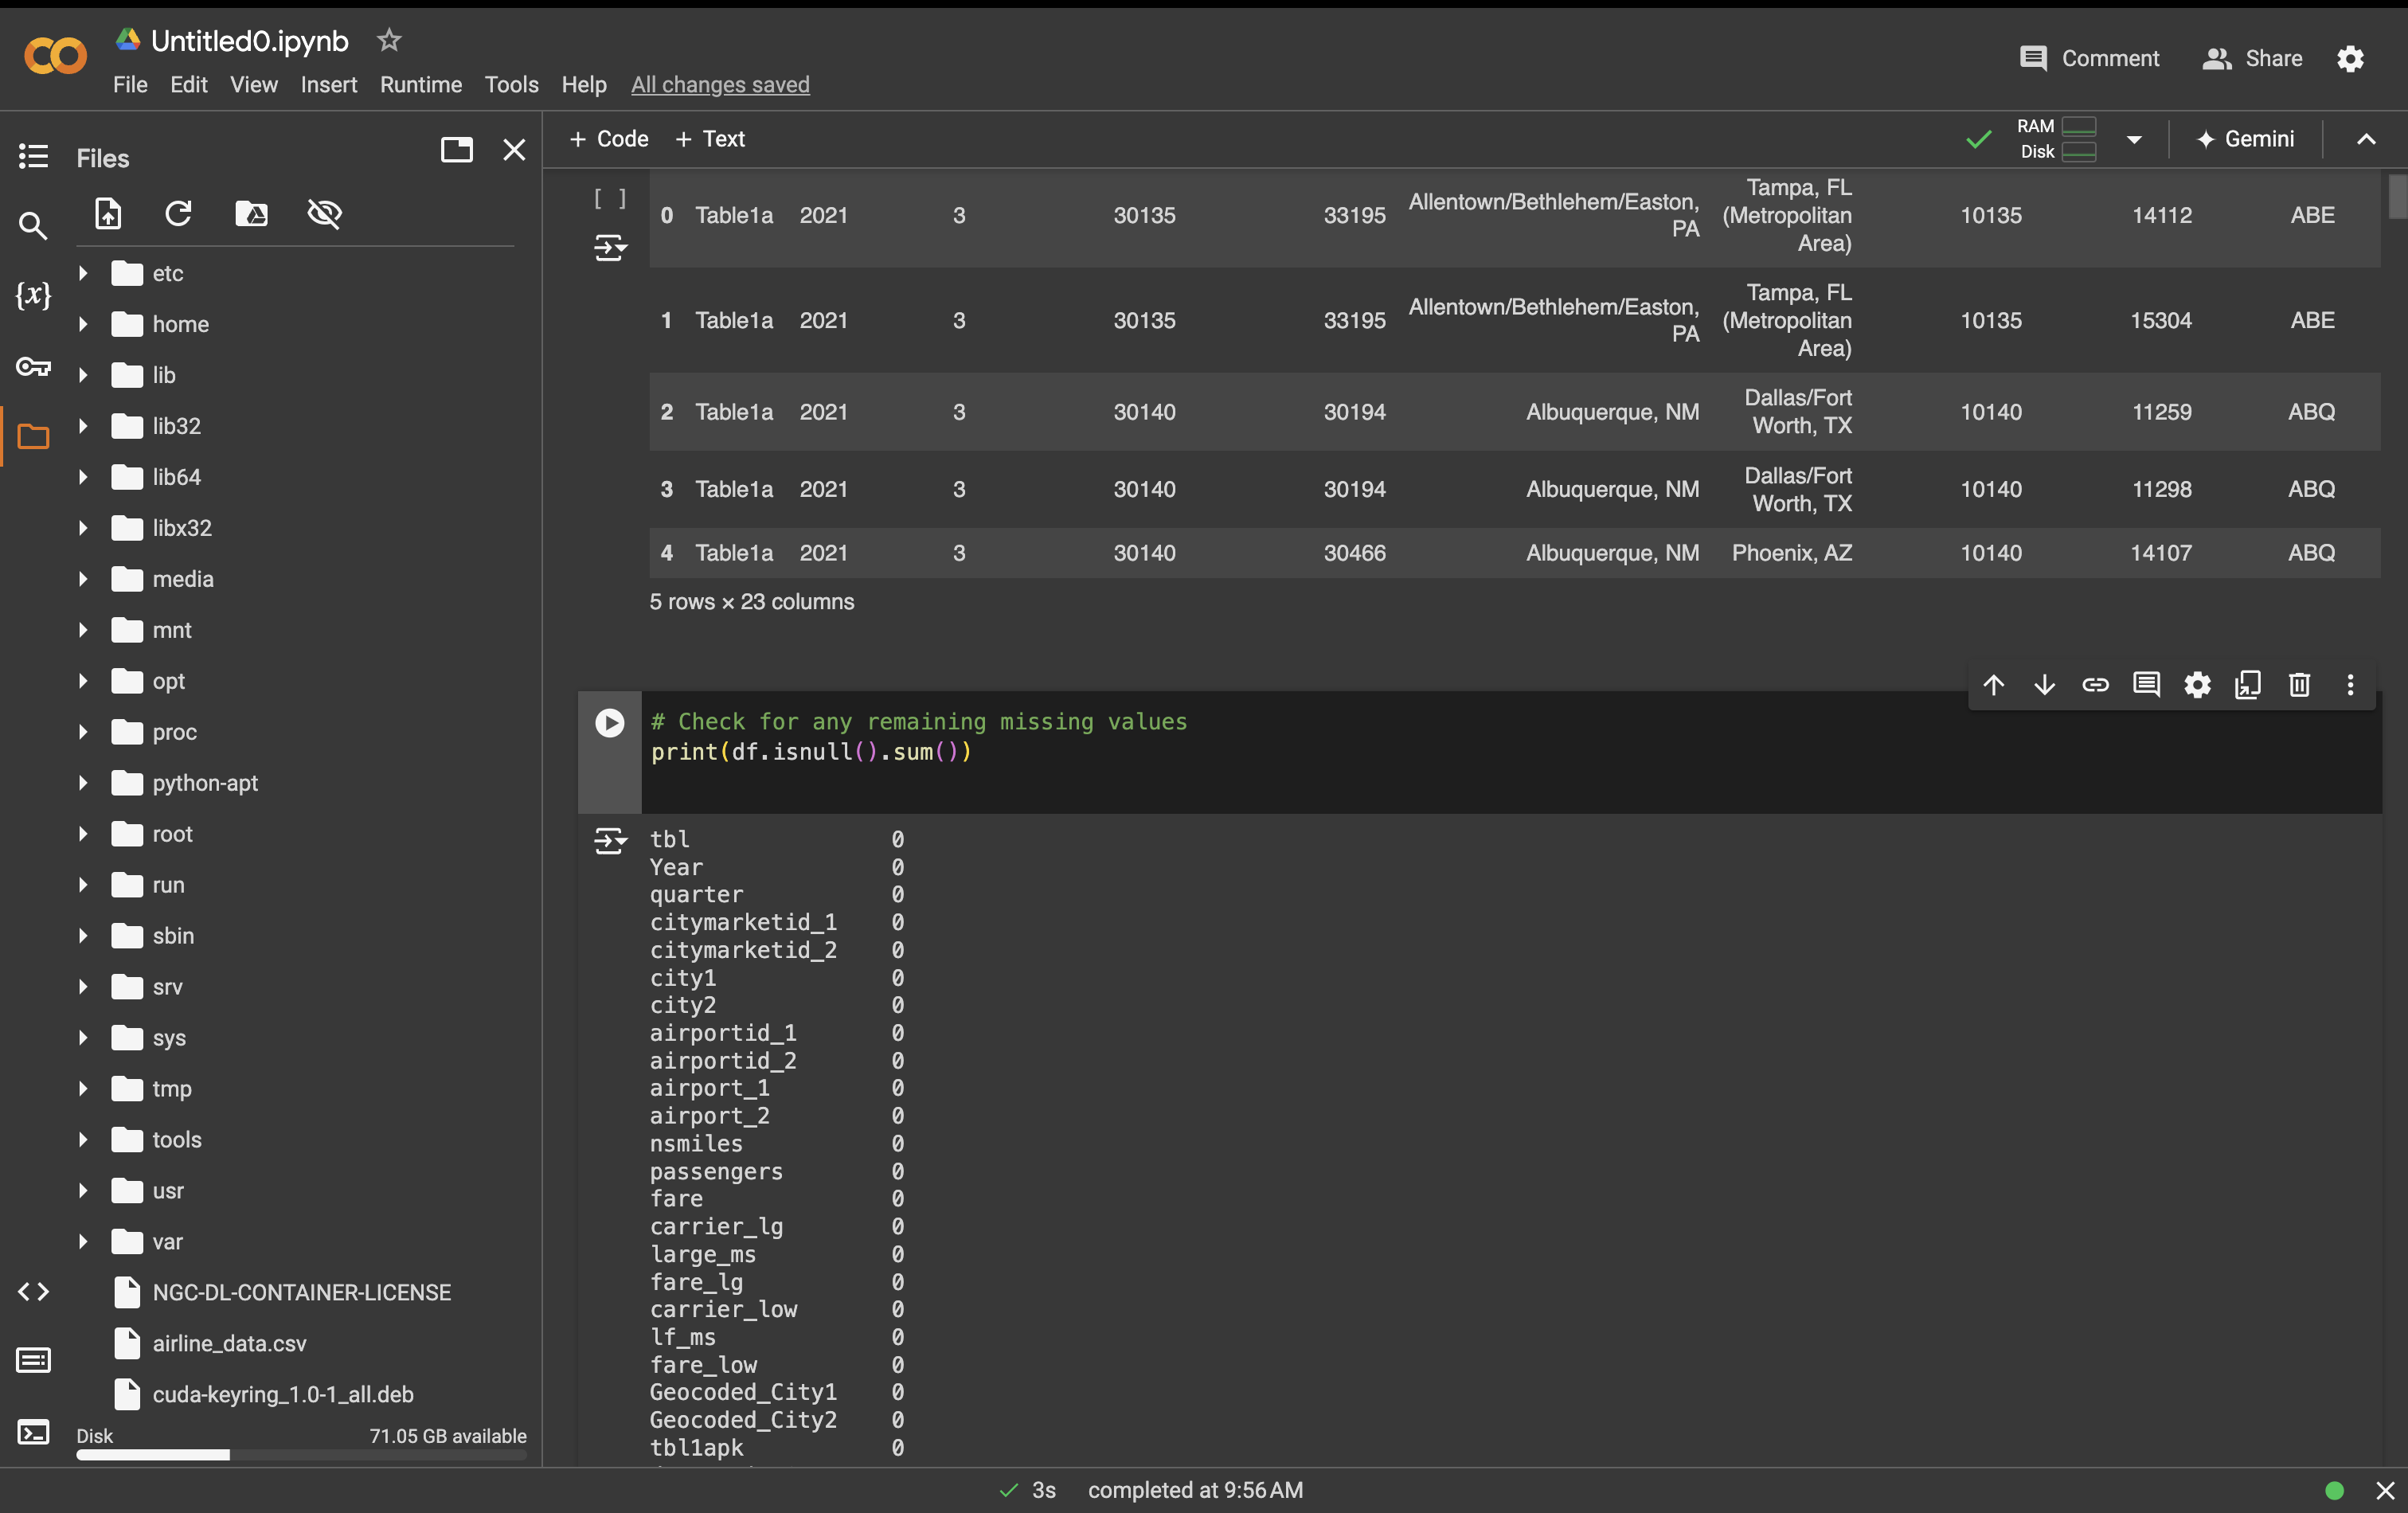
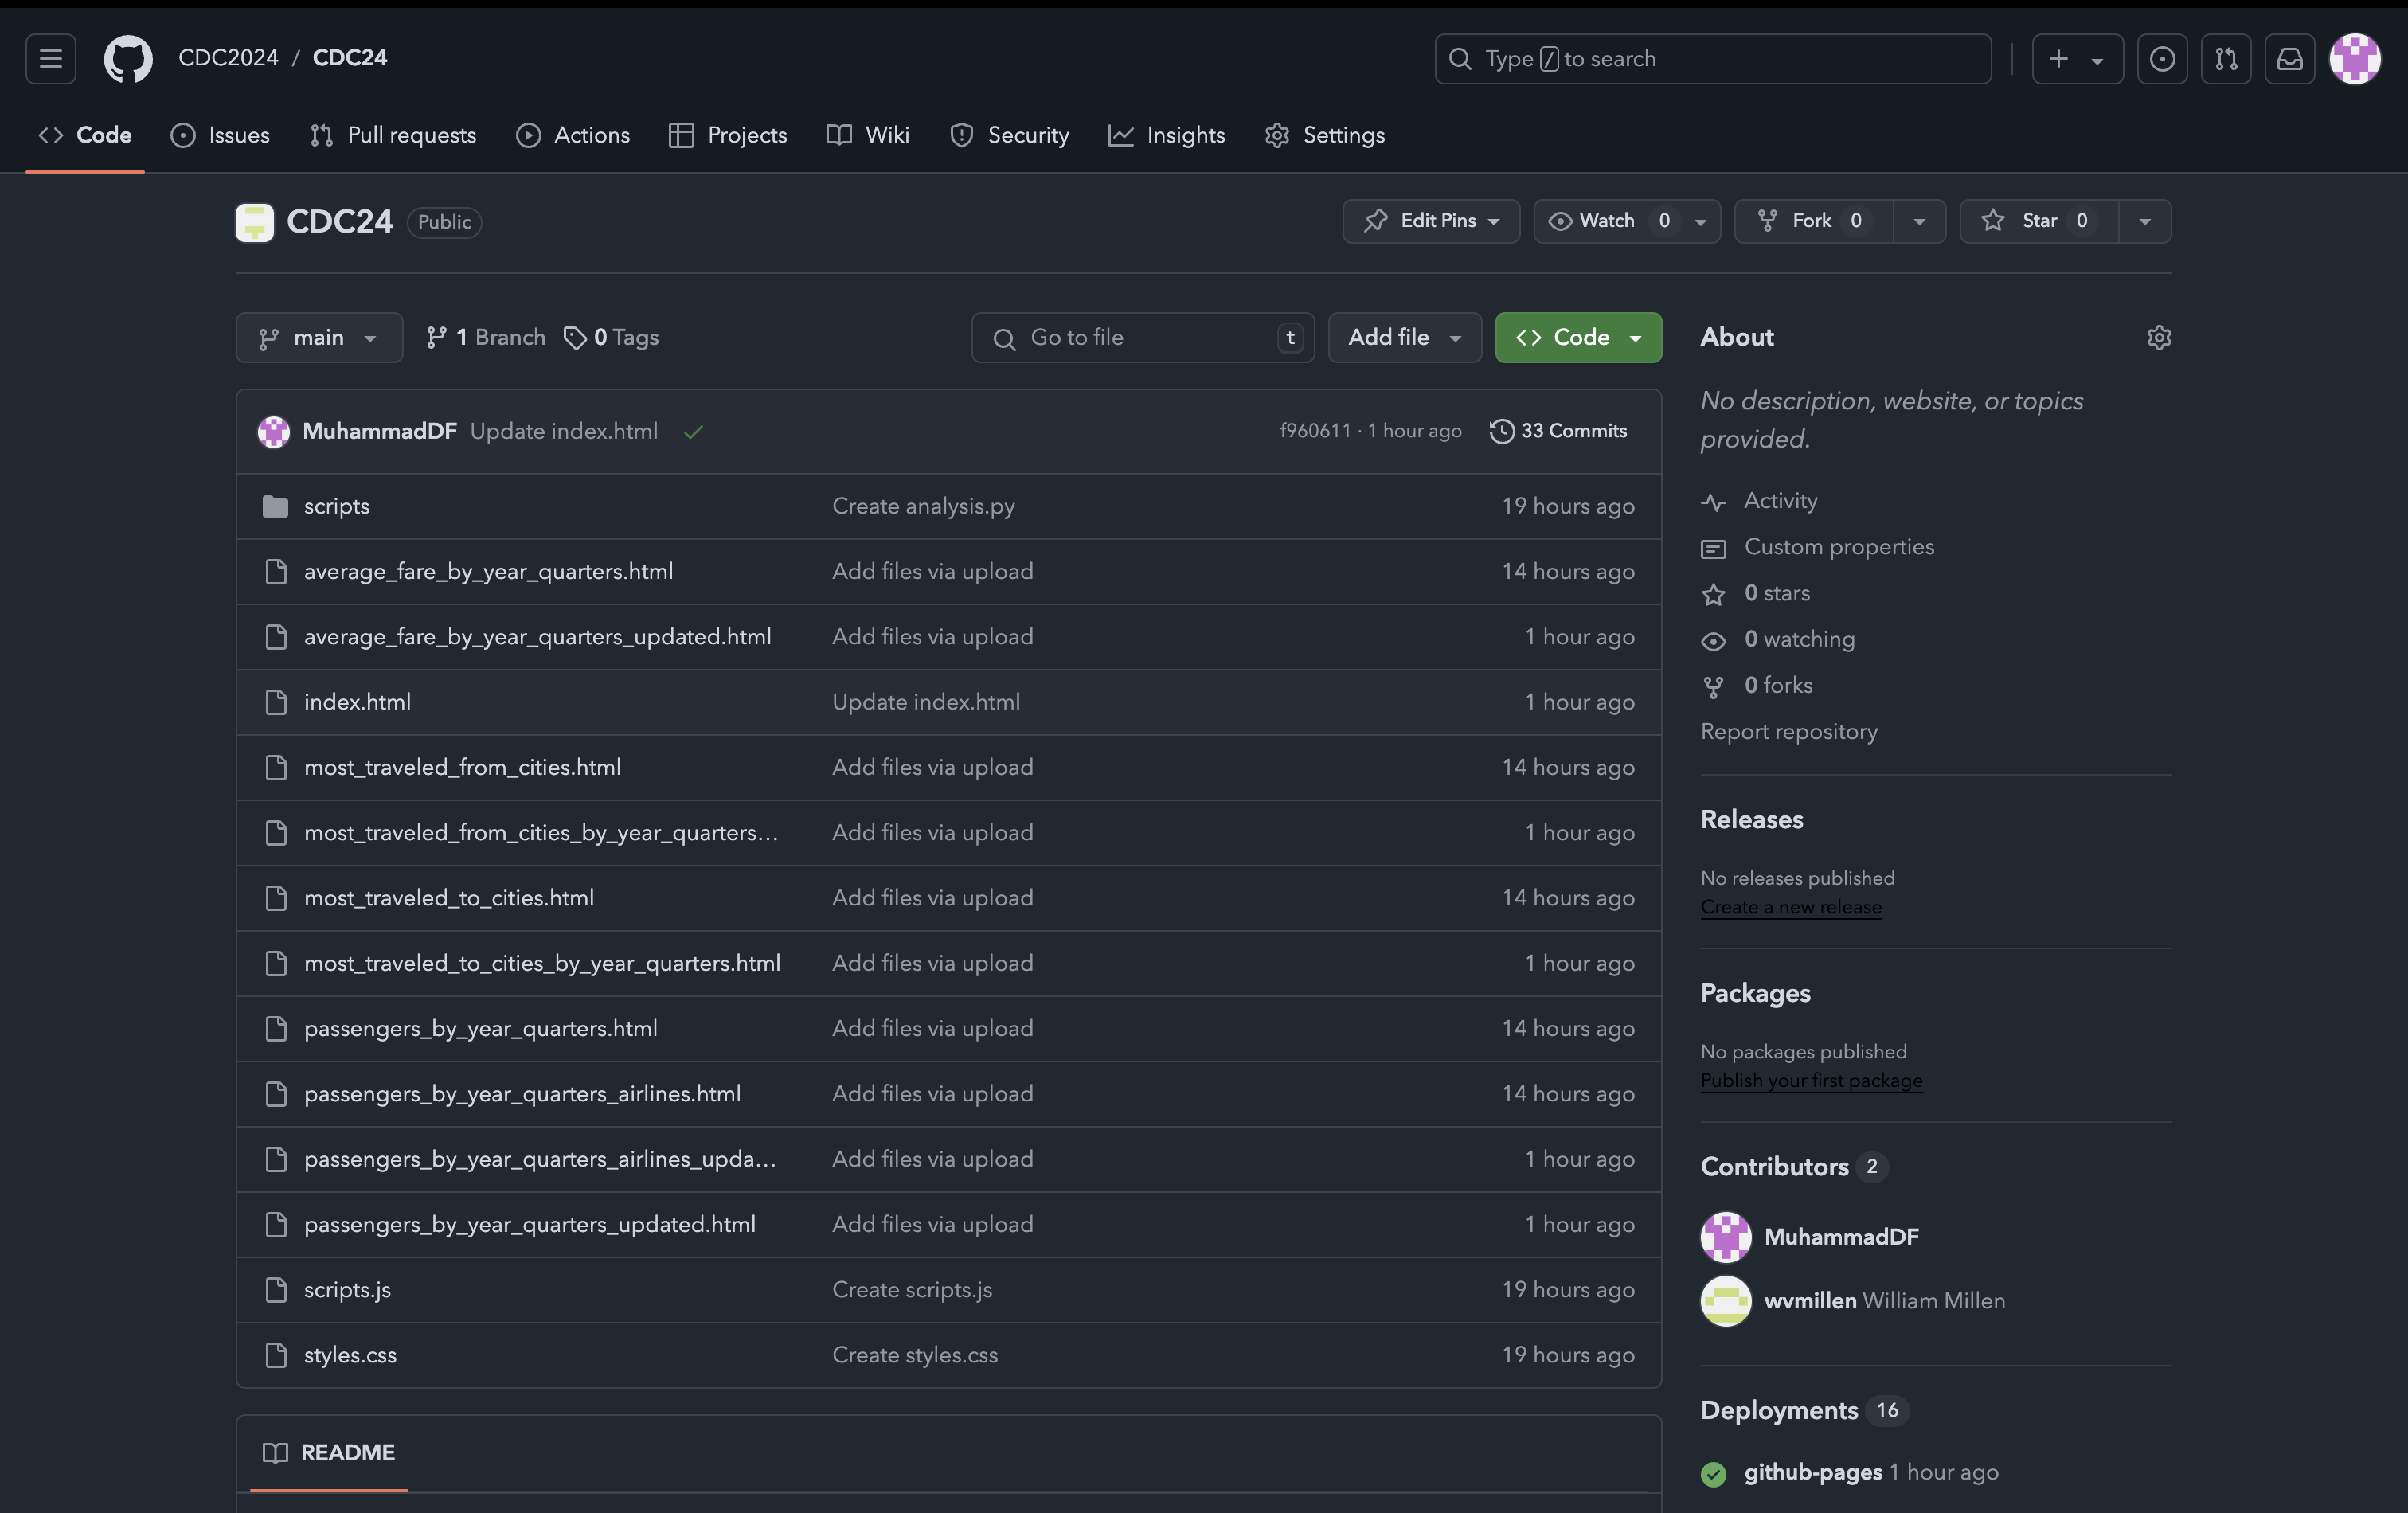
How we built it: We used Plotly for interactive visualizations and hosted the website on GitHub Pages. Data processing and predictions were done in Python, using techniques like rolling averages and interpolation.
Challenges we ran into: As beginners, we struggled to fully utilize all the tools we explored, including SAS Viya and Prophet, due to time constraints.
Accomplishments that we're proud of: We successfully created an interactive, data-driven website that fills missing data and provides valuable insights into airline trends.
What we learned: We learned how to clean data, make predictions, and present it interactively online. We also realized how vast and complex data science can be.
What's next for US Airline Flight Routes and Fares 1993-2024: We plan to improve predictive models, add more customization options, and expand insights into airline market trends.

Log in or sign up for Devpost to join the conversation.