
Inspiration
We've all seen a pothole or an overflowing trash bin and thought, "Someone should fix that!" The inspiration for UrbanWatch AI was to build an intelligent bridge between citizens who see problems and the city officials who can solve them in the most efficient way possible.
What it does
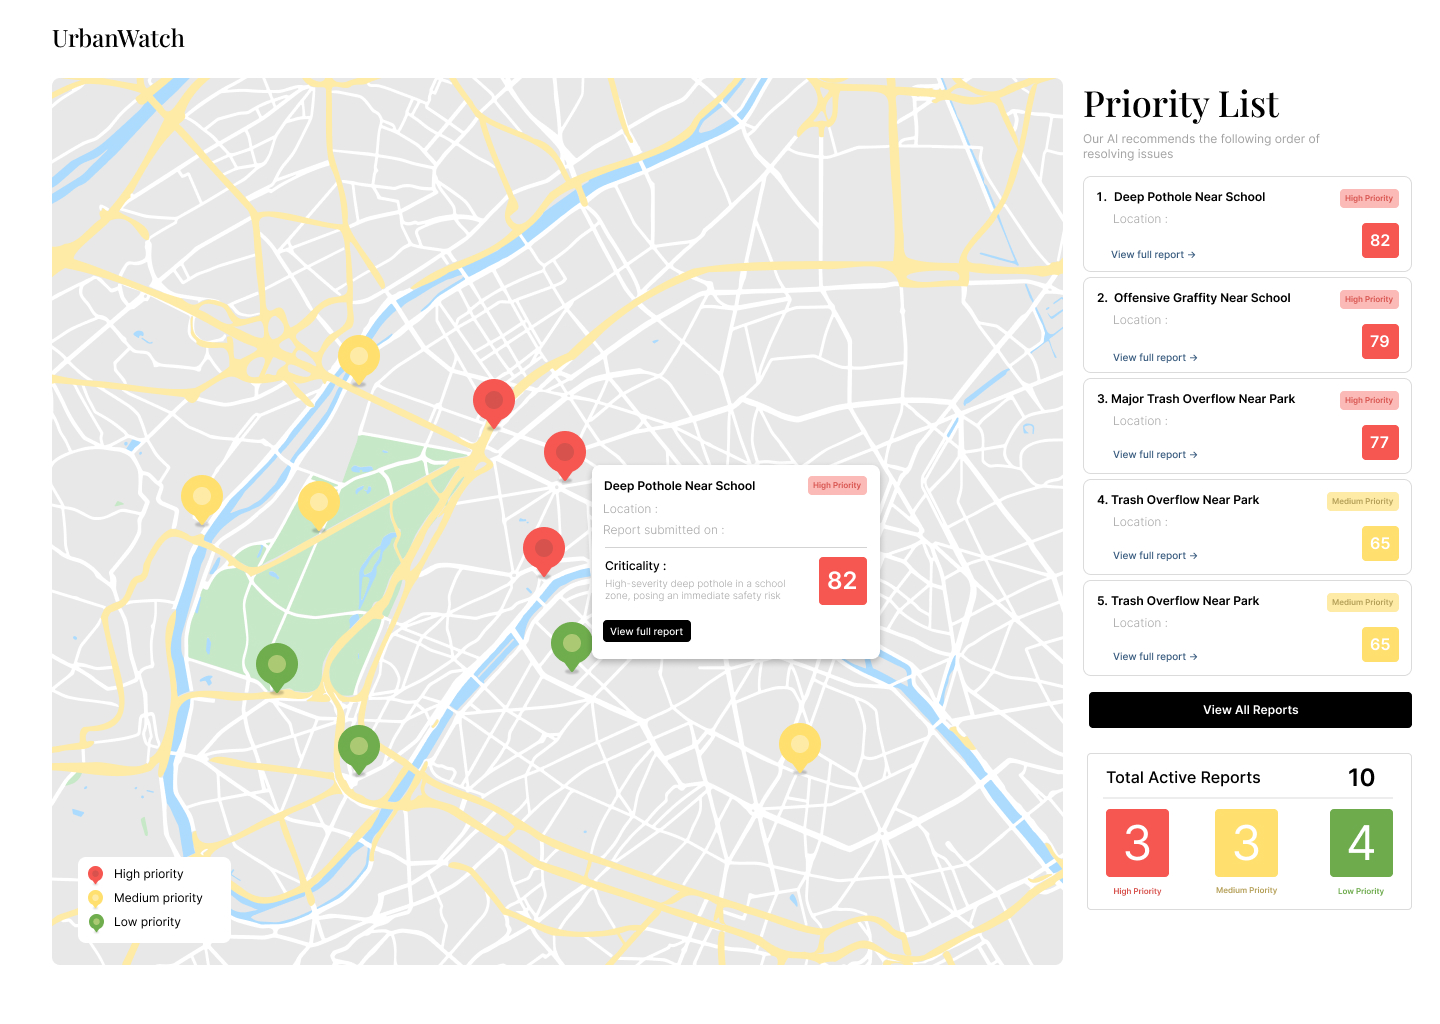
UrbanWatch AI transforms how cities prioritize problems. For citizens, it's a simple, five-second process: see an issue, snap a photo, and send. For officials, it's an intelligent command center. Our AI backend automatically classifies issues, generates reports, merges duplicates, and calculates a holistic Criticality Score based on severity, location, community impact, and urgency. This score is then used to generate a data driven action plan that, we suggest the officials to follow, in order to tackle the most important issues first and therefore utilize their resources in a better way!
How we built it
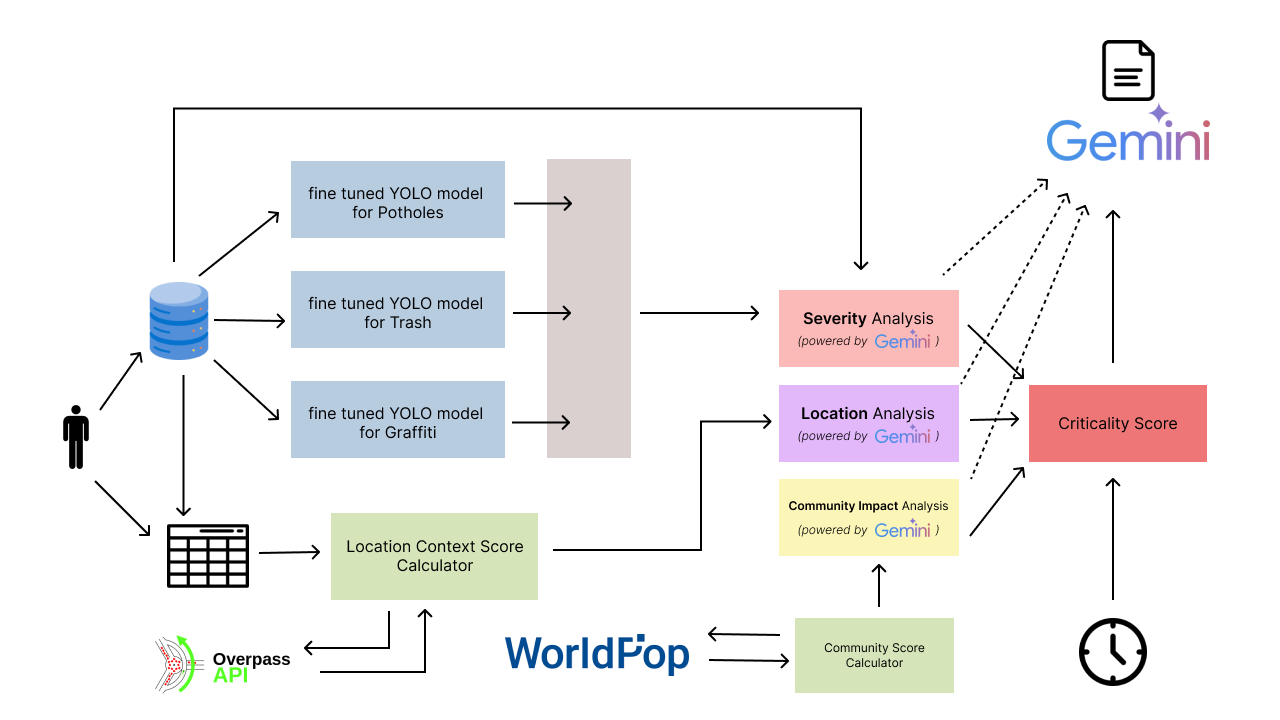
1) Mobile App (Flutter): The user-facing app was built with Flutter, for a high-performance cross-platform experience. We built the user experience to be as simple as possible. A user only has to open the app, click a picture and then submit! The app sends the picture and the GPS location of the phone to a supabase storage blob and a Postgres SQL table.
2) AI Backend (Python & FastAPI): This is the core of our system, it has 4 main parts.
a) Issue Detection: We use specialized YOLOv8 computer vision models to accurately classify issues like potholes, trash and graffiti and determine their severity ie how severe the issue is.
b) Duplicate Merging: There maybe multiple reports from different users about the same issue at the same location. So we run a clustering algorithm to cluster reports about the same issue using the location data. The cluster size is also taken into account when calculating community impact scores.
c) Calculating Criticality: Using WorldPop API and Overpass OSM API we see the population density and proximity to important locations like schools, colleges, hospitals etc to calculate location context scores and community impact scores. We run a CRON job that increases urgency score everyday for all reports. By adding these scores up we calculate Criticality score as follows:
$$ \text{Criticality} = w_1 \cdot \text{Location Context Score} + w_2 \cdot \text{Comm. Impact} + w_3 \cdot \text{Urgency} + w_4 \cdot \text{Severity} $$
d) Prioritiy List: We maintain a list that stores reports in an order of their criticality scores. This List is the order in which we recommend the officials to tackle the issues.
Challenges we ran into
Our biggest challenge was creating a Severity Score. Simply counting trash items is misleading, as one hazardous item is worse than five harmless ones. To solve this, we built a custom formula that balances the size (area), number (count), and density of the litter. Most importantly, we added crucial safety rules that automatically flag hazardous materials to ensure public safety is always the top priority. Fine-tuning this score to be consistently accurate was our most significant technical accomplishment.
Accomplishments that we're proud of
We successfully designed a Criticality Score that moves beyond simple metrics to weigh the real-world context of an issue. By turning a complex problem into an elegant "See. Snap. Solve." experience, we've built a system that not only works, but that can foster trust and collaboration between a community and its government.
What we learned
We learned that the most hyped tool isn't always the best one. While a multimodal LLM could describe an image, a specialized YOLOv5 model provided the structured, machine-readable data (like bounding boxes) essential for our automated severity calculations. This taught us that engineering a robust AI pipeline is about choosing the most precise and efficient tool for each step.
Built With
- dart
- fastapi
- flutter
- gemini
- javascript
- next
- python
- yolo


Log in or sign up for Devpost to join the conversation.