-
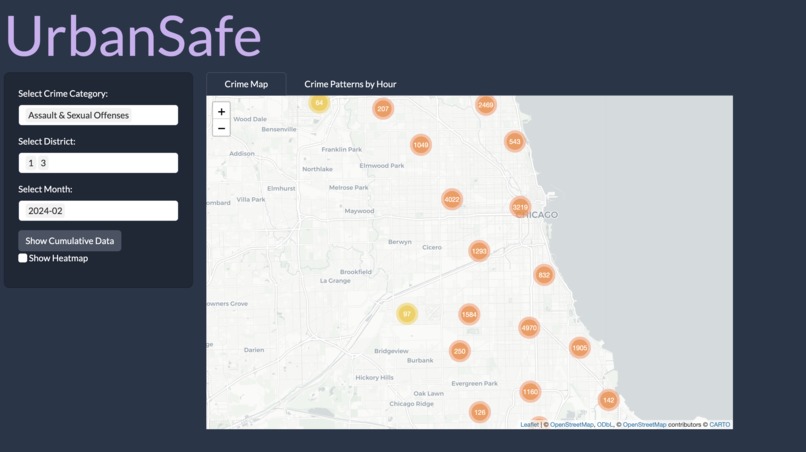
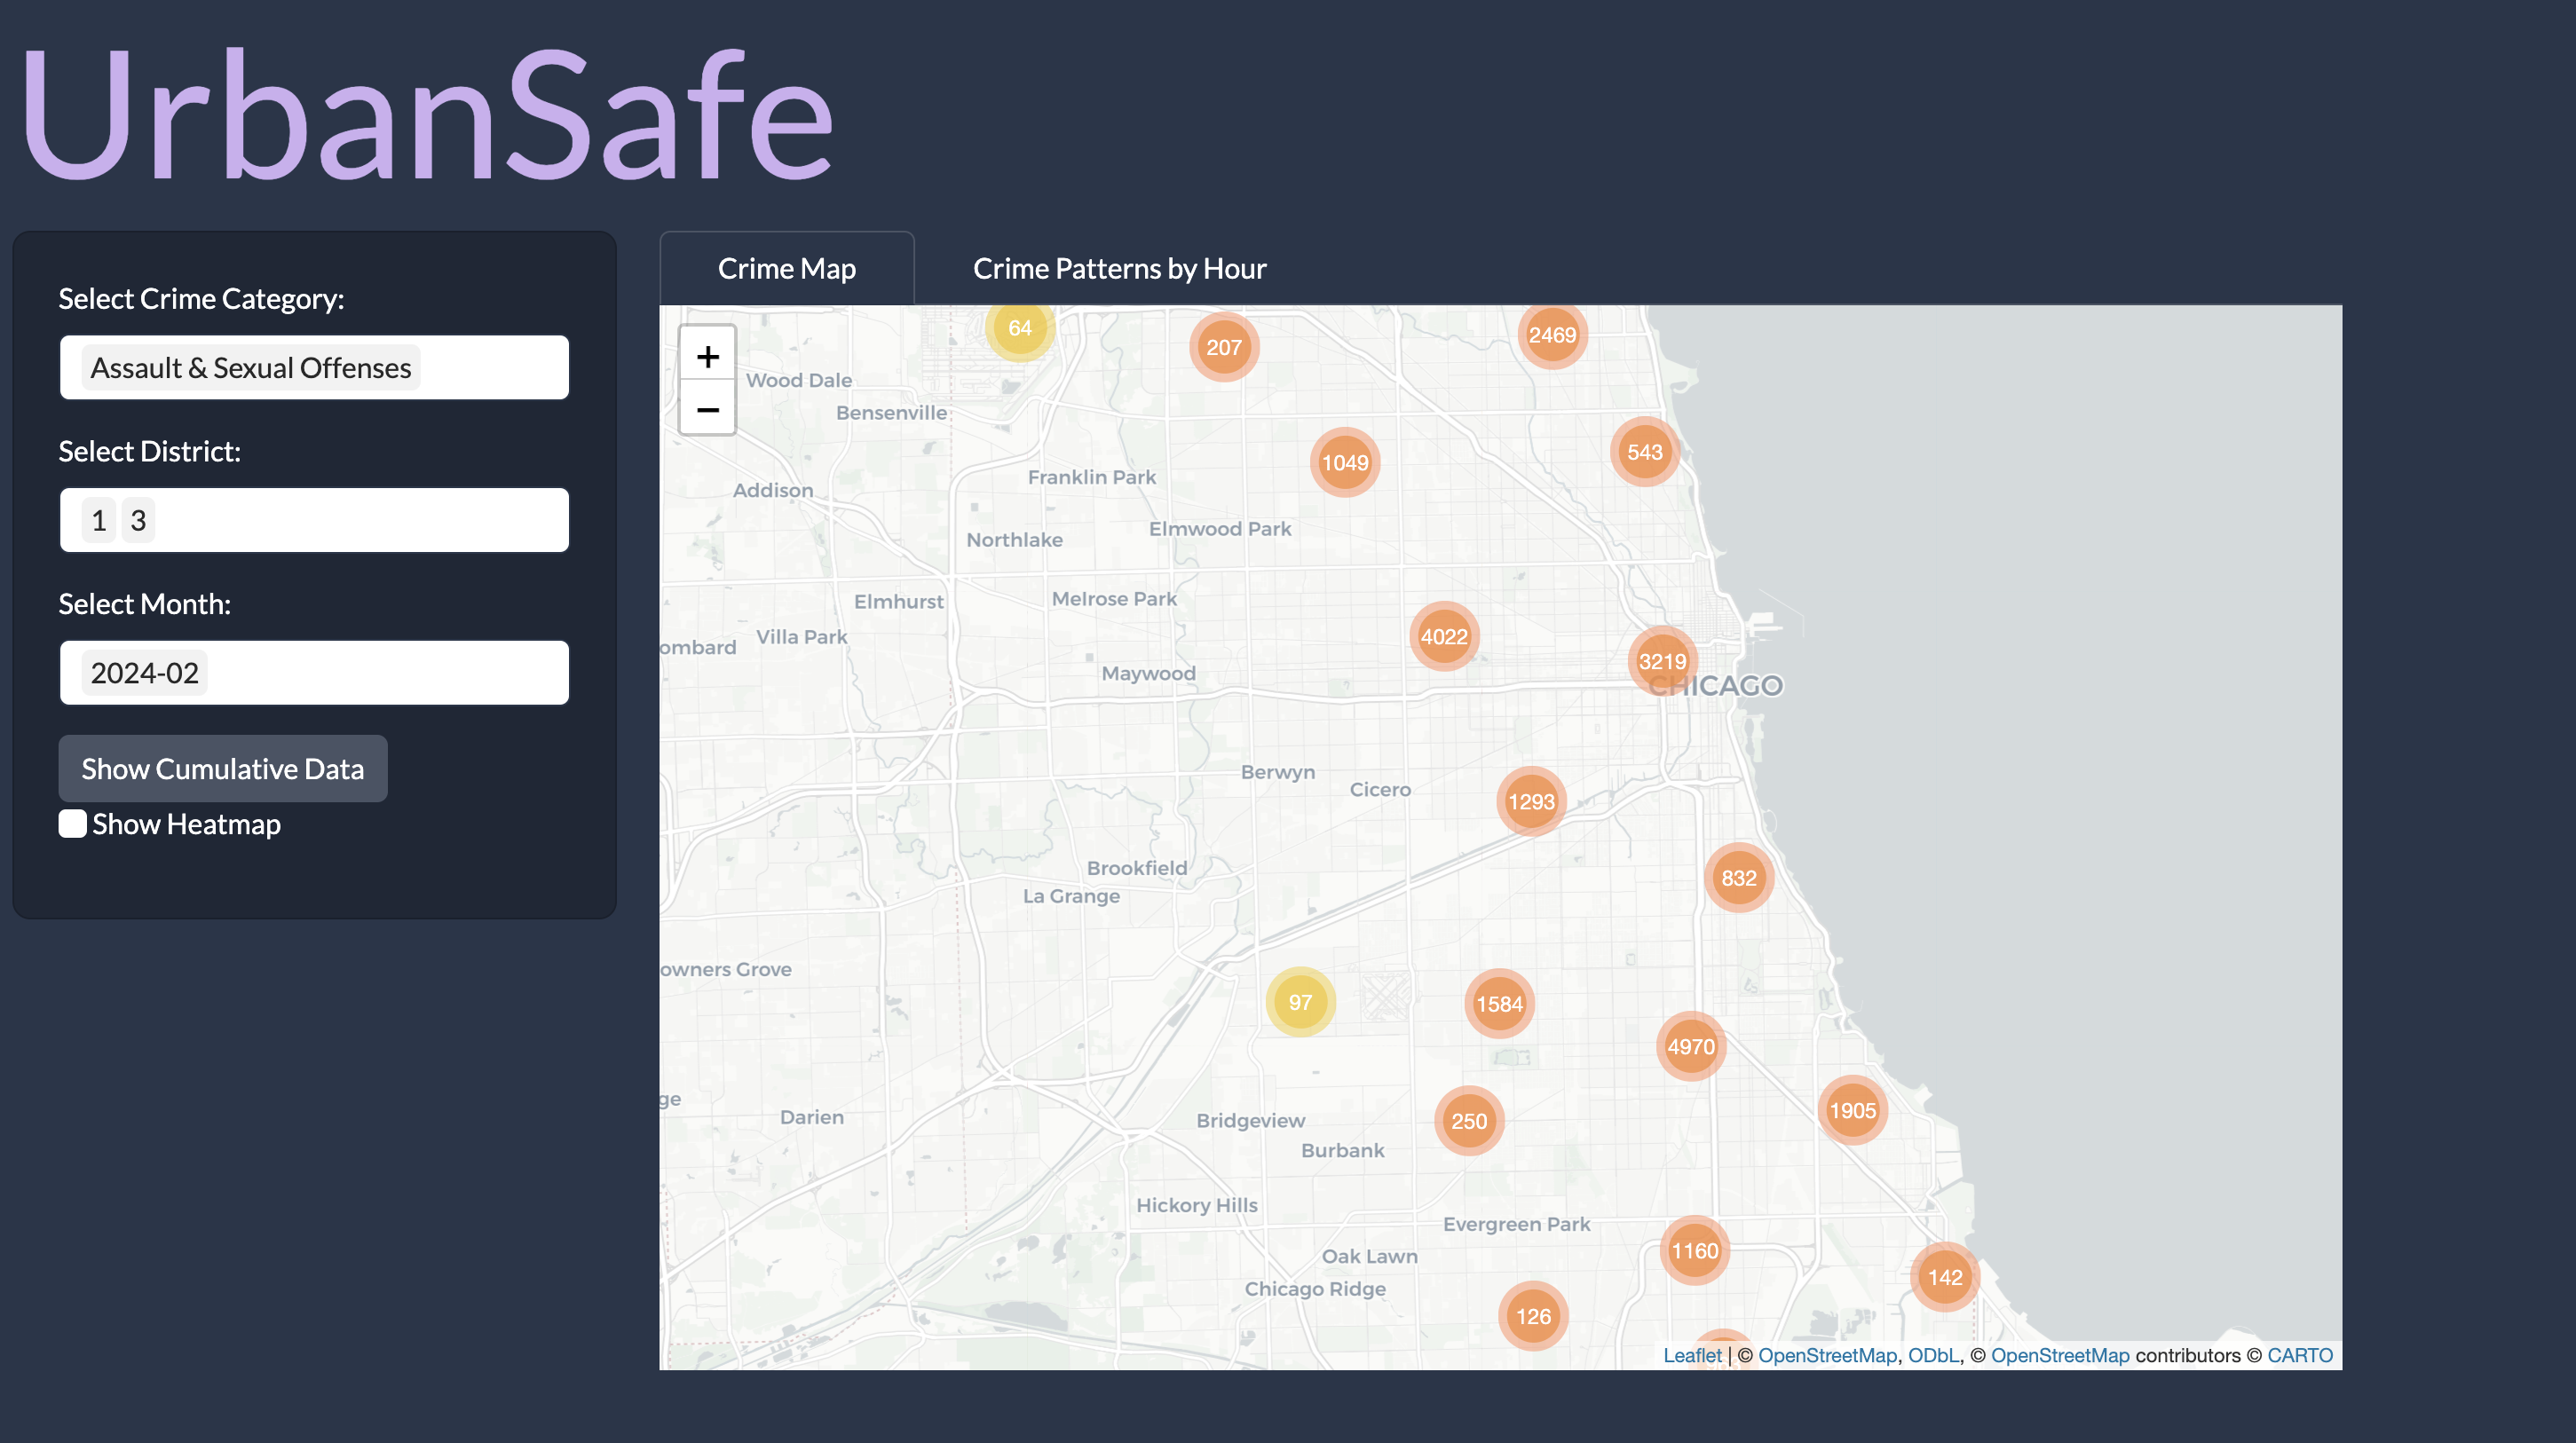
The interactive map
-
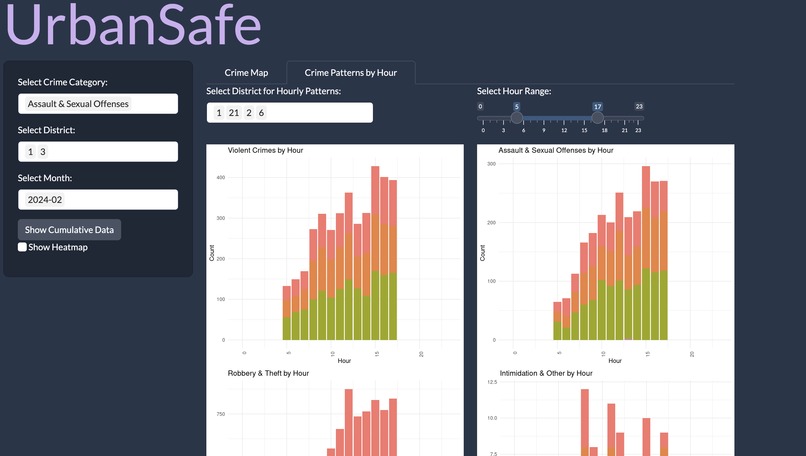
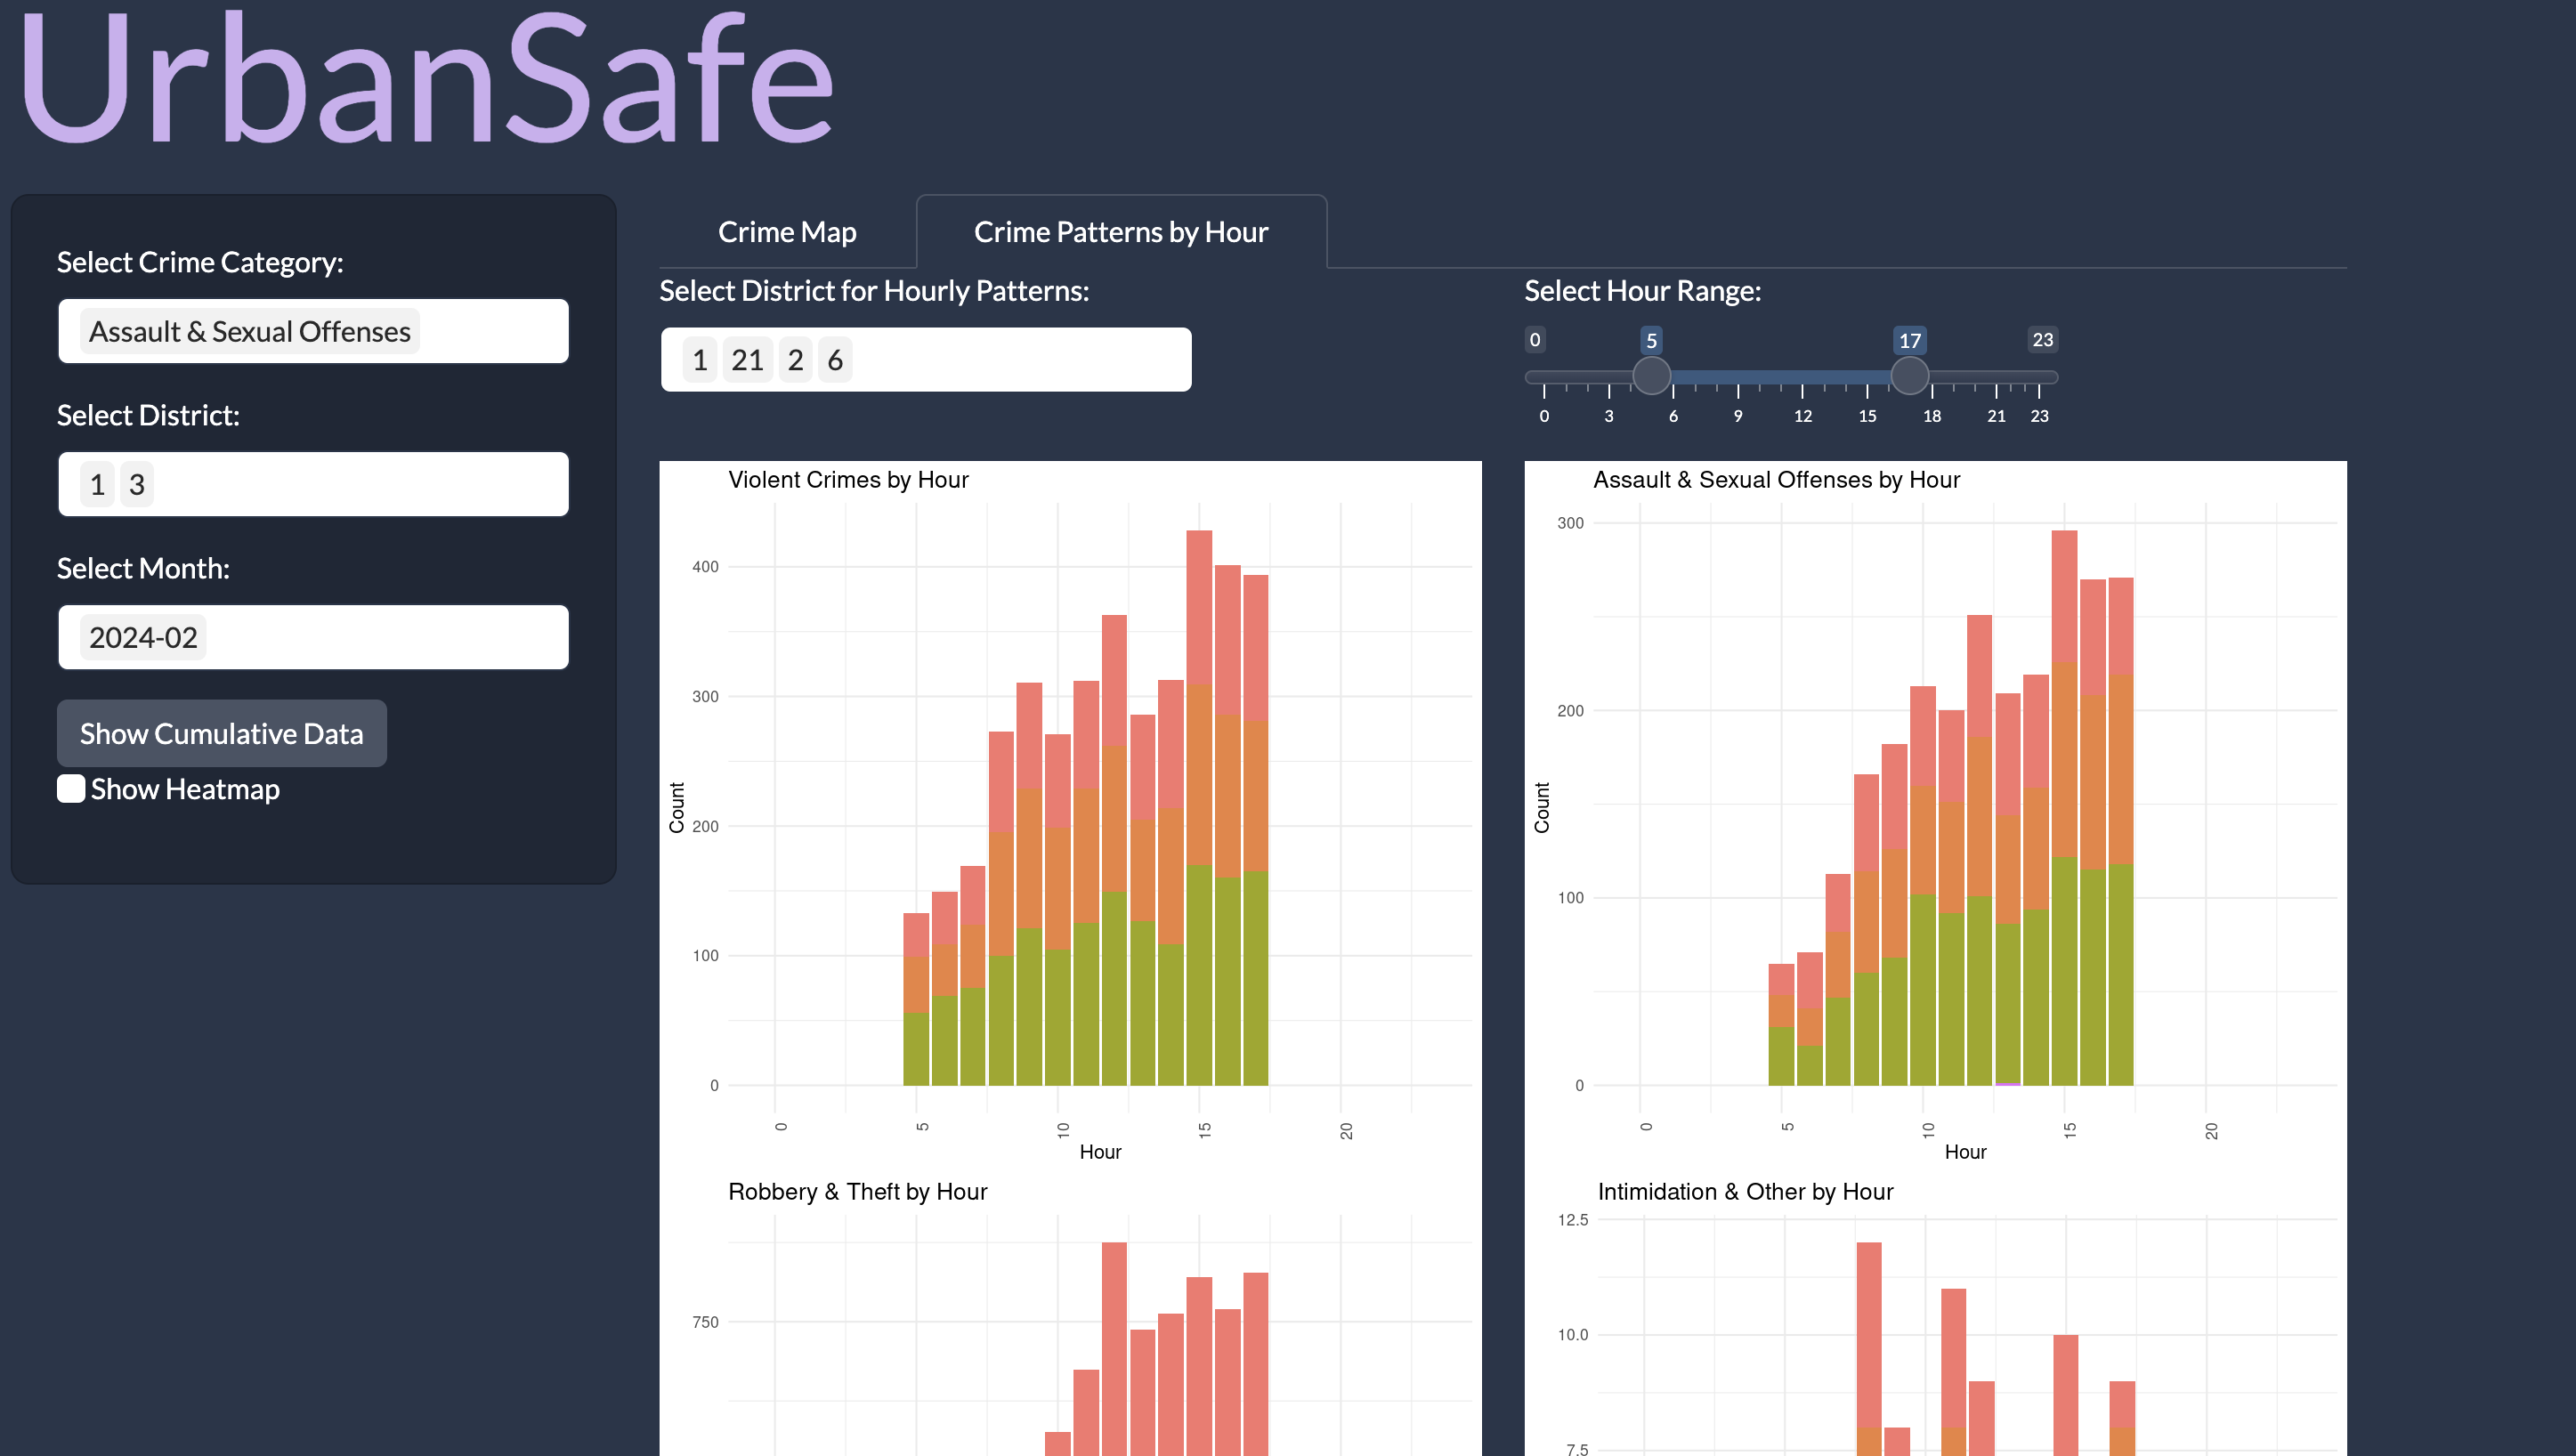
Graphs that show data based on time-of-day
-
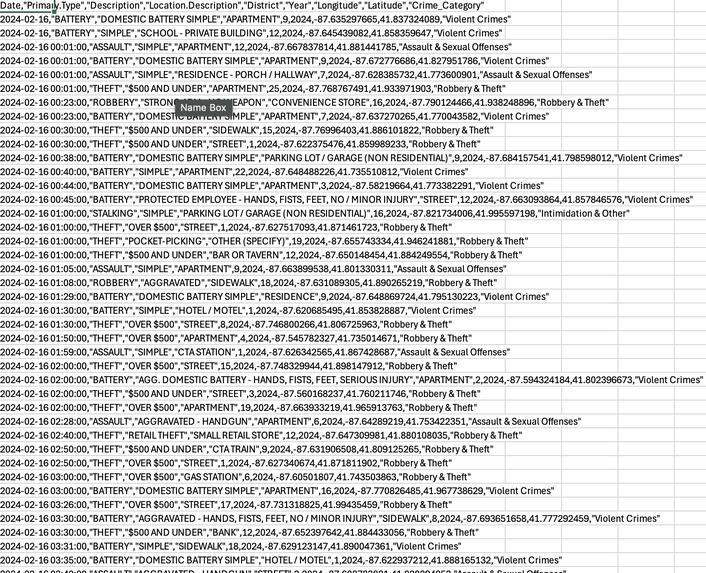
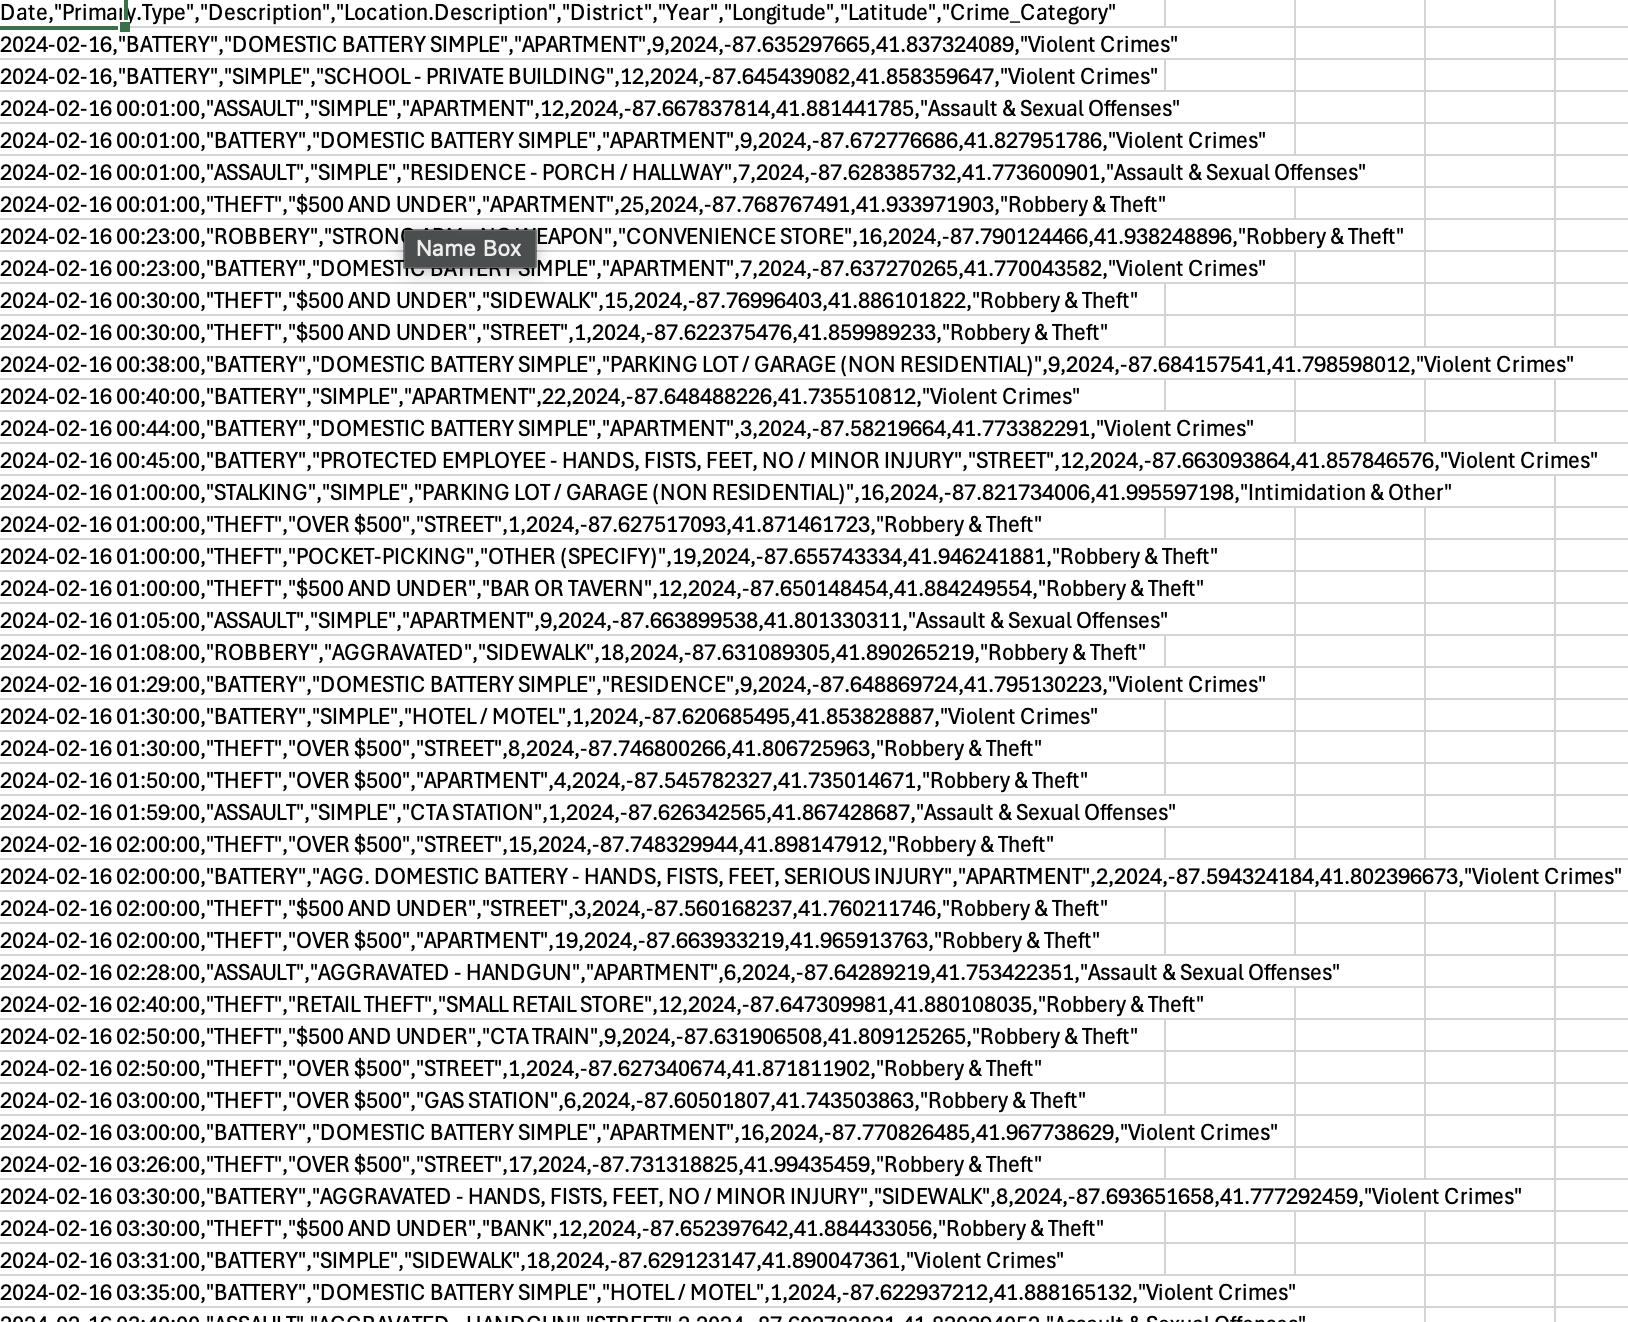
The crime data set that we needed to clean up and extract data from
Inspiration
Crime is a growing concern in big cities and has affected people travelling to and living in these areas. We built UrbanSafe to keep users informed about major incidents, empowering them to navigate urban environments with confidence and peace of mind. It was important that we make our app very interactive and easy to use so users can access information about what's happened around them as efficiently as possible.
What it does
UrbanSafe is a web application that allows users to easily see criminal incidents that have occurred around them. The app displays an interactive map with pinpoints to show where in Chicago major crimes have occurred. Users can filter by districts in Chicago, a set time frame, and the type of crime so they can find out more about the type of crime that particularly worries them. Users can also see crime data visualised on bar graphs so they know exactly which areas are safe at what time of day.
How we built it
We built UrbanSafe using R as our core language, with Shiny powering both the front end and backend for a smooth, interactive experience. Leaflet brings crime data to life with dynamic maps, while ggplot delivers clear, insightful bar graphs. To ensure accuracy, we source real-time data directly from Chicago’s crime portal, keeping users informed with the latest crime trends and incidents.
Challenges we ran into
Building UrbanSafe came with key challenges. Designing an intuitive UI required careful iteration to balance functionality and ease of use. Finding comprehensive crime data was another hurdle, as we needed accurate, up-to-date sources. Displaying the map with Leaflet also posed challenges in keeping it visually clear. Finally, streamlining the data for users to make it accessible in a digestible format was a complex but crucial step in building UrbanSafe.
Accomplishments that we're proud of
We are especially proud that we were able to successfully build a web app that is intuitive for users and allows for filtration to make the experience more personalised for their concerns. We were also happy with how the interactive map came out and feel it is a particularly powerful tool for users to see what's happening around them.
What we learned
The main thing we learned is the importance of communicating complex and somewhat incoherent data in an efficient, comprehensible way to users. This is something we realised we would have to put a lot of time into as it is a key way with how the user interacts with the application and data. We also picked a few technical skills such as learning about the leaflet and shiny package and how powerful they are within R.
What's next for UrbanSafe
We would like to turn this into a mobile app so users can access the app with ease from anywhere. Furthermore, we'd like to expand the app to multiple major cities in the U.S. so that users across the country can navigate urban environments, empowered with this data.
Built With
- bslib
- dplyr
- ggplot2
- leaflet.js
- r
- rstudio
- shiny

Log in or sign up for Devpost to join the conversation.