-
-
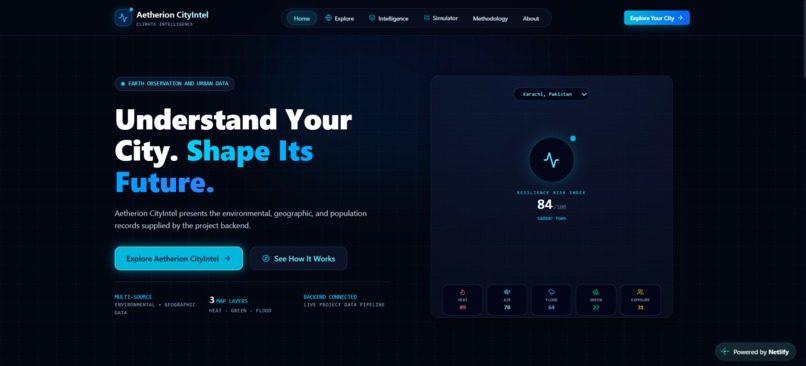
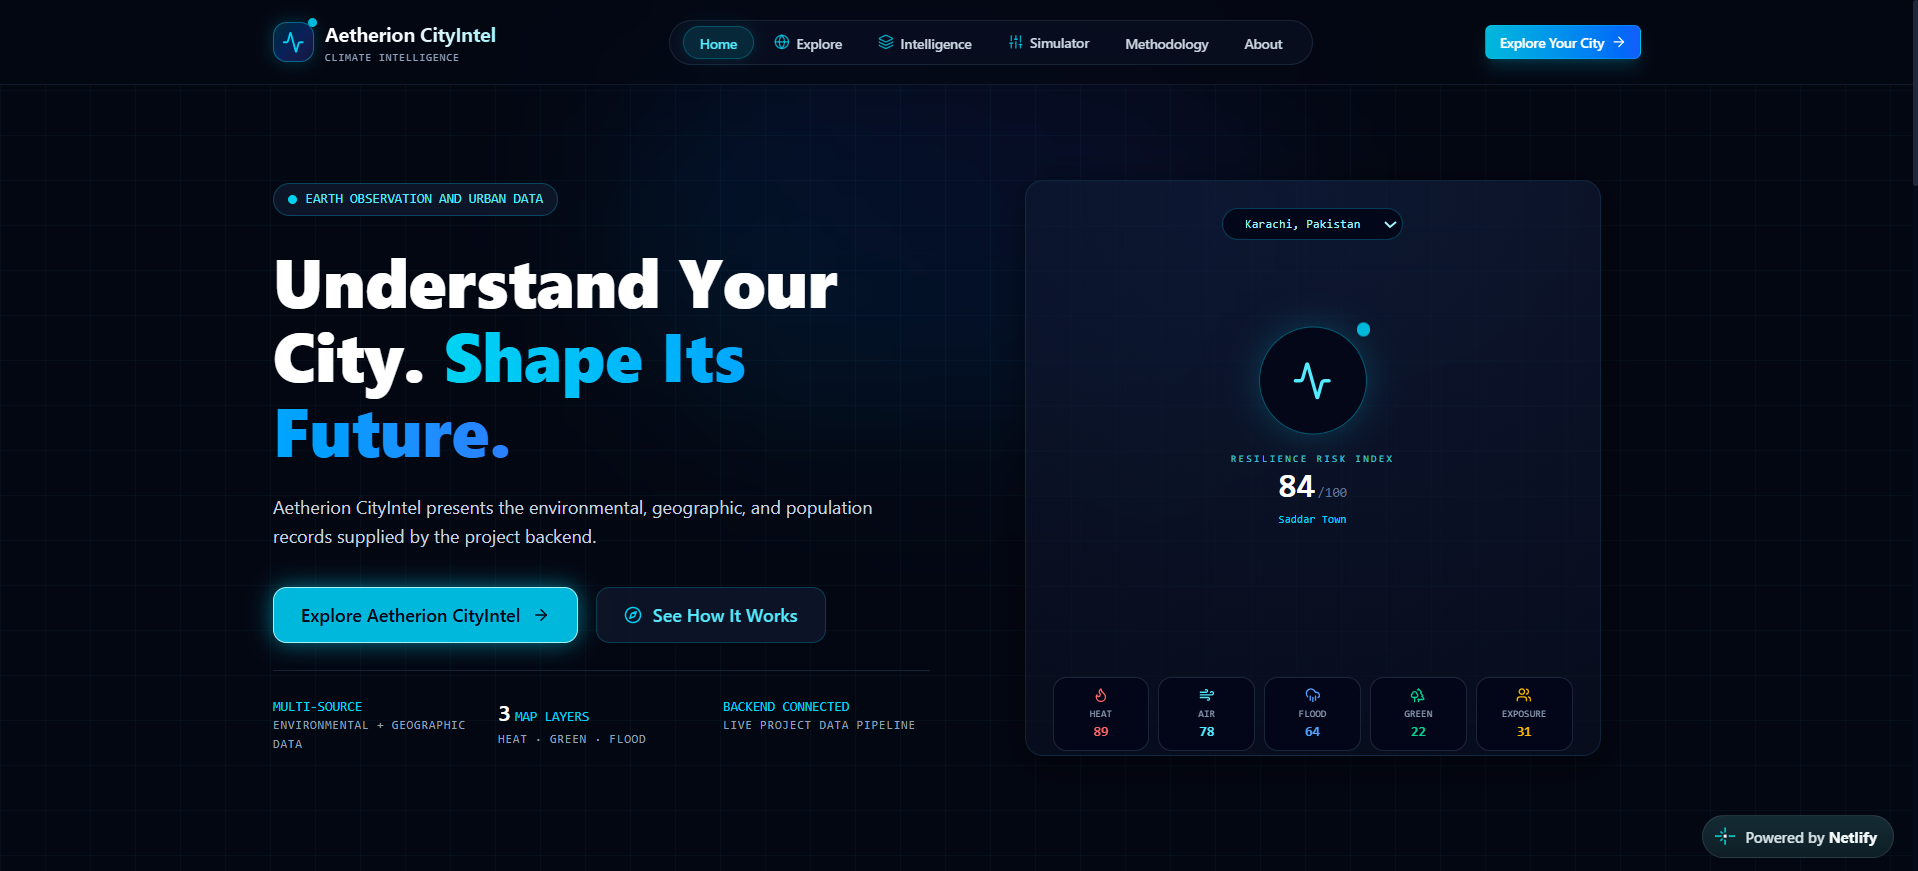
Landing Page
-
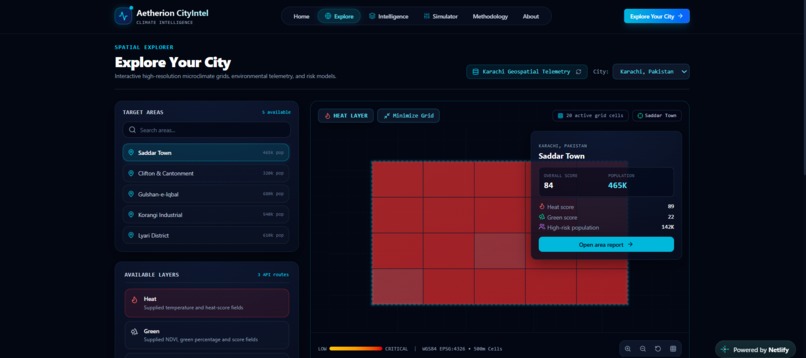
Explore
-
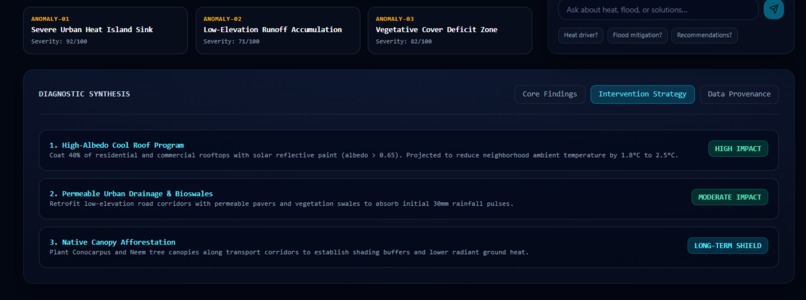
Preventative Steps and Predictions
-
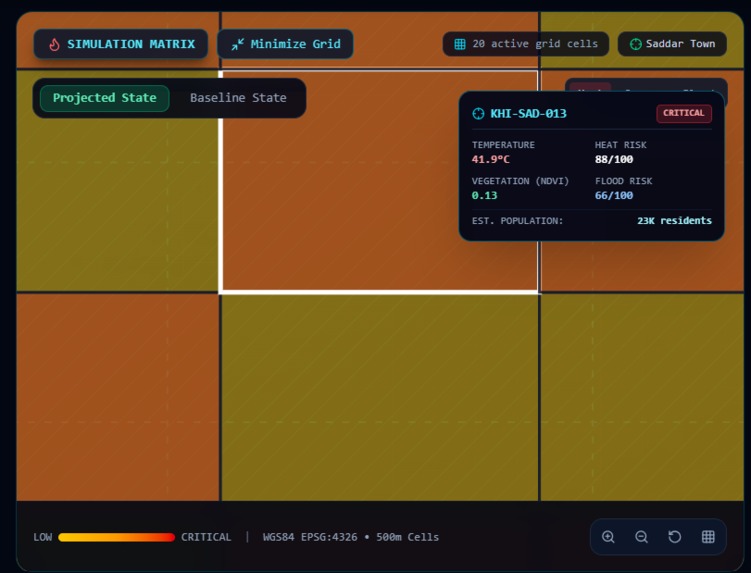
Close up of grid cell
-

Aetherion CityIntel Report
-
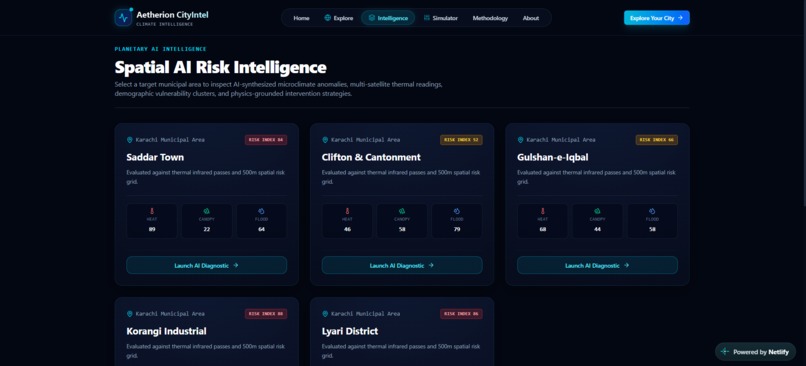
Aetherion CityIntel AI
-
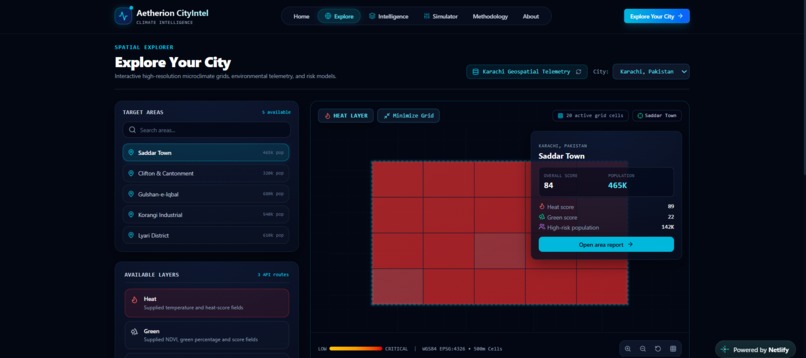
Explore Your City
-
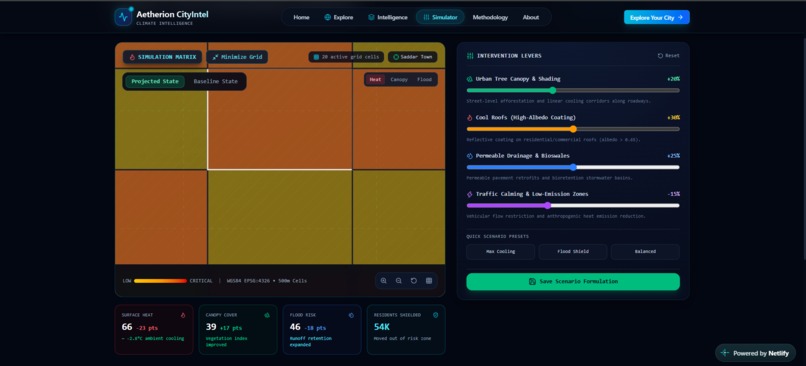
Simulation Engine using grid
Inspiration
As global warming alters ocean baselines, traditional forecasting methods are struggling to pinpoint severe weather events accurately. While rising awareness among younger generations is driving urgent calls for climate action, forecasting technology must also evolve. AI-based data assimilation represents the next crucial step in meteorology, allowing forecasters to process complex real-time data and stay ahead of rapidly changing climate realities. This is where CityIntel comes in. By turning complex AI predictions into clear, actionable insights, CityIntel serves both ends of the spectrum. It provides forecasting agencies and city officials with the predictive tools needed to model extreme risks early, while giving everyday citizens hyper-local, real-time alerts so they can navigate severe weather hazards safely in their daily lives.
What it does do
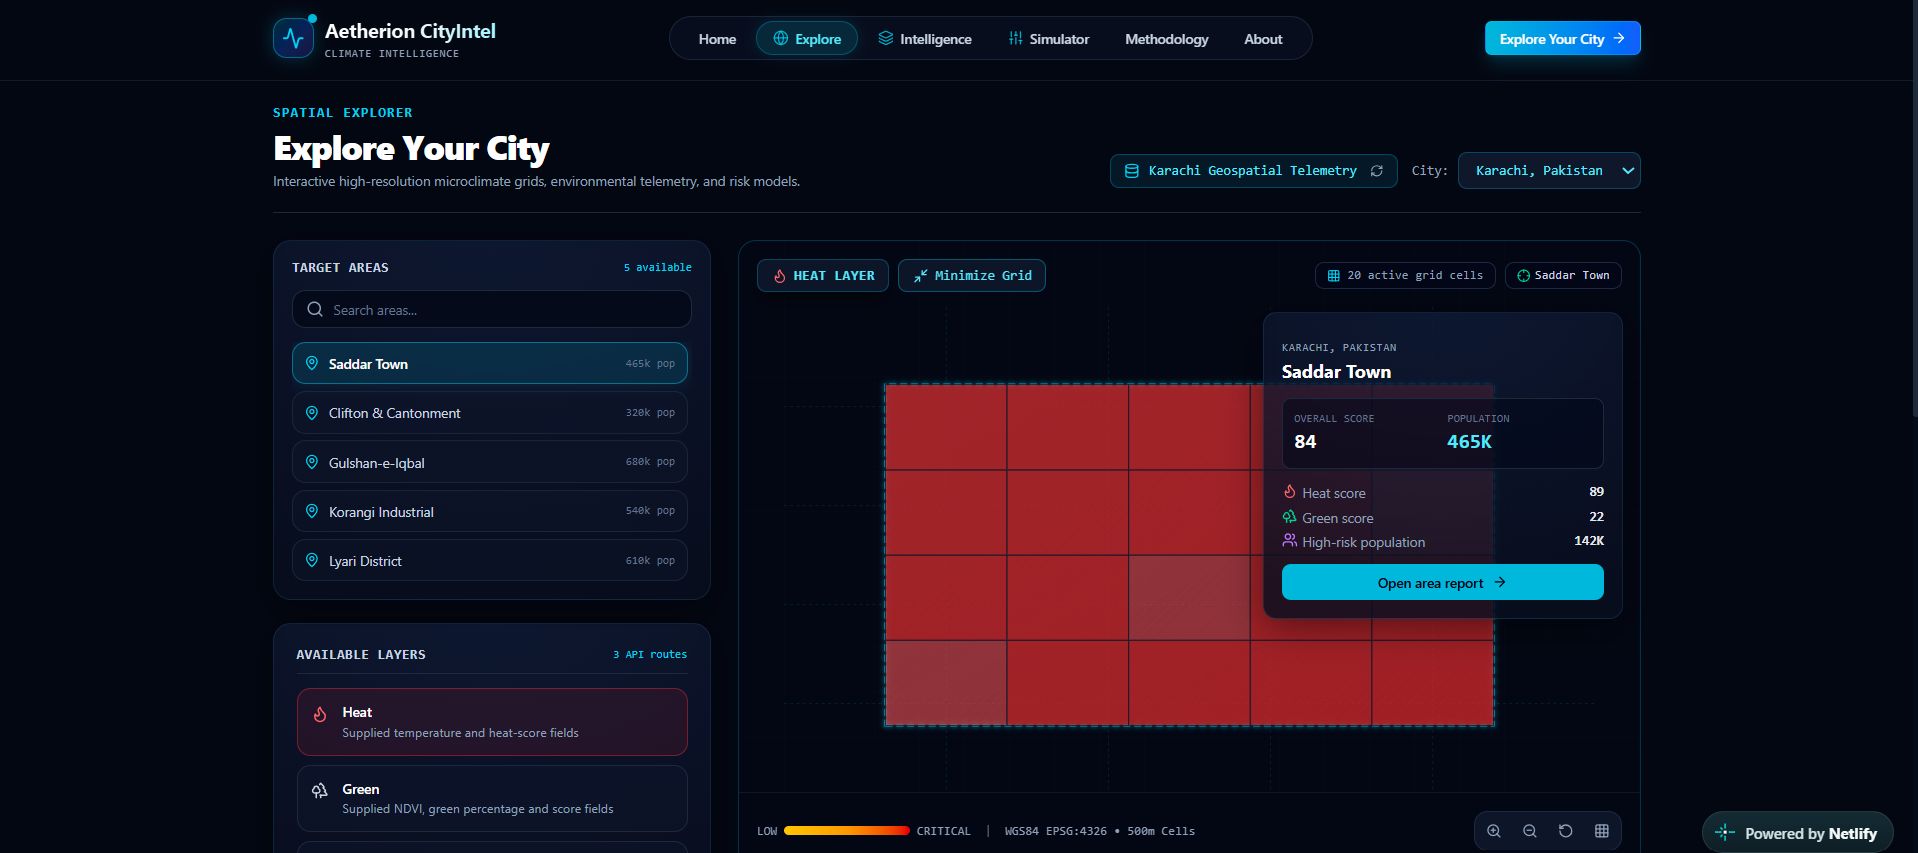
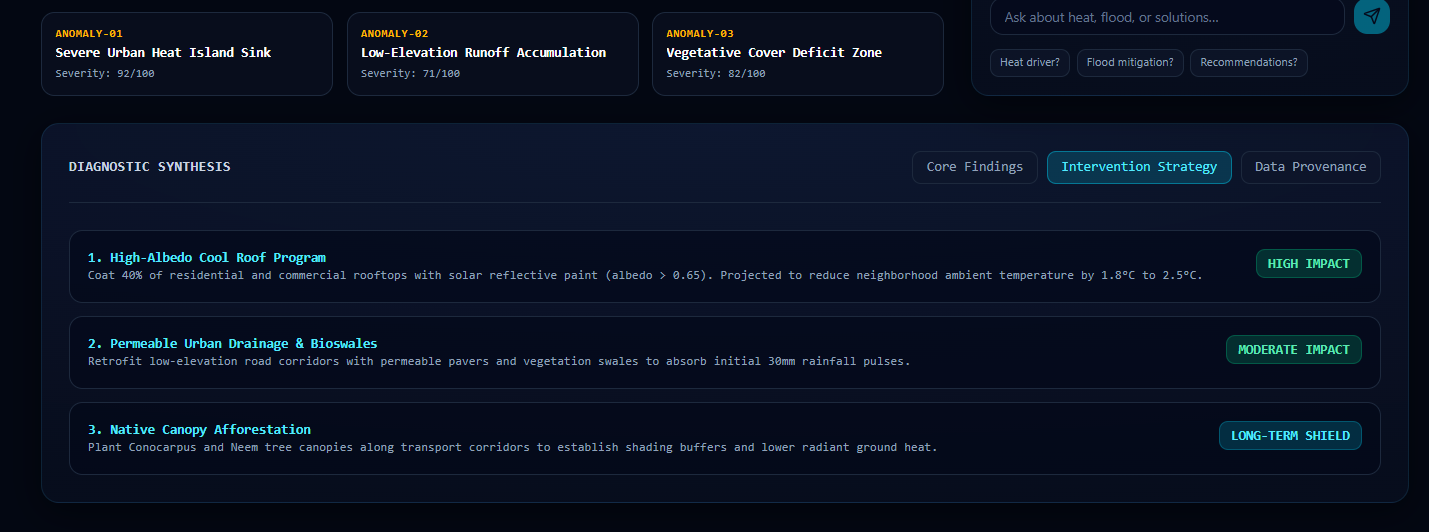
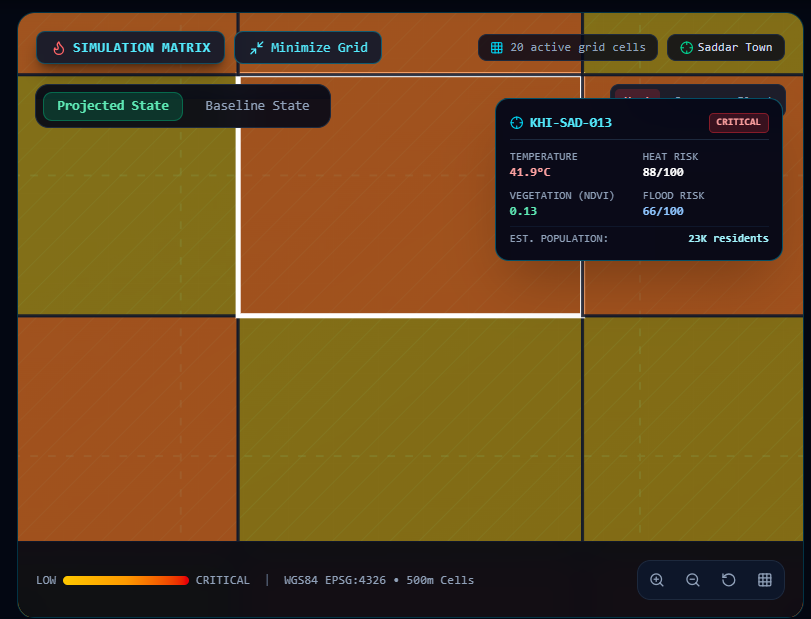
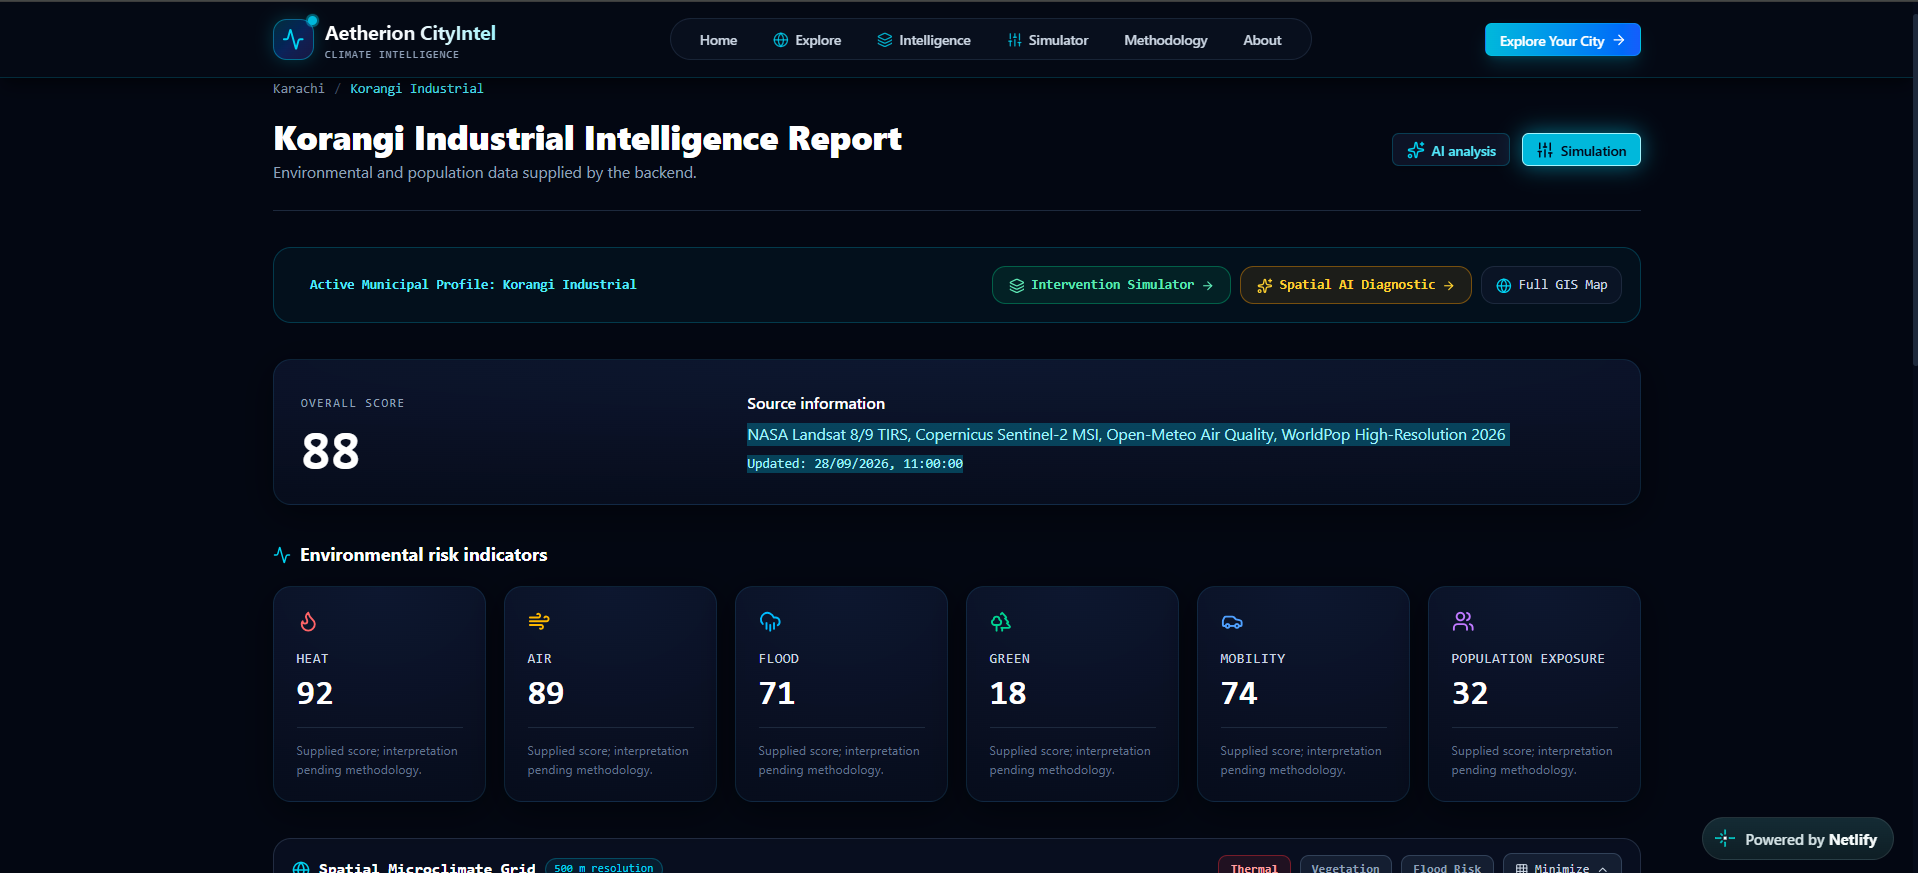
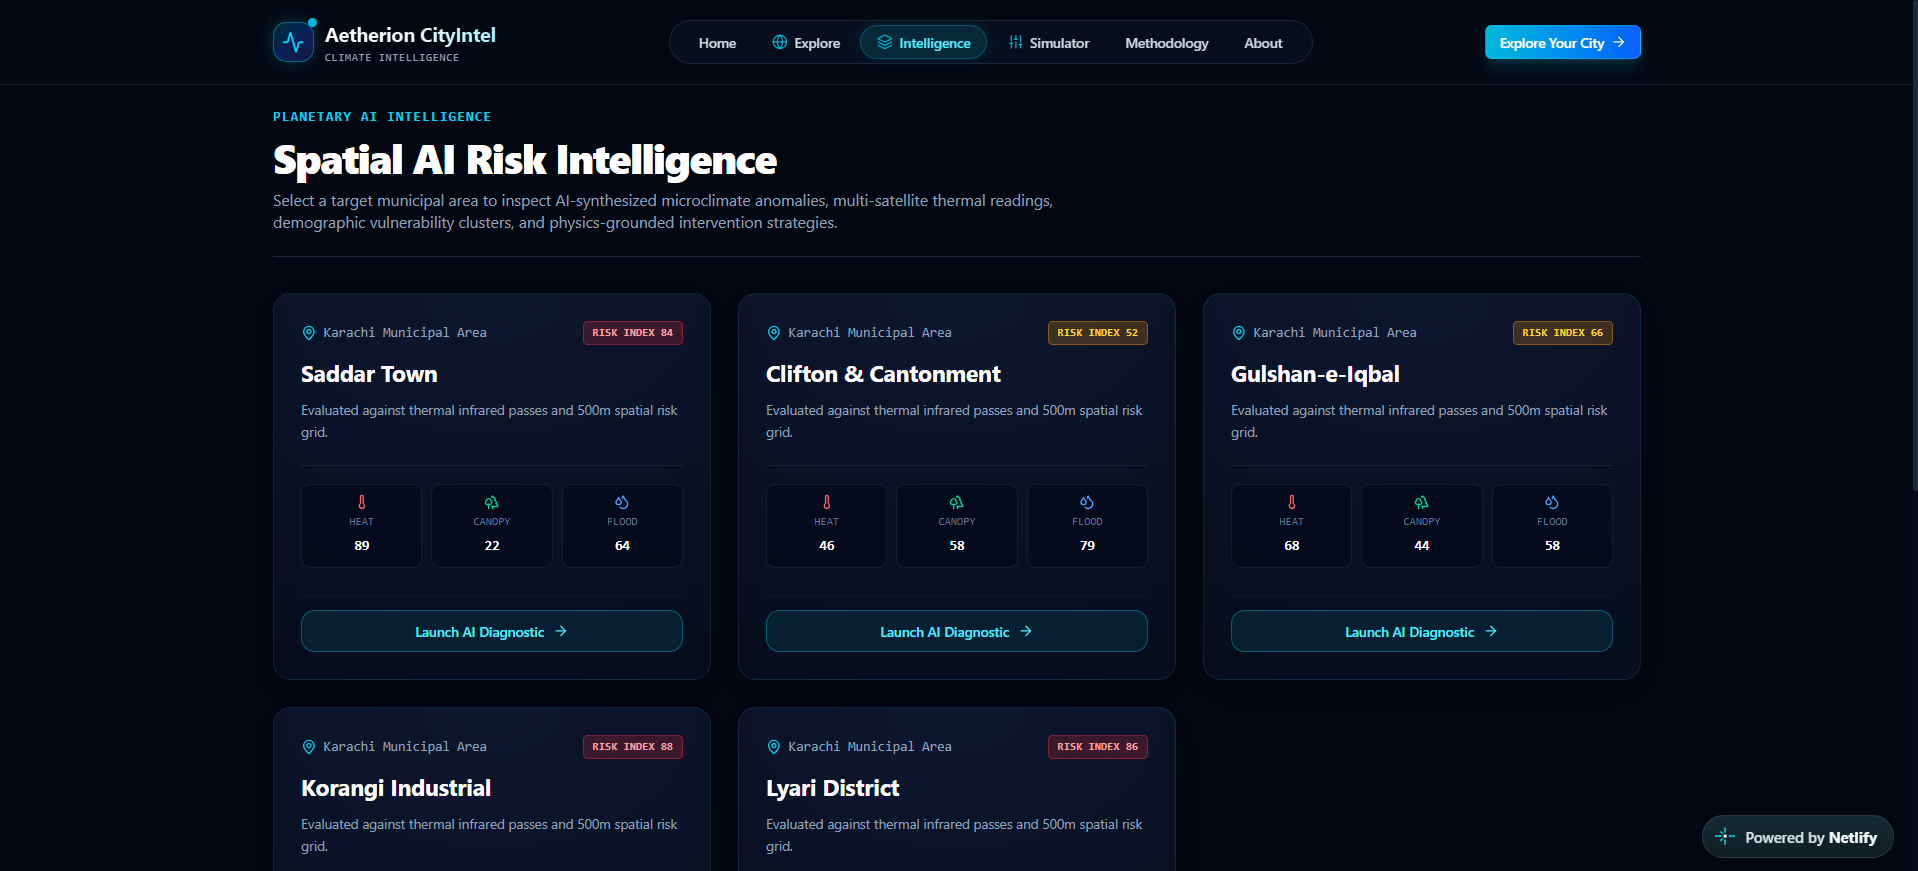
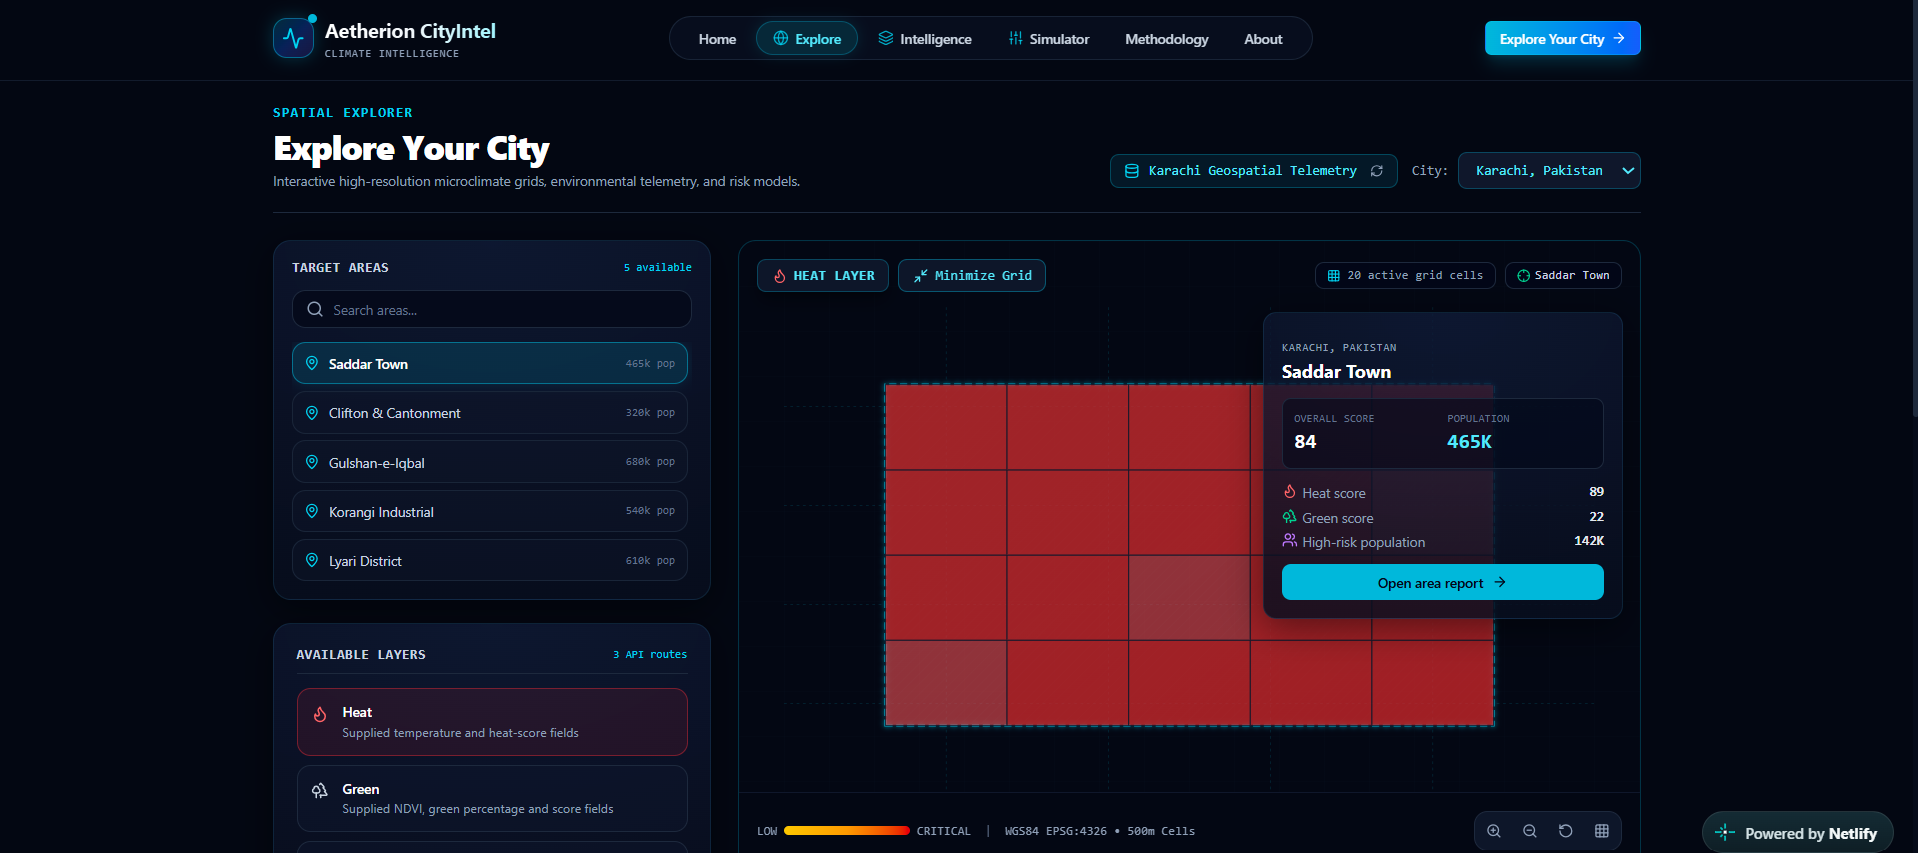
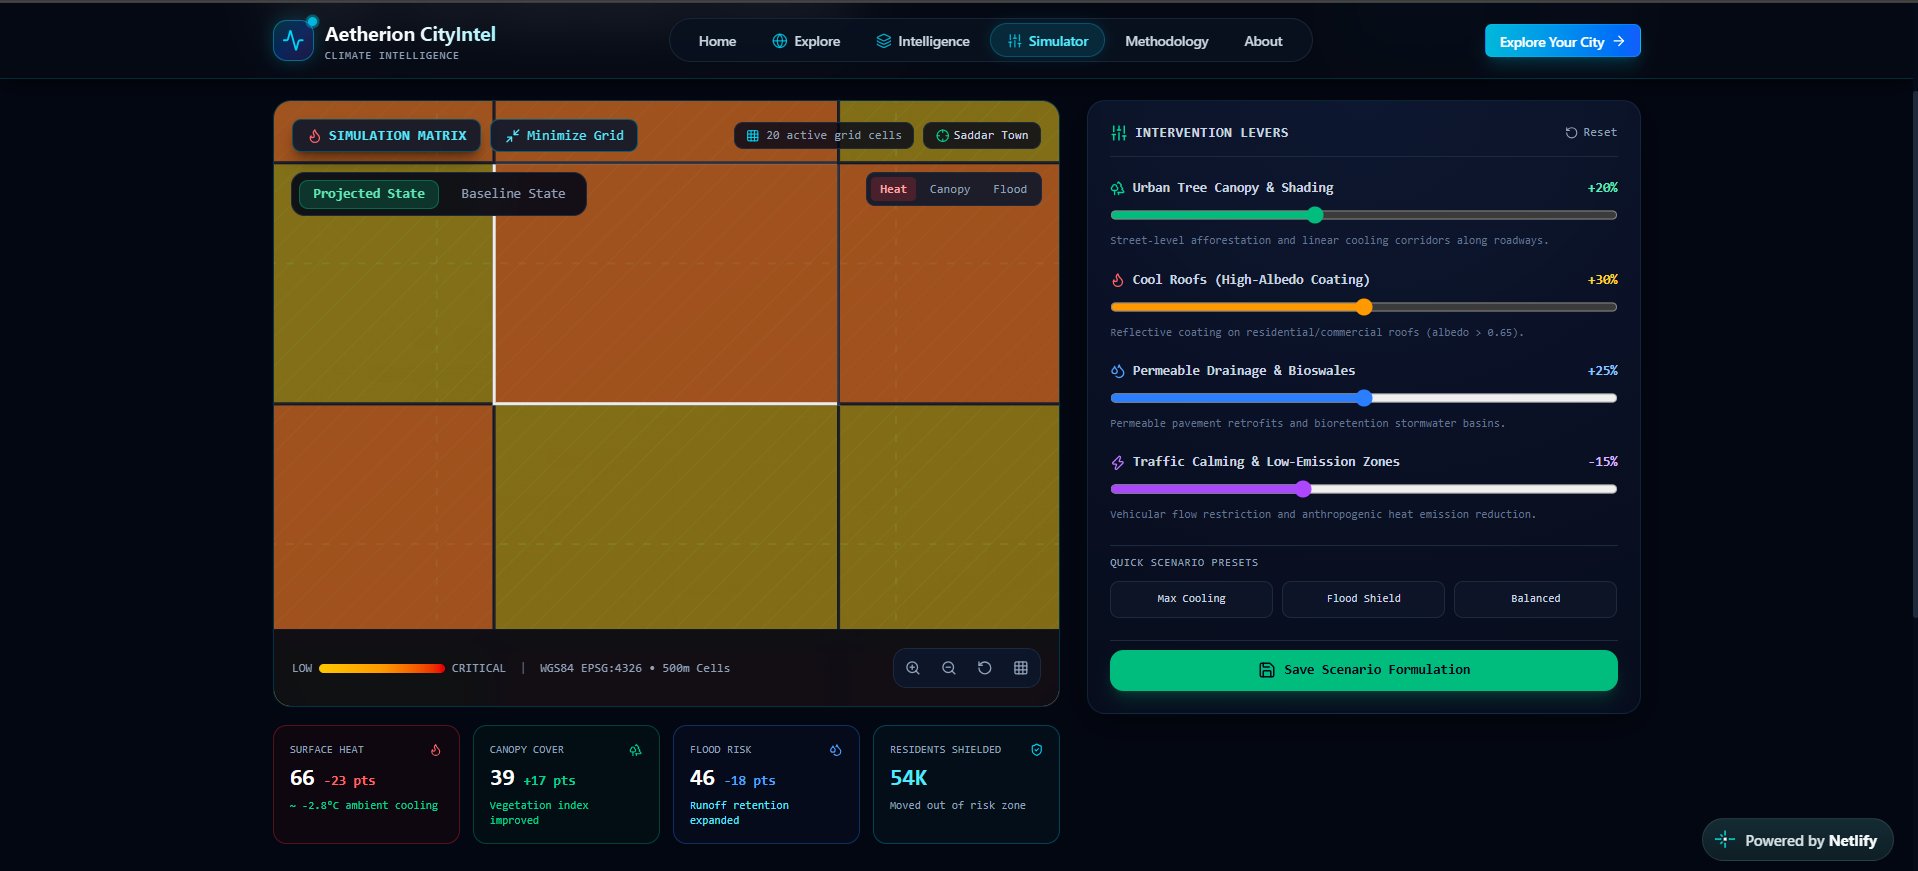
CityIntel is a dashboard that gathers data from metropolitan areas and allows users to spot and respond to environmental risks, all in real time and it features an interactive simulation tool to adjust and change local urban variables. It analyzes data gathered by sensors and satellites to spot patterns and produces possible actionable steps authorities can take to mitigate them. The dashboard also has predictive modelling capabilities, which can be used to simulate environmental interventions, such as expanding green belts and canopy cover. This lets them dynamically visualize and evaluate changes in their neighbourhood/community before implementing them. *Features: * -Enviromental Intelligence using climate data from satellites LandSat 9, Sentinal 2 and NASA GPM. -Grid cell ($250 m^2$) mapping to get neighbourhood level analysis. -AI insights powered by a Frontier AI model to simplify understanding of complex data -Predictive modelling to explore prevention steps
How we built it
We used open-source data providers and APIs such as Open-Meteo, OpenStreetMap, Overpass, Landsat, Sentinel-2, NASA Earthdata and WorldPop as the main datasets, along with more specific and local datasets of our target city, Karachi. The local datasets ranged from 2000-2023, as they were the most up-to-date, complete and available publically. For visualization of geomapping and gridding, we used Figma. For the frontend, we used Typescript. Initially we tried using simple HTML/CSS and JavaScript, but our lead front end developer realised pretty quickly that it wasn't going to pan out if we needed to scale up the scope of the project. The website was deployed using Netlify, as it offers swift deployment and is accessible globally.
Challenges we ran into
The main technical hurdle was handling complex map gridding and displaying dense, multi-layered data simultaneously without causing UI glitches or performance lag. Transitioning the codebase from standard JavaScript to TypeScript allowed us to write strictly typed, modular functions that made data rendering significantly more stable and reliable. Using advanced mathematical and scientific modelling, the team calculated potential environmental risk factors and their adverse systemic impacts.
What we learned
Aside from technical growth, this project reinforced a major lesson for us all: the power of teamwork. While our initial communication had a few bumps, iterating on our workflow brought the team into full coordination by the finish line. Everyone here at team Aetherion is proud of what we've accomplished together and we hope to achieve even more!
What's next for Aetherion CityIntel
The current build serves as a proof-of-concept for our target city. Next, we plan to onboard more regional datasets to bring UrbanPulse to additional cities, while polishing our UI and fixing edge-case bugs!
Built With
- cursor
- figma
- frontier-ai
- netlify
- typescript
- webgl
- website


Log in or sign up for Devpost to join the conversation.