-
-

urbanpulse AI
Inspiration
Living in a fast-growing city made me realize that people rely on guesses instead of data when making everyday movement and business decisions. Crowded streets, unpredictable traffic, safety concerns, and unplanned business locations affect productivity, security, and quality of life. I imagined a platform that works like a weather forecast — but for city life. Instead of predicting rain, it predicts: Crowds, Safety, Traffic, Events, Business Activity Crowds, Safety, Traffic, Events, Business Activity
What it does
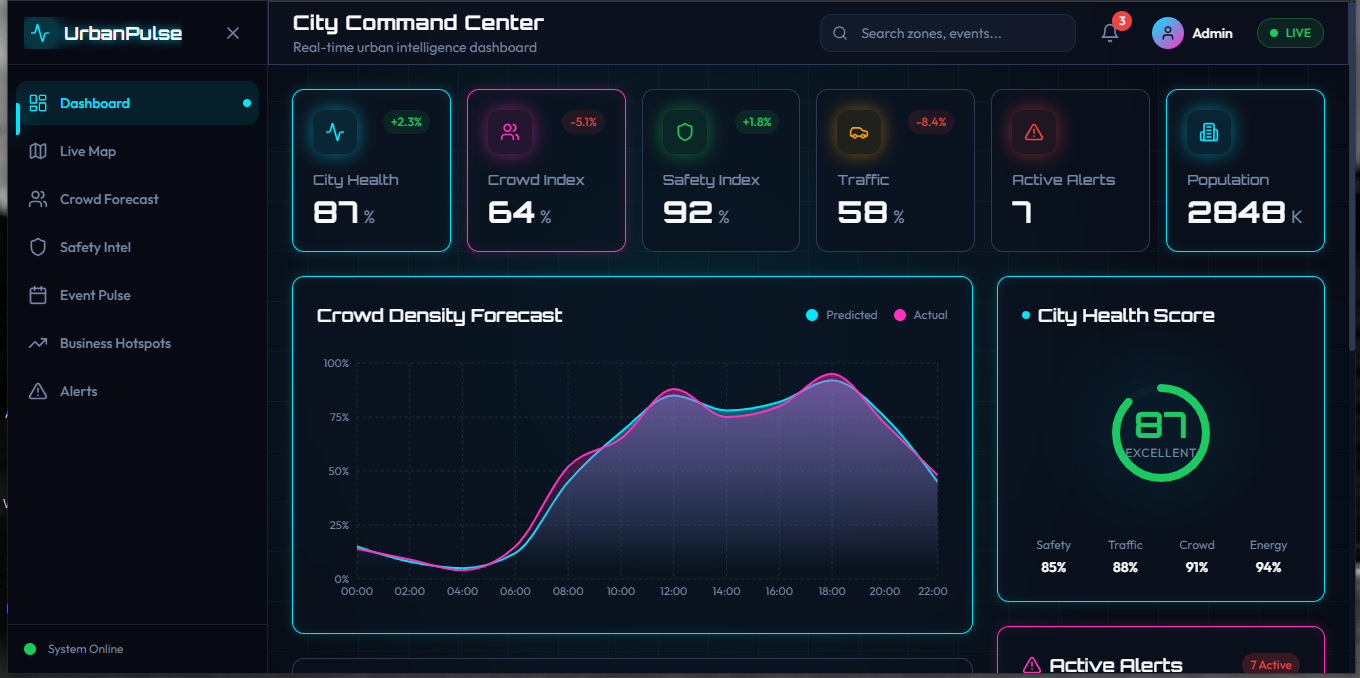
Live City Heatmap Shows real-time crowd density in every neighborhood Red = overcrowded, Yellow = moderate, Green = calm
Safety Index Rates city areas by safety based on historical and simulated data Alerts users about unsafe zones or potential risks
Crowd Forecasting Predicts busy zones at different times of the day Suggests the best times to visit specific areas
Event Pulse Tracks trending events happening in the city Shows which events might impact traffic or crowd levels
Traffic Analysis Visualizes traffic intensity across main roads Helps users plan faster and safer routes
Business Hotspot Finder Highlights areas with high foot traffic Ideal for new store openings, marketing, or pop-up events
City Alerts & Notifications Warns users of overcrowding, safety issues, or traffic spikes Helps citizens, businesses, and authorities respond proactively
Decision Support Helps people and businesses plan smarter Provides insights like “go to this area at this time” or “avoid this street tonight”
How we built it
UrbanPulse AI was built as a modern smart-city web platform using:
Layer Technology Frontend React + Tailwind CSS Charts Chart.js Mapping Leaflet Hosting netlify
To simulate real city intelligence, I created structured datasets representing:
Urban Data={Crowd Density, Safety Score, Traffic Level, Events ,Business Activity}
These datasets power:
Heatmaps Forecast charts Safety indices Business hotspot rankings City alerts
Challenges we ran into
1. Visualizing Complex Urban Data
Turning raw city data into simple, readable dashboards required careful UX planning.
2. Designing Predictive Models Creating realistic forecast logic required modeling trends such as: Future Crowd Level=Current Density+ Historical Trend+ Event Impact
3. Balancing Simplicity and Power The biggest challenge was building something powerful while keeping it simple enough for everyday users.
Accomplishments that we're proud of
Built an interactive smart city dashboard with heatmaps, charts, and alerts.
Simulated real-time city data for crowds, safety, traffic, and events.
Created a safety index and predictive crowd forecasts for smarter decisions.
Highlighted business hotspots for opportunities.
Designed a futuristic, intuitive UI that makes complex city data easy to understand.
What we learned
How to design data-driven dashboards that communicate insights clearly
How to visualize large urban datasets using maps and charts
How predictive thinking can improve city planning and personal safety
How design systems, UX flow, and storytelling are critical for impact
What's next for Urbanpulse AI
Integrate real-time IoT and sensor data for fully live city insights.
Add AI-powered predictions for crowds, safety, and traffic.
Expand to multiple cities with scalable dashboards.
Introduce mobile apps and notifications for on-the-go guidance.
Partner with city authorities and businesses to turn insights into action.
Built With
- chartjs
- gemini
- netlify
- react
- typescript


Log in or sign up for Devpost to join the conversation.