6ixth Sense
Tagline
6ixth Sense turns raw urban data into informed planning decisions by combining live traffic simulation with AI-powered construction impact analysis directly on the map. Place a building, see which roads are affected, and get a report grounded in real network metrics and Toronto regulations.
The Problem
Planners and developers often work with limited context. They lack tooling to:
- See how a new building affects traffic before permits or commitments.
- Know which roads and segments are inside or near the footprint.
- Get impact analysis that uses the actual road network and congestion, not generic templates.
- Check compliance against Toronto guidelines (TIS, CMP, traffic disruption, noise) in one place.
The Solution
6ixth Sense brings structured, actionable insight to the moment you place a building:
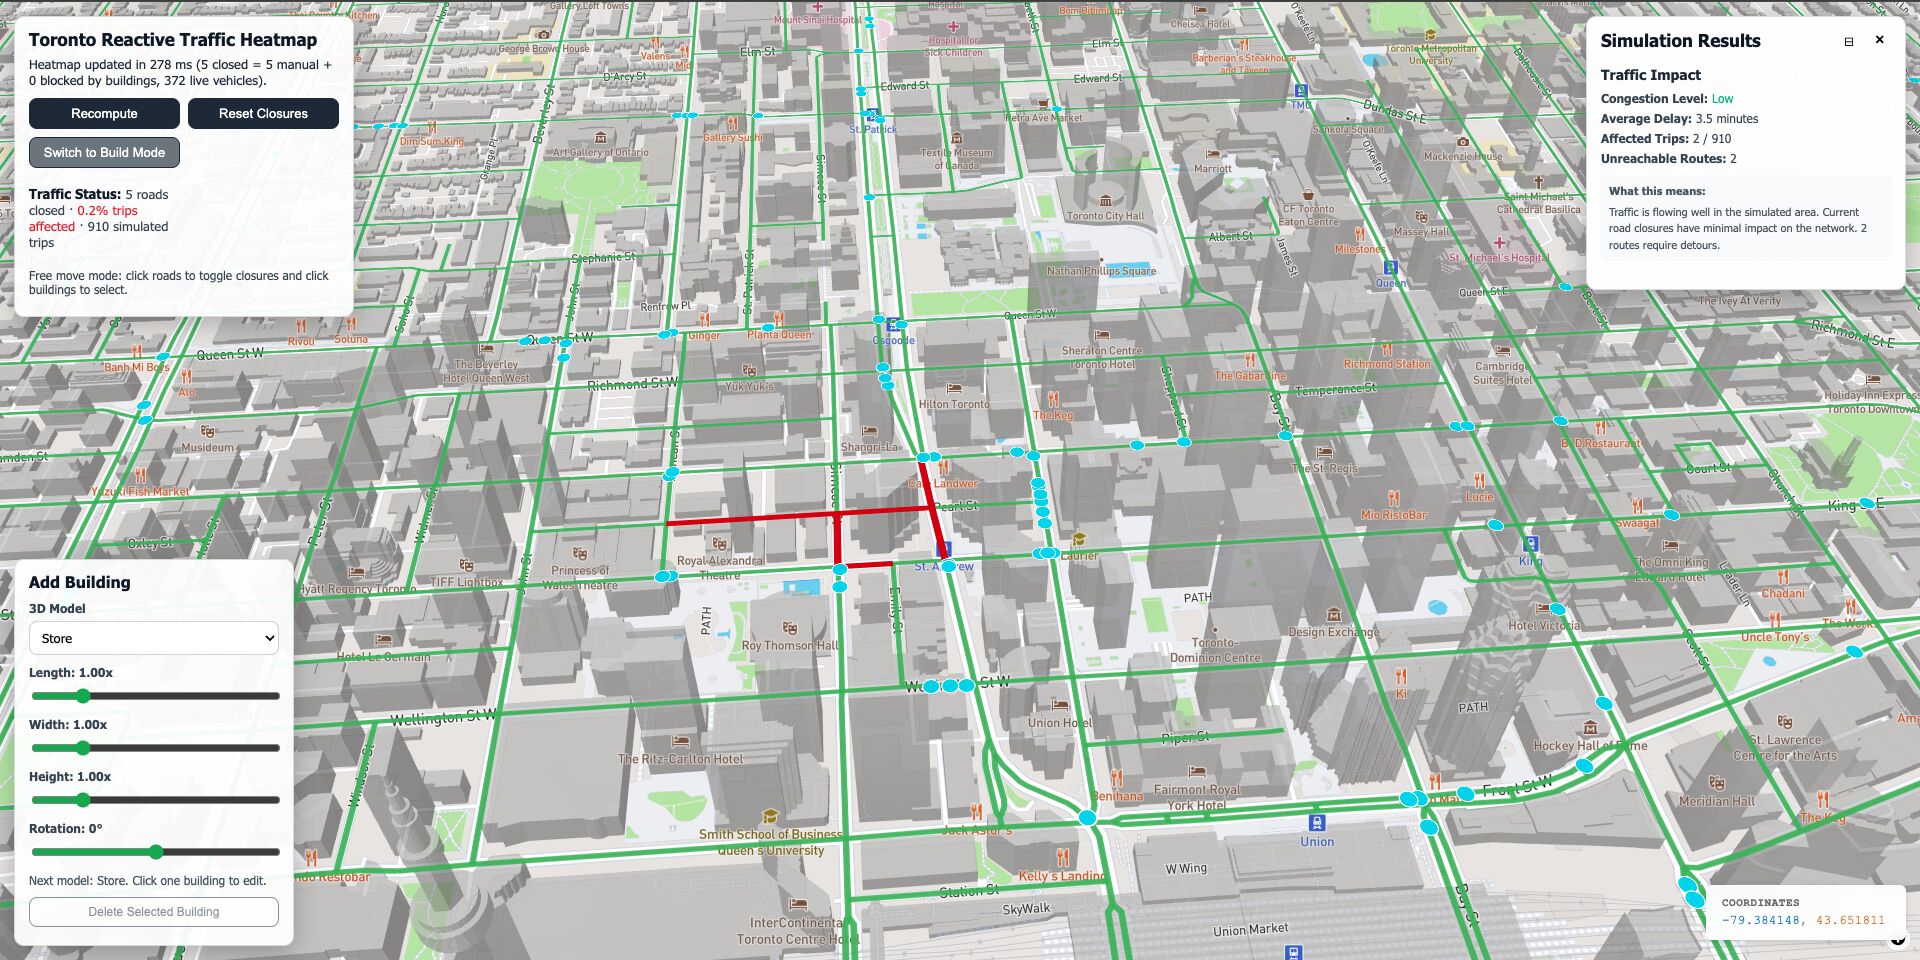
- Interactive Map: Downtown Toronto with real road geometry (MapLibre GL).
- Live Traffic Simulation: Synthetic Origin-Destination \( OD \) assignment, BPR-style congestion functions, and a congestion heatmap. Toggle road closures and recompute in near real-time.
- Building Placement: Click-to-place or draw a polygon with 3D extrusions, adjustable height, and footprint.
- Automatic Road-Impact Detection: Polygon–line intersection detects which roads are inside or cut by the building footprint.
- Live Network Context: For each building, view nearby roads including name, type, distance, volume, \( V/C \) (Volume/Capacity) ratio, and delay. It provides a baseline vs. post-closure traffic summary and suggested closures based on lane configurations.
- AI-Powered Impact Report: Backboard.io RAG + Gemini 2.5 Pro, fed with network context and construction details (duration, lane closures, work hours, dust/noise controls), returning traffic, environmental, economic, and regulatory sections.
- Toronto-Grounded Analysis: RAG over TIS Guidelines, CMP, Traffic Disruption Management, noise bylaws, and related documents ensures answers cite specific thresholds and sources.
Everything is in one flow: place a building, optionally run the simulation, hit “Analyze Construction Impact,” and get a report that uses the real graph and your inputs instead of generic text.
Built With
- React + TypeScript + Vite
- MapLibre GL (Vector tiles, 3D buildings, draw controls)
- Express (Building storage, spatial analysis API)
- Backboard.io (RAG + OpenRouter -> Gemini 2.5 Pro for impact analysis)
- Supabase (Optional — Projects/Buildings/History)
- Synthetic Traffic Model (Road graph from GeoJSON, Dijkstra routing, BPR-style assignment, congestion heatmap)
- Toronto Regulatory Docs (TIS, CMP, traffic disruption, noise, etc.) ingested for RAG
Inspiration
Planners and developers often work in the dark. We realized that while cities are complex, living systems, the tools used to plan them are often static and disconnected. Stakeholders lack the tooling to:
- See how a new building affects traffic before permits are even filed.
- Know which roads and segments are immediately impacted by a building's footprint.
- Get impact analysis grounded in actual road network data rather than generic templates.
- Check compliance against specific Toronto guidelines (TIS, CMP, traffic disruption, noise) in a unified interface.
We wanted to bridge the gap between raw urban data and actionable planning decisions.
What it does
6ixth Sense brings structured, real-time insight to the moment you place a building on the map. The workflow is seamless:
- Interactive Mapping: Users explore a 3D Downtown Toronto map with real road geometry.
- Live Traffic Simulation: The app runs a synthetic simulation using Origin-Destination \( OD \) assignment and BPR-style congestion functions to generate a live heat map. Users can toggle road closures and recompute traffic flow in near real-time.
- Building Placement & Detection: Users can click-to-place or draw a polygon with 3D extrusions. The system automatically performs polygon–line intersection to detect exactly which roads are inside or cut by the footprint.
- Live Network Context: For every building, we calculate precise metrics: nearby road names, types, distances, volumes, delay times, and the Volume/Capacity \( V/C \) ratio.
- AI-Powered Impact Report: We feed this network context + construction details (duration, lane closures, dust controls) into Gemini 2.5 Pro via Backboard.io.
- Toronto-Grounded Analysis: The AI performs RAG (Retrieval-Augmented Generation) over official documents—TIS Guidelines, CMP, and noise bylaws—to generate a report that cites specific thresholds and regulatory sources.
How we built it
We built 6ixth Sense using a modern full-stack approach focused on spatial analysis and AI integration:
- Frontend: Built with React, TypeScript, and Vite for a fast, responsive UI.
- Mapping: We used MapLibre GL for rendering vector tiles, 3D building extrusions, and handling complex draw controls.
- Backend: An Express server handles building storage and the spatial analysis API.
- Traffic Modeling: We implemented a synthetic traffic model that processes the road graph from GeoJSON, utilizes Dijkstra’s algorithm for routing, and applies standard BPR functions to calculate congestion and delays:
$$t = t_0 [1 + \alpha(V/C)^\beta]$$
- AI & RAG: We utilized Backboard.io to orchestrate the RAG pipeline, connecting OpenRouter to Gemini 2.5 Pro. We ingested Toronto regulatory PDFs (TIS, CMP) so the model could reference specific local bylaws.
Challenges we ran into
- Spatial Intersection Logic: Accurately detecting which road segments intersected with arbitrary user-drawn polygons was mathematically challenging. We had to ensure the polygon–line intersection logic was robust enough to handle complex building footprints without crashing the client.
- Simulation Performance: Running Dijkstra routing and traffic assignment on a browser-based map for a dense urban grid is computationally expensive. Optimizing the BPR calculations to run in near real-time required careful state management.
- RAG Context Precision: Ensuring the AI didn't just hallucinate regulations but actually retrieved specific clauses from the Toronto TIS and CMP documents required fine-tuning our chunking strategy in Backboard.io.
Accomplishments that we're proud of
- Real-Time Feedback Loop: We successfully connected the "drawing" of a building to an immediate recalculation of traffic metrics (the \( V/C \) ratios), effectively gamifying the urban planning process.
- Localized AI Analysis: The generated reports don't just sound smart—they are actually legally relevant to Toronto, citing specific noise bylaws and traffic management guidelines.
- 3D Visualization: Getting the 3D extrusions to render smoothly alongside the live traffic heatmap layers makes the tool feel like a professional engineering suite.
What we learned
- Urban Engineering is Math-Heavy: We learned a massive amount about traffic engineering, specifically how Volume/Capacity \( V/C \) ratios and traffic assignment models determine the flow of a city.
- The Power of Contextual AI: Providing the AI with "hard" data (exact road volumes and distances) leads to significantly higher quality output than just asking it to "assess the impact" based on a generic prompt.
- Map Data Complexity: Working with raw GeoJSON and vector tiles taught us the importance of cleaning and structuring spatial data before trying to run algorithms on it.
What's next for 6ixth Sense
- Real-World Sensor Integration: Moving from synthetic \( OD \) assignment to ingesting live traffic API data for even higher accuracy.
- Exportable Compliance Reports: Generating formal PDF reports that planners can directly submit to the City of Toronto.
- Multi-City Support: Abstracting the regulatory RAG layer to support other cities by simply swapping the ingested bylaw documents (e.g., Vancouver or NYC).


Log in or sign up for Devpost to join the conversation.