-

Logo
-

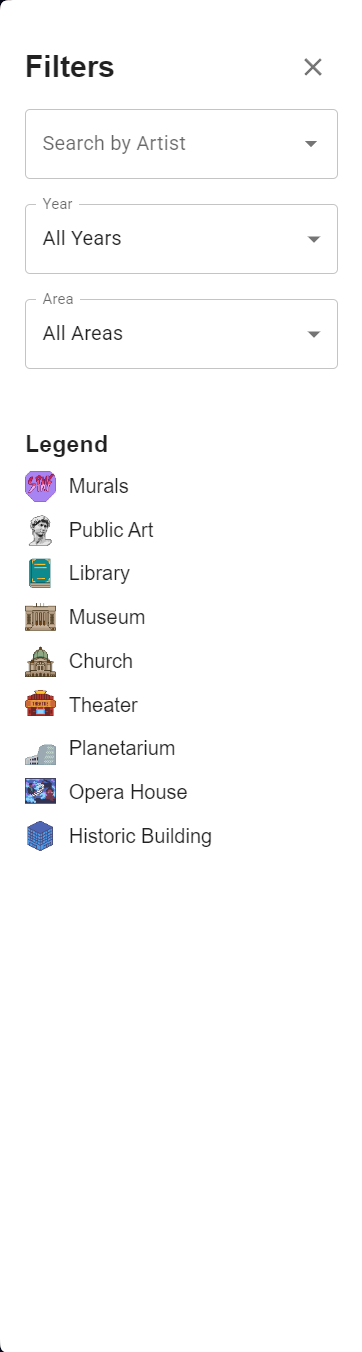
Filter and Legend
-
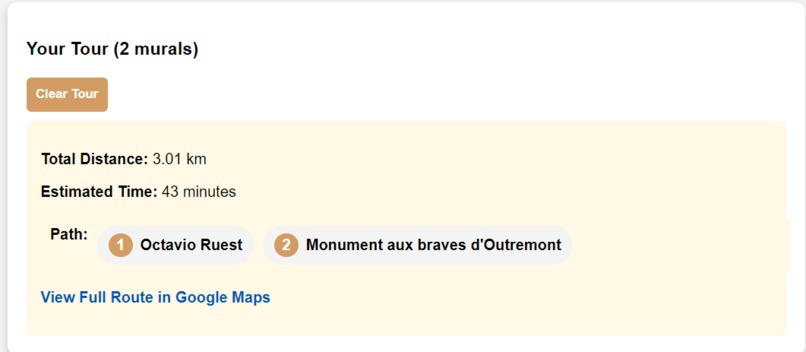
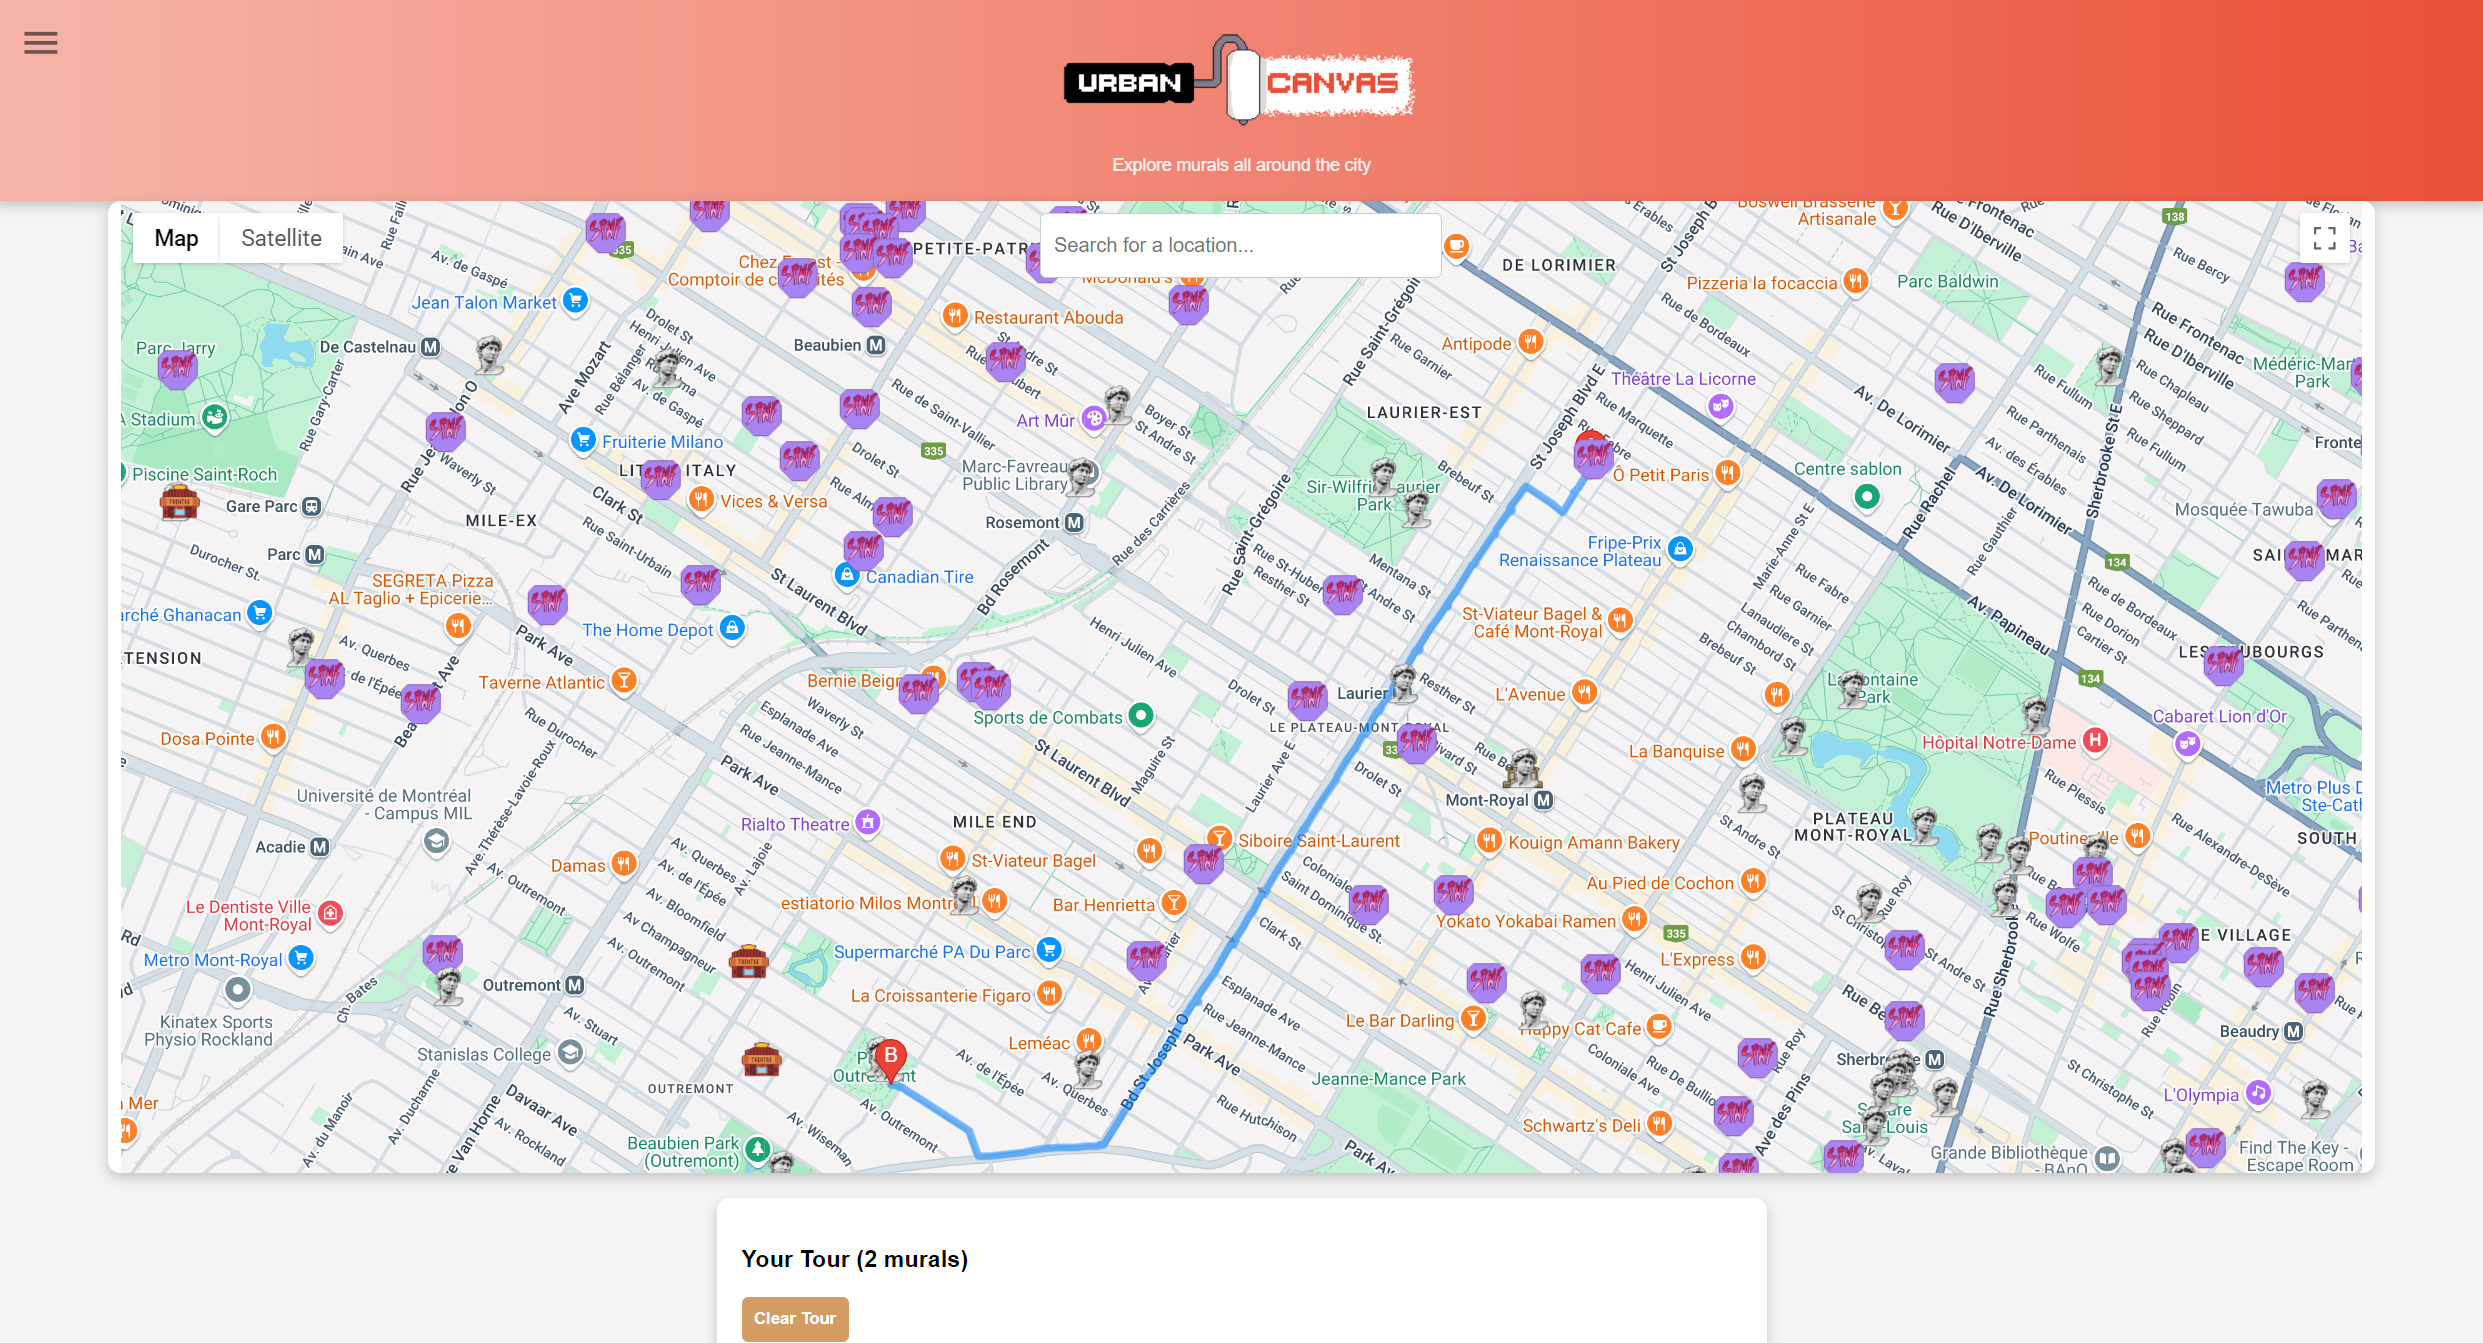
Tour view
-
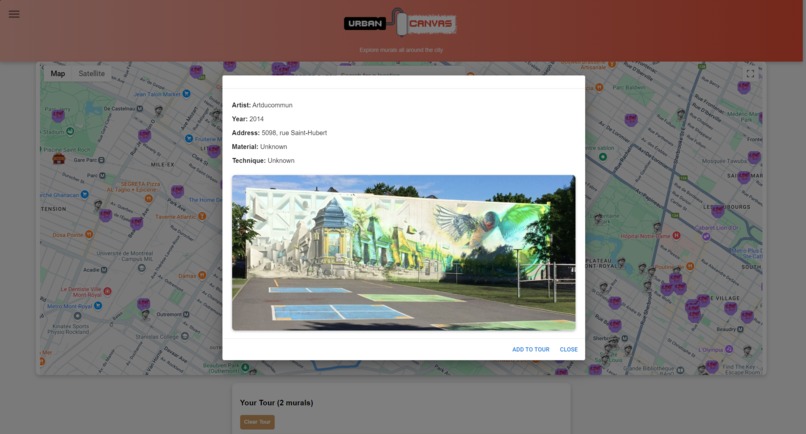
Mural view
-
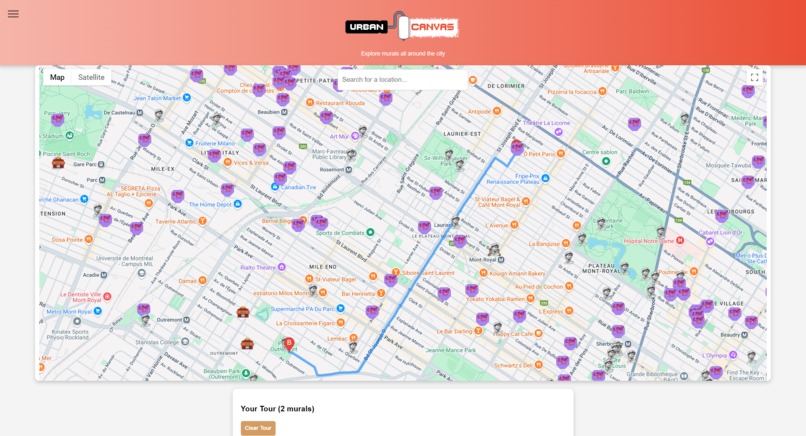
Overall View


Inspiration
Seeing MLH’s incentive to use MongoDB we decided to do DRW's challenge of using large datasets. After searching through the city of Montreal's public database, we chose 3 datasets that interested us: subsidized murals, inventory of all public art and municipal cultural sites. We wanted to use these four as we felt that the data would provide an interesting lens to look at the city through. After more brainstorming we landed on the idea of visualising the data in a web app. We felt that it could deliver a user-friendly experience to citizens or tourists who would like to see parts of Montreal that make up its culture.
What it does
The web app allows users to interact with data provided by google maps. It plots all of the city’s murals, public art and all buildings with both modern and historic cultural significance on a map.
A user can:
- Sort between all the murals, public art, and significant landmarks in the city.
- Filter the categories by artist, year, area (the 19 boroughs of Montreal) and type.
- Click on the pins on the map to view more details about the artwork or place.
- Generate the fastest route to complete a custom tour of the city.
How we built it
Database: MongoDB Frontend: react.js Backend: node.js Libraries: Google Maps
Used chatgpt for quick code refactors, reformatting, and generating conventional code to save a lot of time
Challenges we ran into
One of the data sets we wanted to use was protected sites. We felt that it would have elevated the app’s experience but given the limited time we had to lower our scope. We had annoying problems with react’s dependencies. We learned that we should have just used leaflet, instead of google maps, as using their api is not cheap. Opted by caching Unfortunately some of these data sets are old, data inconsistency on many of the items. Dealing with data encoded in utf-8
Accomplishments that we're proud of
No merge conflicts, smooth integration
What we learned
We learned how to connect our MongoDB database with Google Map's api.
What's next for UrbanCanvas
Our web app has potential to be more efficient using leaflet as the map library. Although the insights gained from viewing the data in this way is interesting, adding more relevant datasets to the map will increase the amount of options and custom routes a user can make.


Log in or sign up for Devpost to join the conversation.