-
-
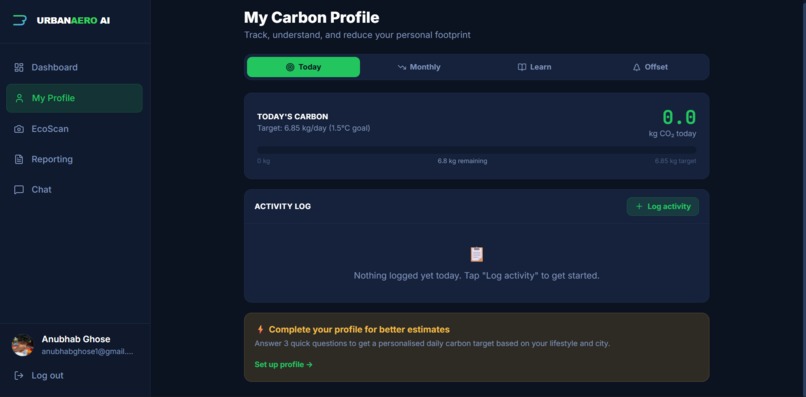
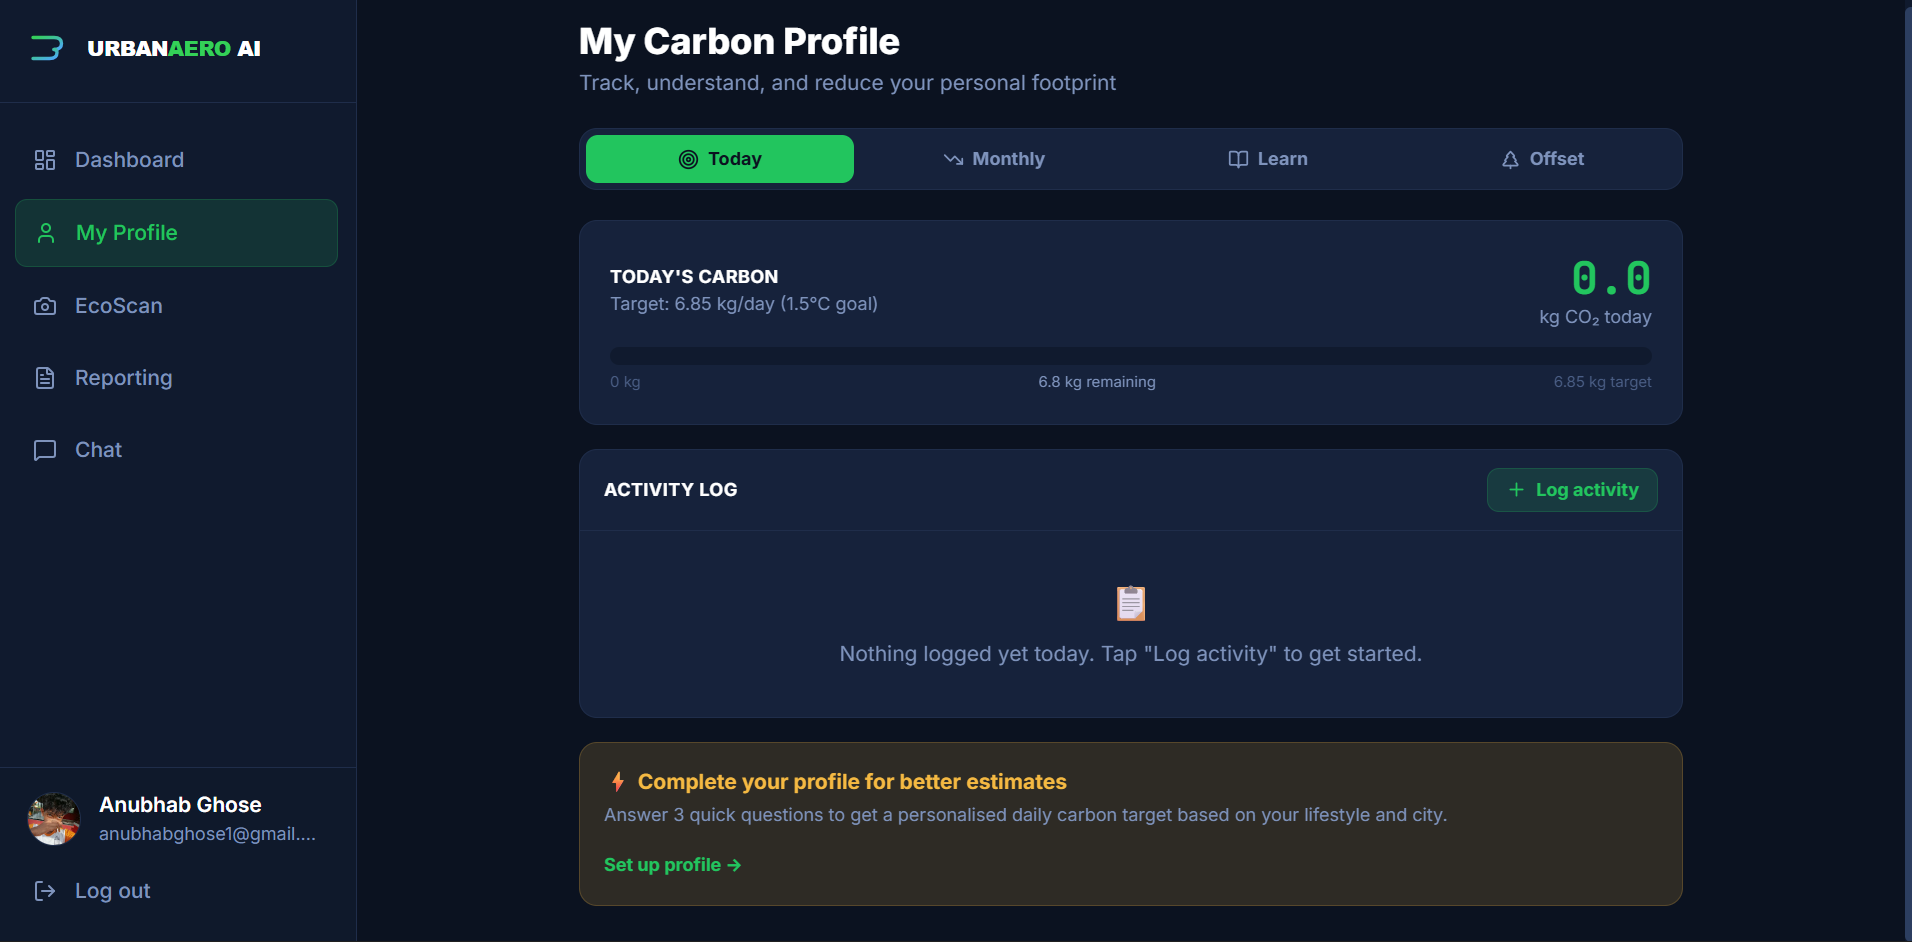
Personal Profile Page
-
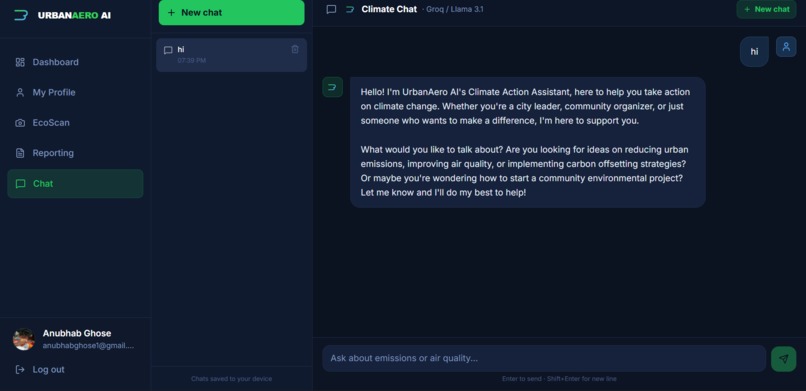
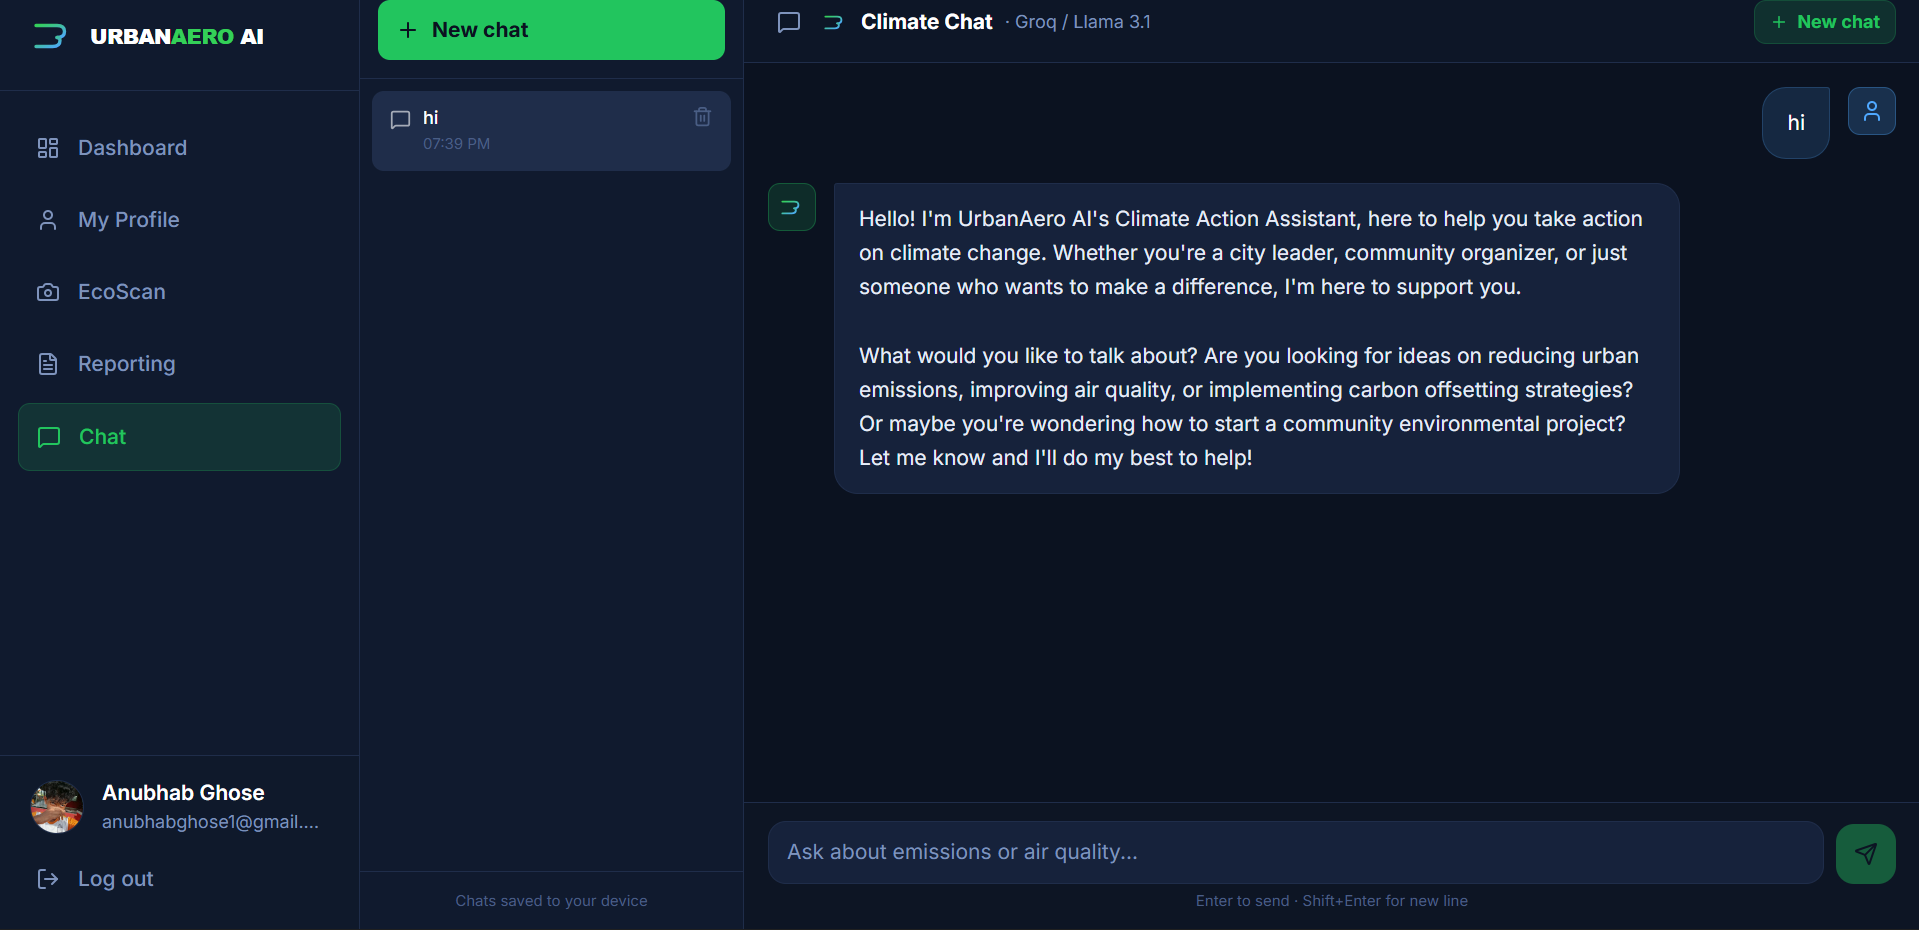
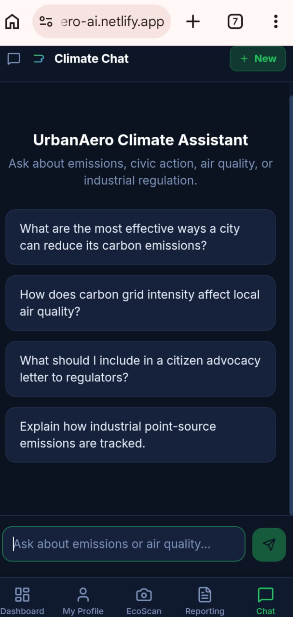
ChatBot Page
-
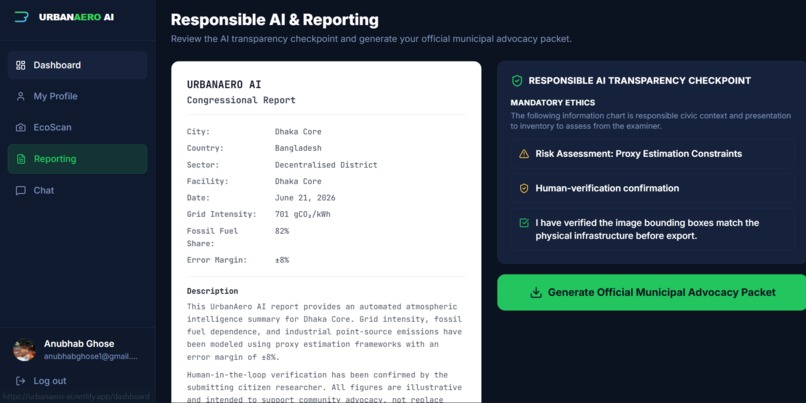
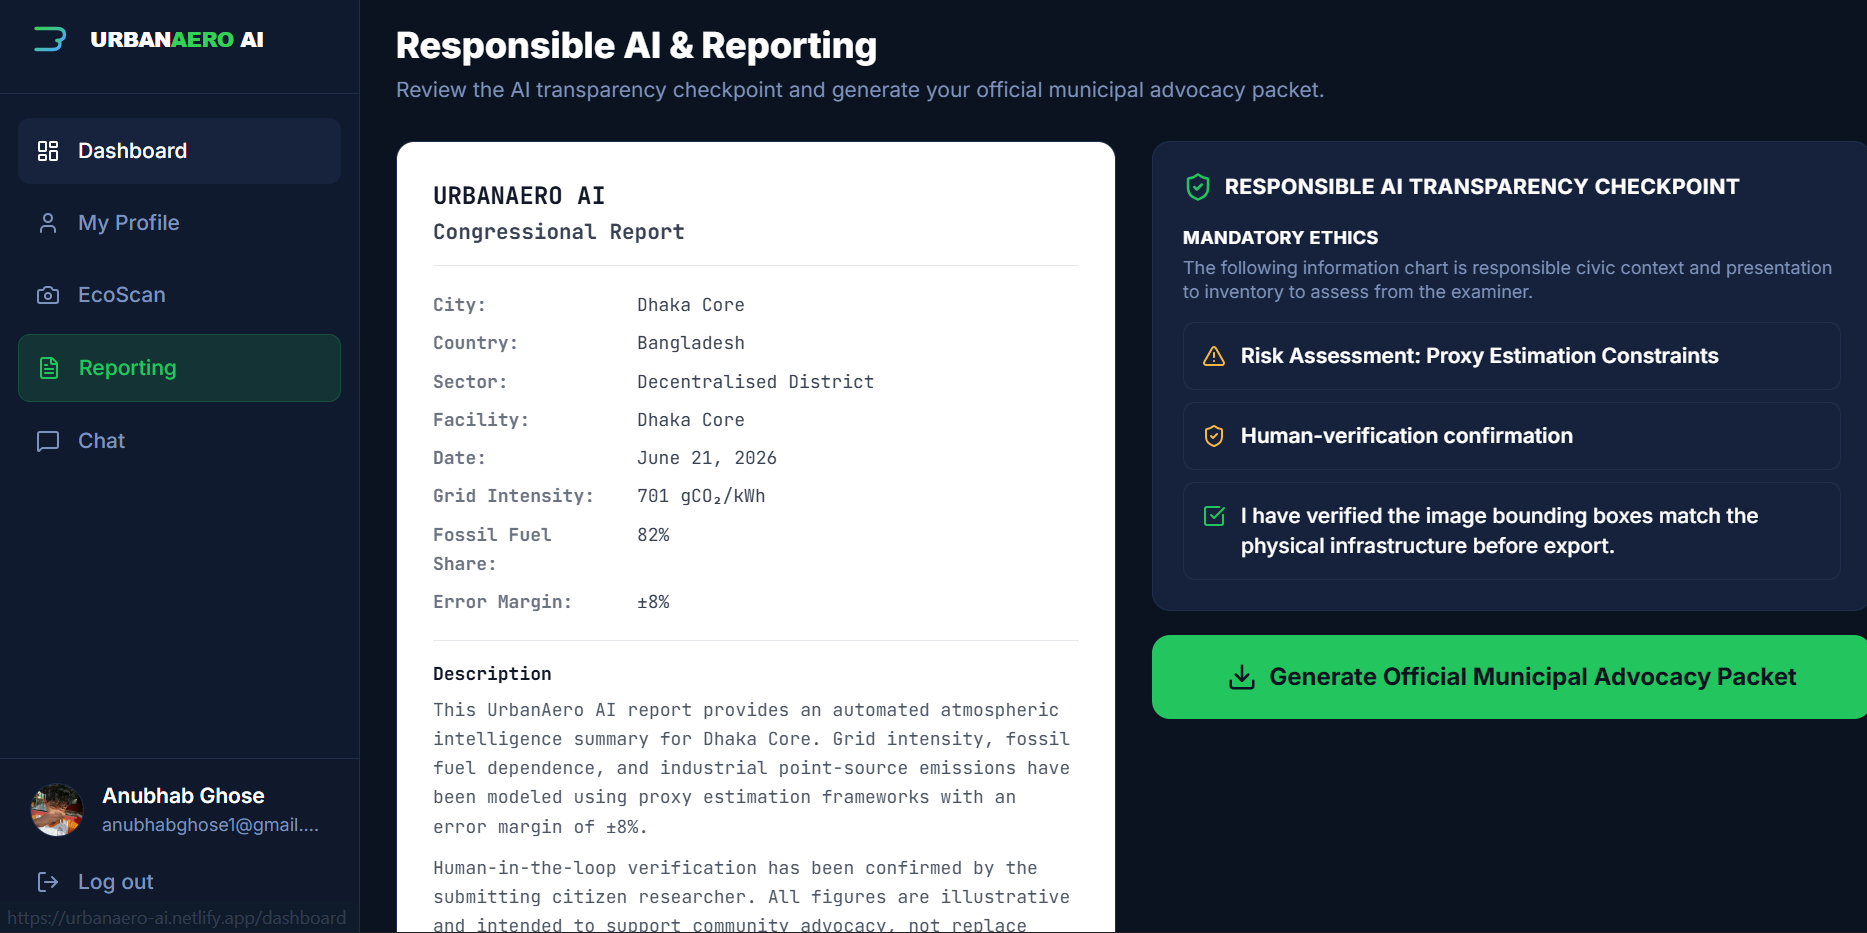
Reporting Page
-
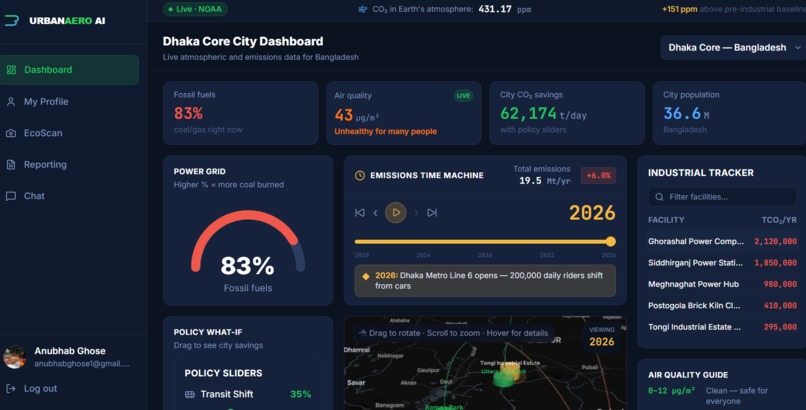
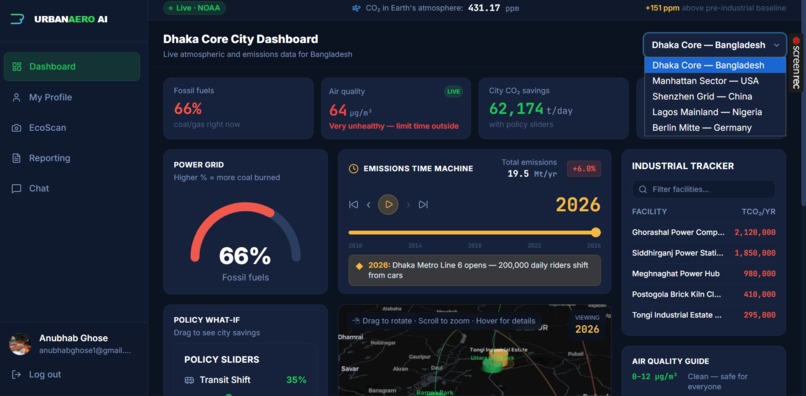
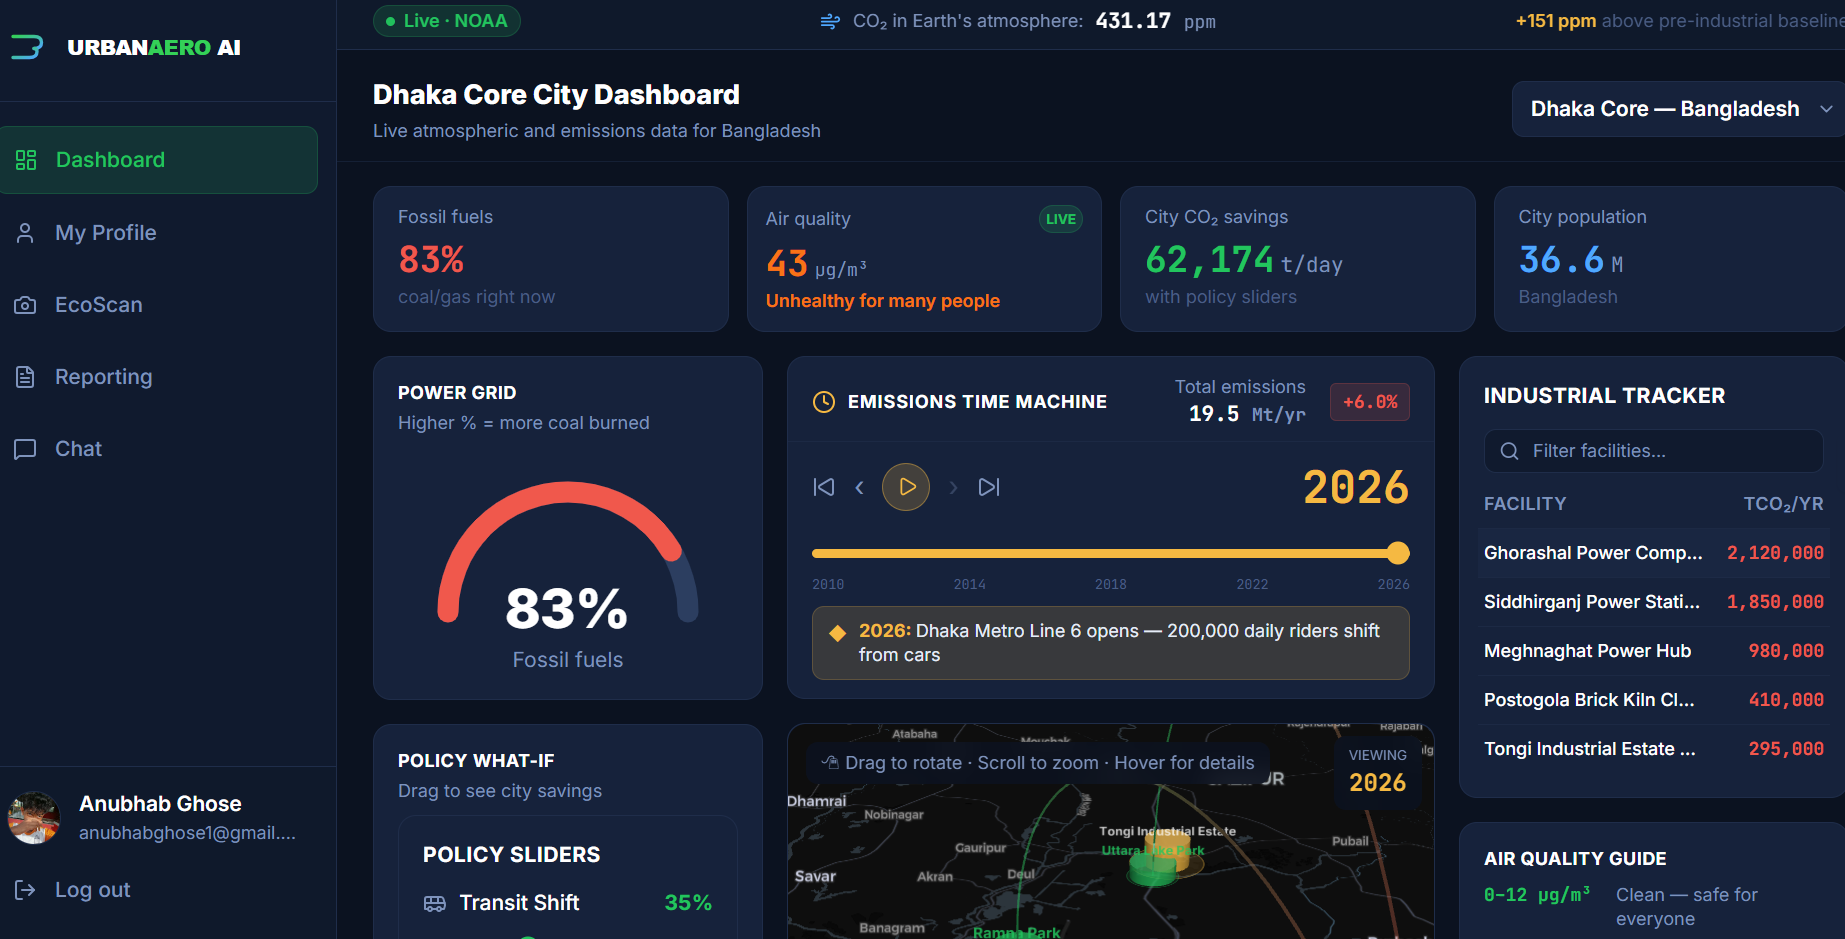
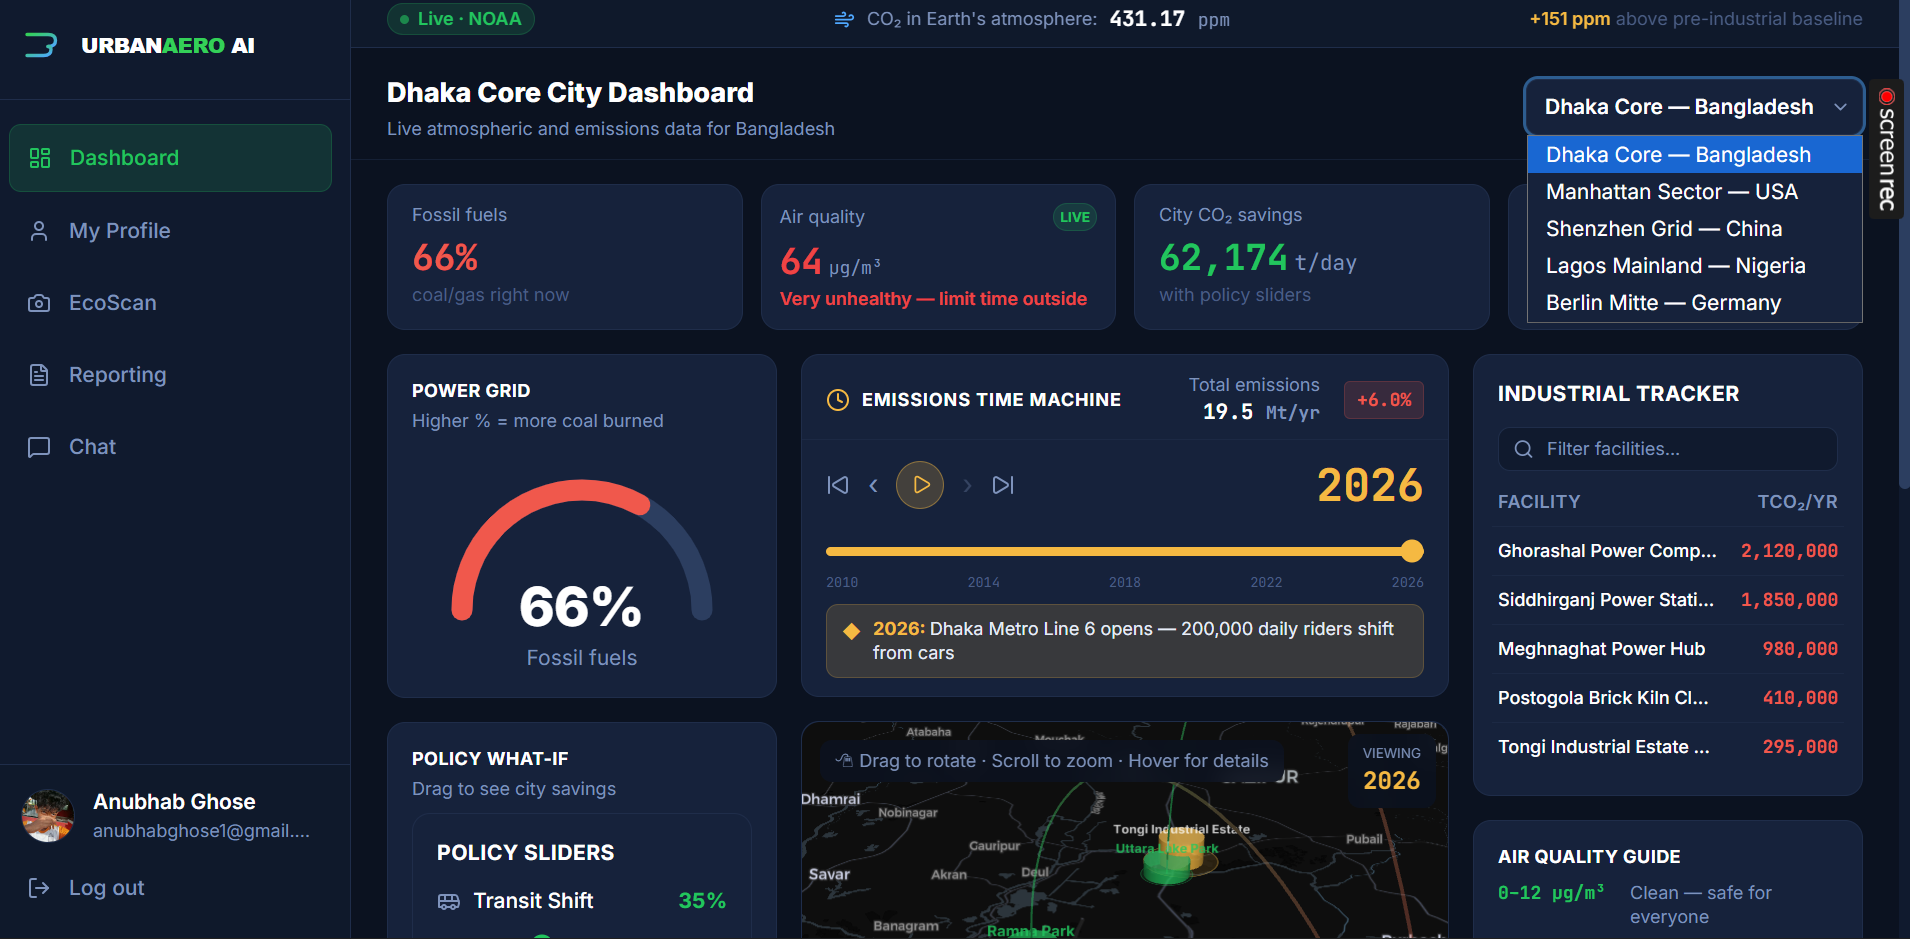
Dashboard Page(Dhaka)
-
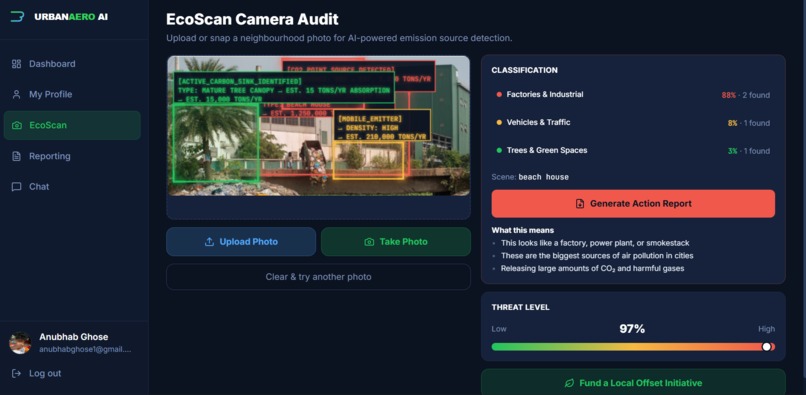
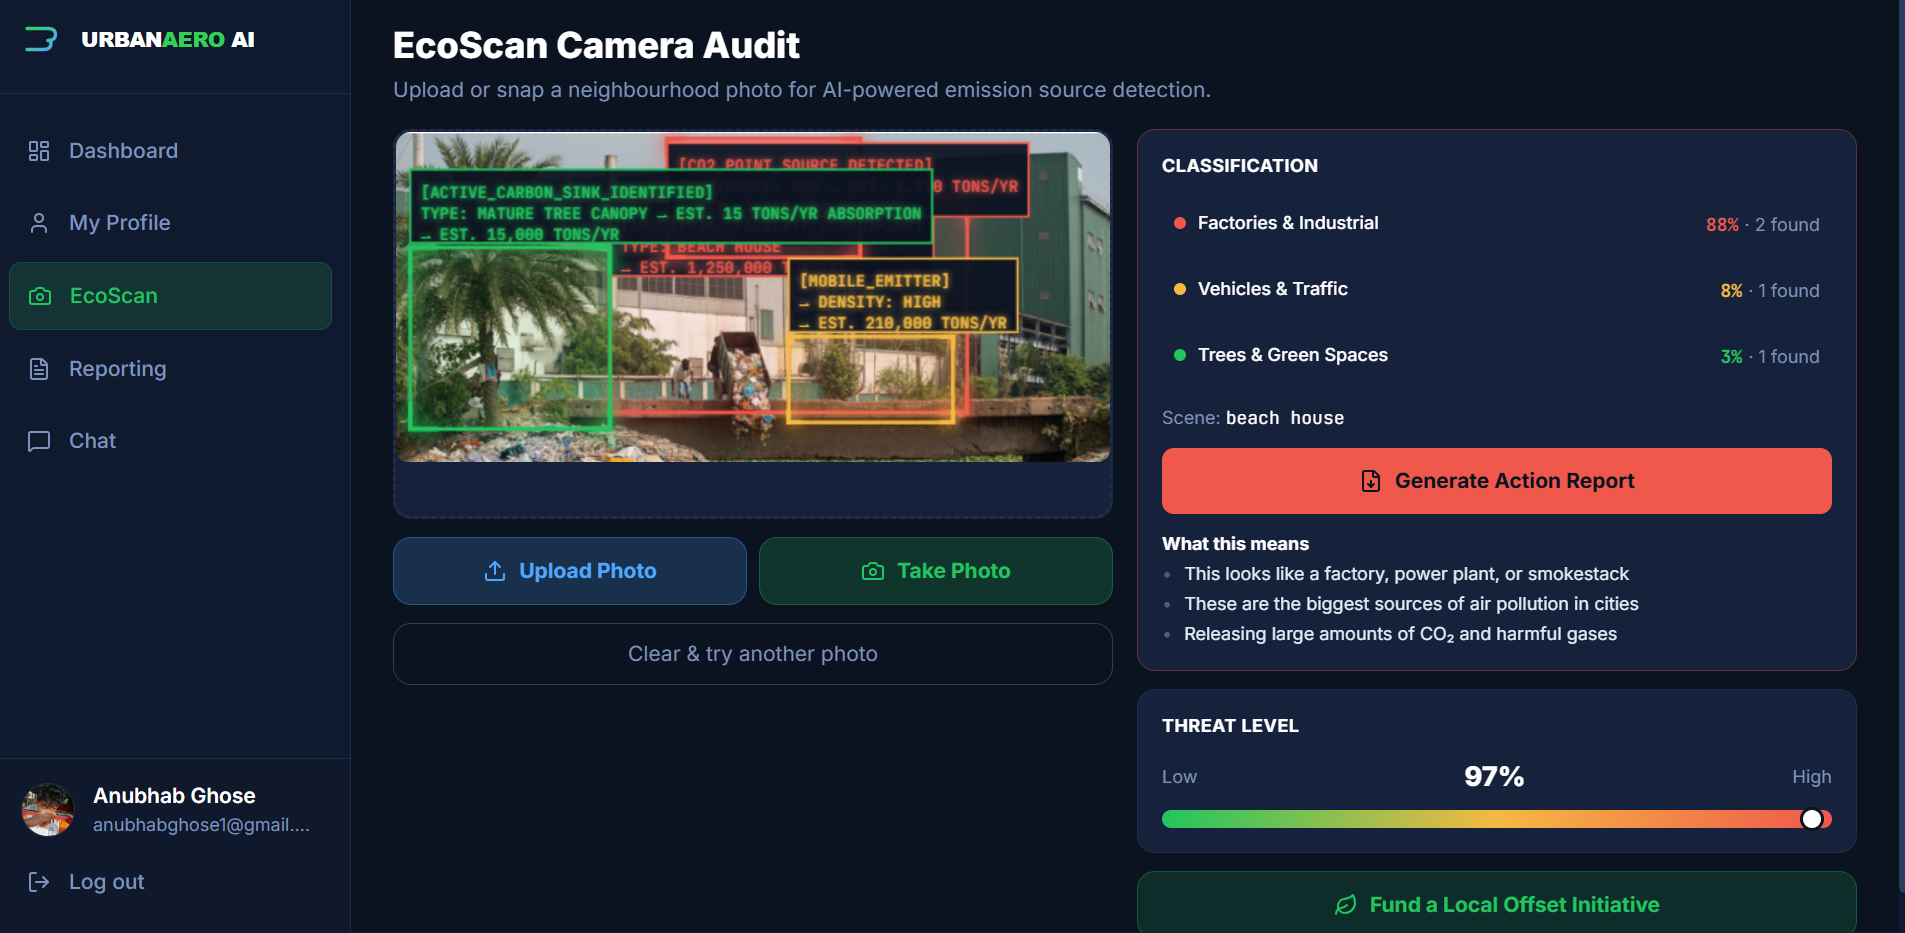
EcoScan Page
-
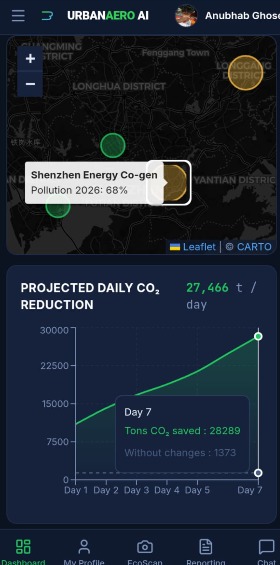
Dashboard Page
-
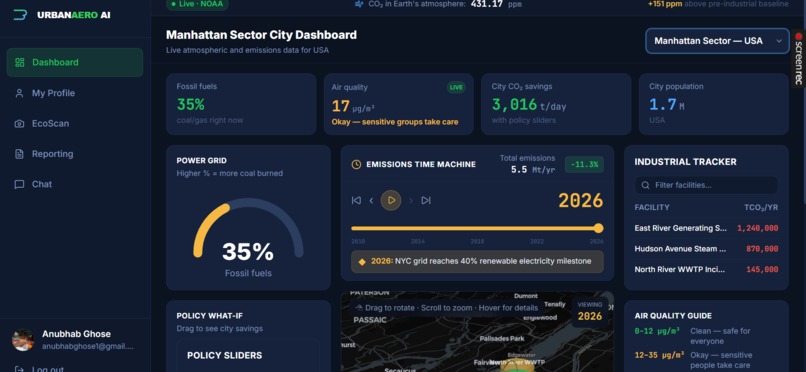
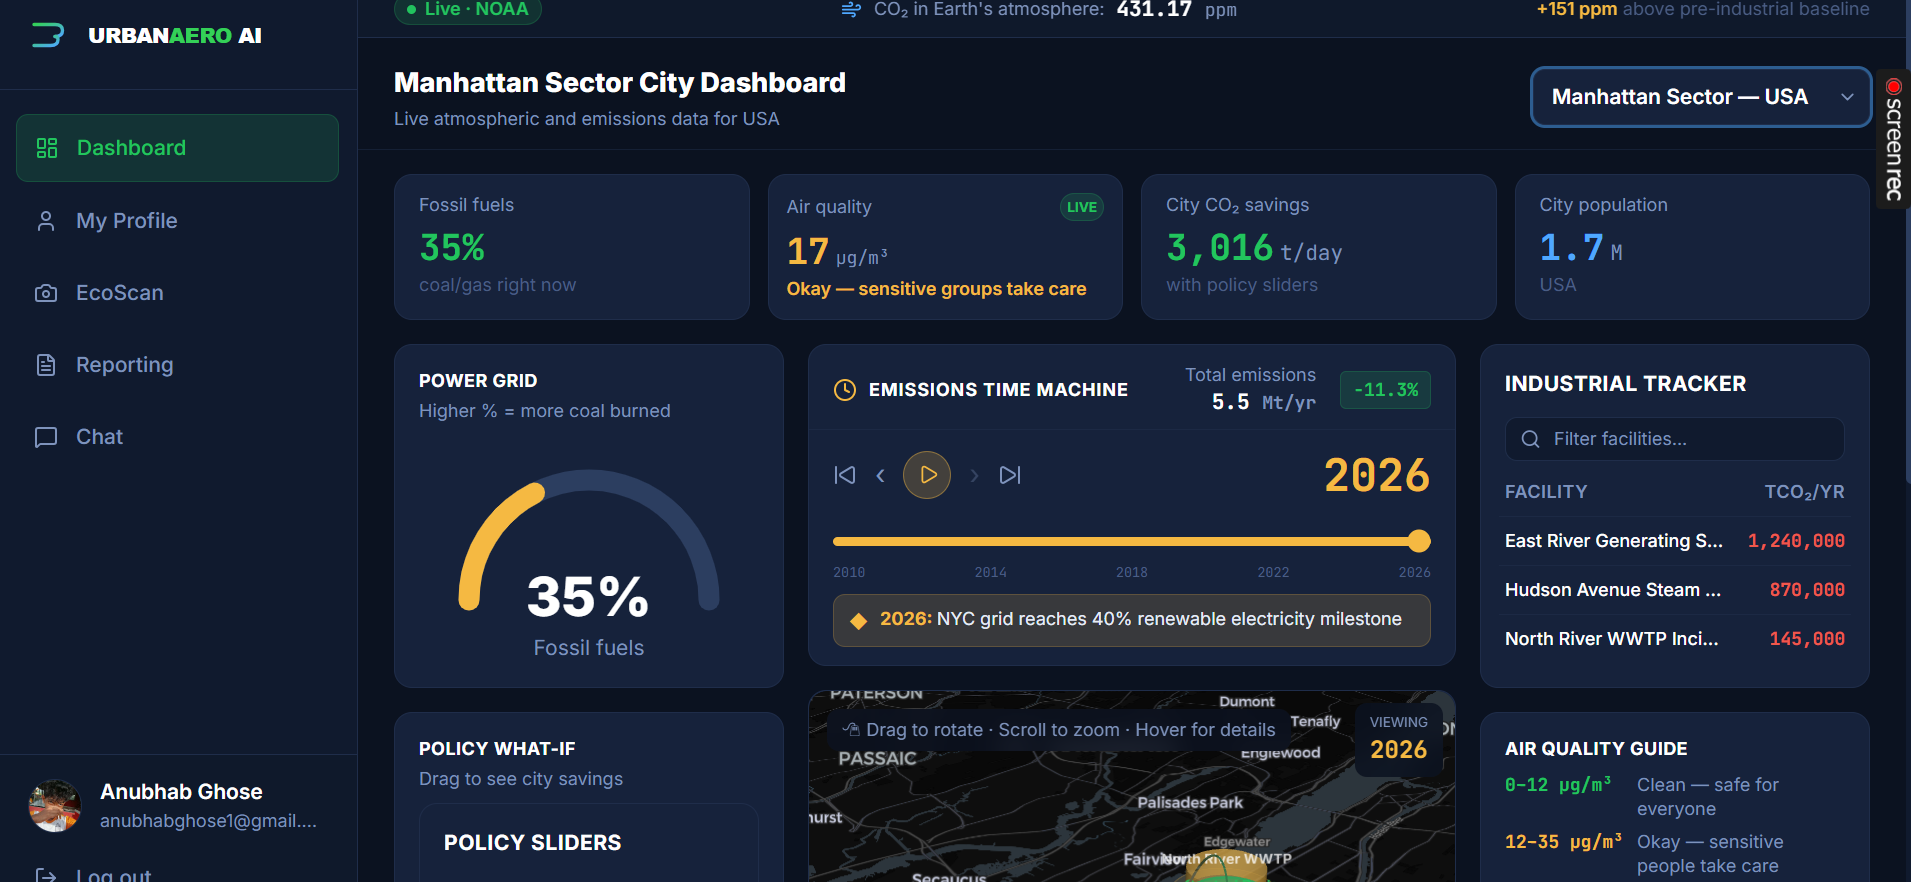
Dashboard Page(Manhattan City)
-
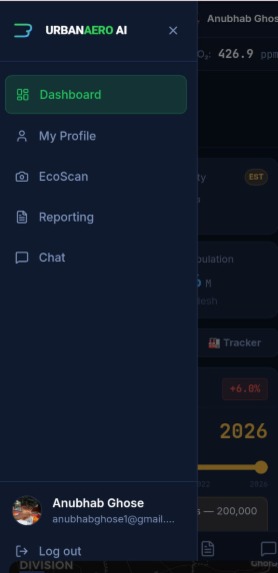
Phone Layout Sidebar
-
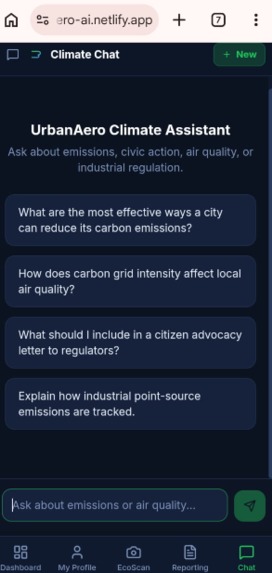
Phone Layout Chatbot Page
-
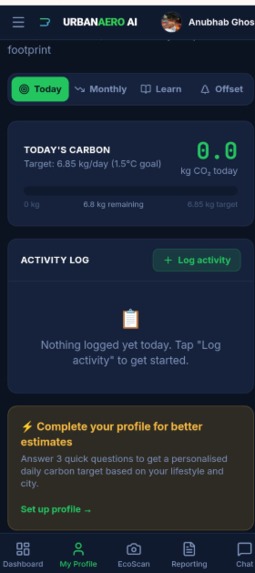
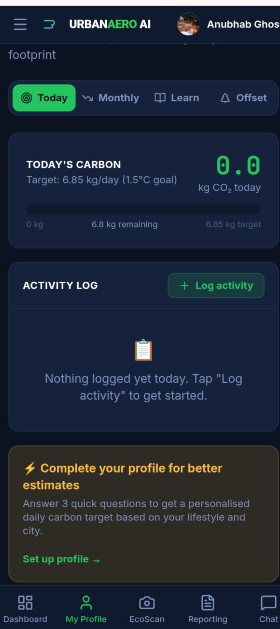
Phone Layout My Profile Page
-
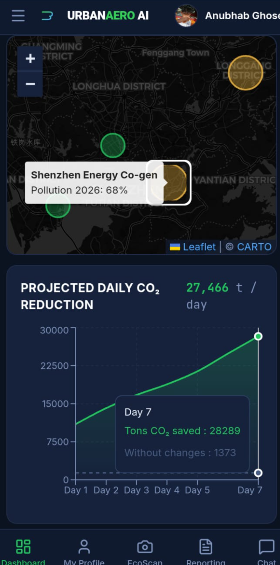
Phone Layout Dashboard

Inspiration
The idea for the UrbanAero AI actually came from a deeply personal observation. Well Dhaka is the city where I grew up and it is known as one of the most polluted cities in the world, and I only watched the sky turn grey every winter as the brick kilns, power plants and millions of combustion vehicles filled the air with invisible poison. Yet most people affected by this pollution had no tools to understand it, measure it, or fight back against it.
This led me to ask a question: "Why do global climate dashboards show planetary CO2 averages, but a citizen standing next to a factory smokestack has no way to document what they're seeing and turn it into action?"
The gap between macro atmospheric intelligence(satellite data, global ppm readings, industrial emission registries) and local civic action(neighborhood audits, community letters, personal behavior change) felt the most important problem I could try to solve in this hackathon.
What it does
UrbanAero AI is a web app that helps citizens understand and fight air pollution in their city. It shows live CO2 levels from a real NASA/NOAA weather station in Hawaii, and live air quality readings from five cities: Dhaka, Manhattan, Shenzen, Lagos and Berlin. Users can also explore an interactive 3D map of their city showing where the biggest polluters are located, slide through a emission time machine to see how pollution has changed from 2010 to 2026, and use the policy sliders to see how much pollution the city could save if more people took buses or offices turned off their lights at night. The EcoScan feature lets anyone take a photo of a factory, traffic jam or park and the AI will identify what it sees, draws boxes around pollution sources and generate an official letter they can send to environmental regulators. There is also a personal carbon tracker where users log their daily meals, travel, and shopping to see their carbon footprint, a climate chatbot for further questions and a reporting page that generates professional documents for community groups to use in advocacy campaigns.
How we built it
The frontend is build with React19 and Vite, styled with Tailwind CSS, and deployed on Netlify. Navigation is handled by the React Router with six pages and a sidebar that becomes a bottom tab bar on mobile. The 3D city map uses Deck.gl with ColumnLayer extrusions on desktop, and switches to a flat Leaflet map to use it easily. Real Time CO2 is fetched from the NOAA's GML CSV endpoint, and air quality is fetched from the WAQI api, so most features work without any backend running. The backend is a FastAPI server running Pytorch with a ResNet-18 model pretrained on Places365 for scene classification and Ultralytics YOLOv8n for object detection. When YOLO finds no relevant COCO objects in an industrial image. Also colored bounding boxes with labels are drawn to indicate the pollution sources. Authentication uses Firebase with Google OAuth, email/password. The chatbot calls the Groq API to fetch the results of the messages of the users. PDF generation for advocacy letters and audit reports uses jsPDF client side. The what if emissions model uses a linear formula comnining the transit shift percentage, city population, commute emission factors, zoning compliance, commercial building count, and HVAC energy factors to produce real time CO2 savings projections.
Challenges we ran into
Making the 3D Deck.gl map usable on mobile required splitting into two completely separate renderers.
Accomplishments that we're proud of
I am proud that the app is genuinely functional, where the camera classifier runs real machine learning inference that points about the pollution sources with bounding boxes, the CO2 banner shows the actual current Mauna Loa reading, and the advocacy PDFs are real documents a community group could send to a regulator today. The Emissions Time Machine turns the 16 years of abstract emissions data into a human story with real events. The personal carbon tracker makes a climate action feel individual and easy to use. Also the chatbot works properly, where it gives you proper responses.
What we learned
I learned that the gap between a working local prototype and a deployable web app is huge, and most of the engineering work lives in the gap. I learned that Zero-shot AI models underperform narrow trained classifiers on the domain specific tasks. Also simplifying languages is way harder than adding features, like renaming "High Point Source Emitter" to "Factory or Industrial Site" required a lot of rethinking on every assumption about the users.
What's next for UrbanAero AI
Connect the Industrial Tracker to the live Climate TRACE API for verified facility data. Build a community audit feed where communities share EcoScan results on a shared neighborhood map, turning individual obsevations into collective evidence. And replace the linear what-if model with a properly calibrated neural proxy simulation whose projections can be cited in actual policy submissions.
Built With
- cartodb
- css
- deck.gl
- fastapi
- groq-api-with-llama-3.1-(chatbot)
- html
- javascript
- jspdf
- maplibre-gl
- netlify
- noaa-global-monitoring-laboratory-(live-co?-data)
- openai-clip-(explored
- openaiclip
- pillow
- places365-resnet-18-(scene-classification)
- python
- python-dotenv
- pytorch
- react-leaflet
- react-router-dom
- react19
- recharts
- tailwind-css
- torchvision
- ultralytics-yolov8
- uvicorn
- vite
- waqi-world-air-quality-index-(live-air-quality)
- yolov8n-coco-(object-detection)

Log in or sign up for Devpost to join the conversation.