-
-
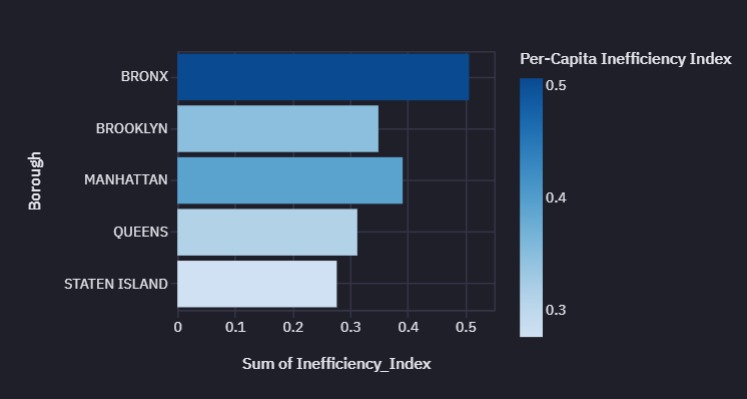
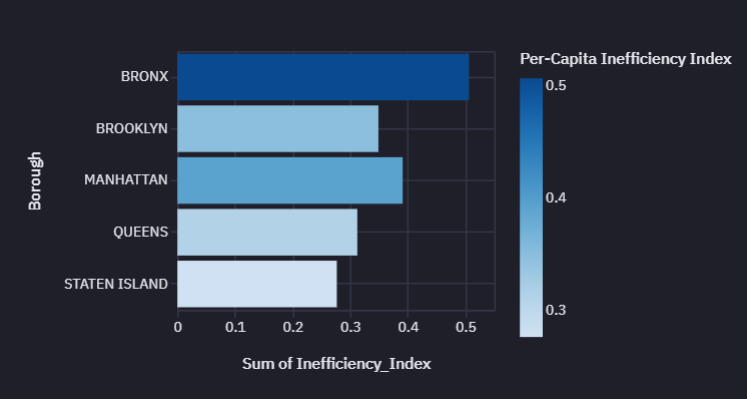
The main chart of analysis
-
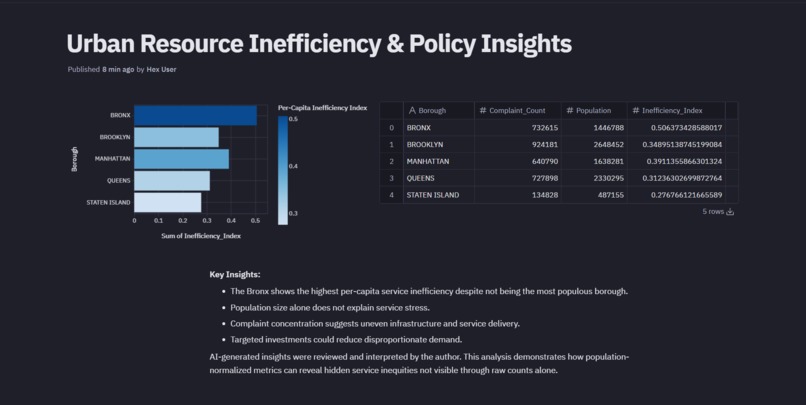
The whole dashboard

Inspiration
Cities generate massive amounts of public service data, but raw complaint counts often fail to reflect true service stress across communities. I was inspired to explore whether population-normalized metrics could reveal hidden inefficiencies in urban service delivery that are not visible through absolute numbers alone.
What It Does
This project analyzes NYC 311 service request data and computes a per-capita inefficiency index by normalizing complaint volume with borough population. The resulting analysis highlights boroughs experiencing disproportionate service demand relative to their population size, providing a clearer lens for policy and resource planning.
How I Built It
I built the project entirely in Hex using Python for data ingestion, cleaning, aggregation, and analysis. NYC Open Data 311 service requests were grouped by borough and merged with official population data. I then derived a custom inefficiency index and presented the results using interactive visualizations and tables through Hex’s App Builder. AI-assisted insights were used to interpret observed patterns and summarize key takeaways.
Challenges I Faced
Working with large, multi-source public datasets required careful data cleaning and schema alignment. Ensuring meaningful normalization while maintaining interpretability was a key challenge. Additionally, learning Hex’s app-building workflow from scratch required iterative experimentation to achieve a clean, presentation-ready interface.
What I Learned
This project reinforced the importance of population-normalized metrics in urban analytics and demonstrated how modern analytics platforms like Hex can rapidly transform raw public data into actionable insights for real-world decision-making.
Built With
- ai-assisted
- hex
- nyc-open-data
- python
- visualization


Log in or sign up for Devpost to join the conversation.