Inspiration
Cities generate enormous amounts of health data but most of it only gets analyzed after an outbreak has already spread. What if residents could contribute anonymous symptom data in real time, and AI could surface patterns before they hit hospitals? Urban Health Pulse represents what future-city public health infrastructure could look like.
What it does
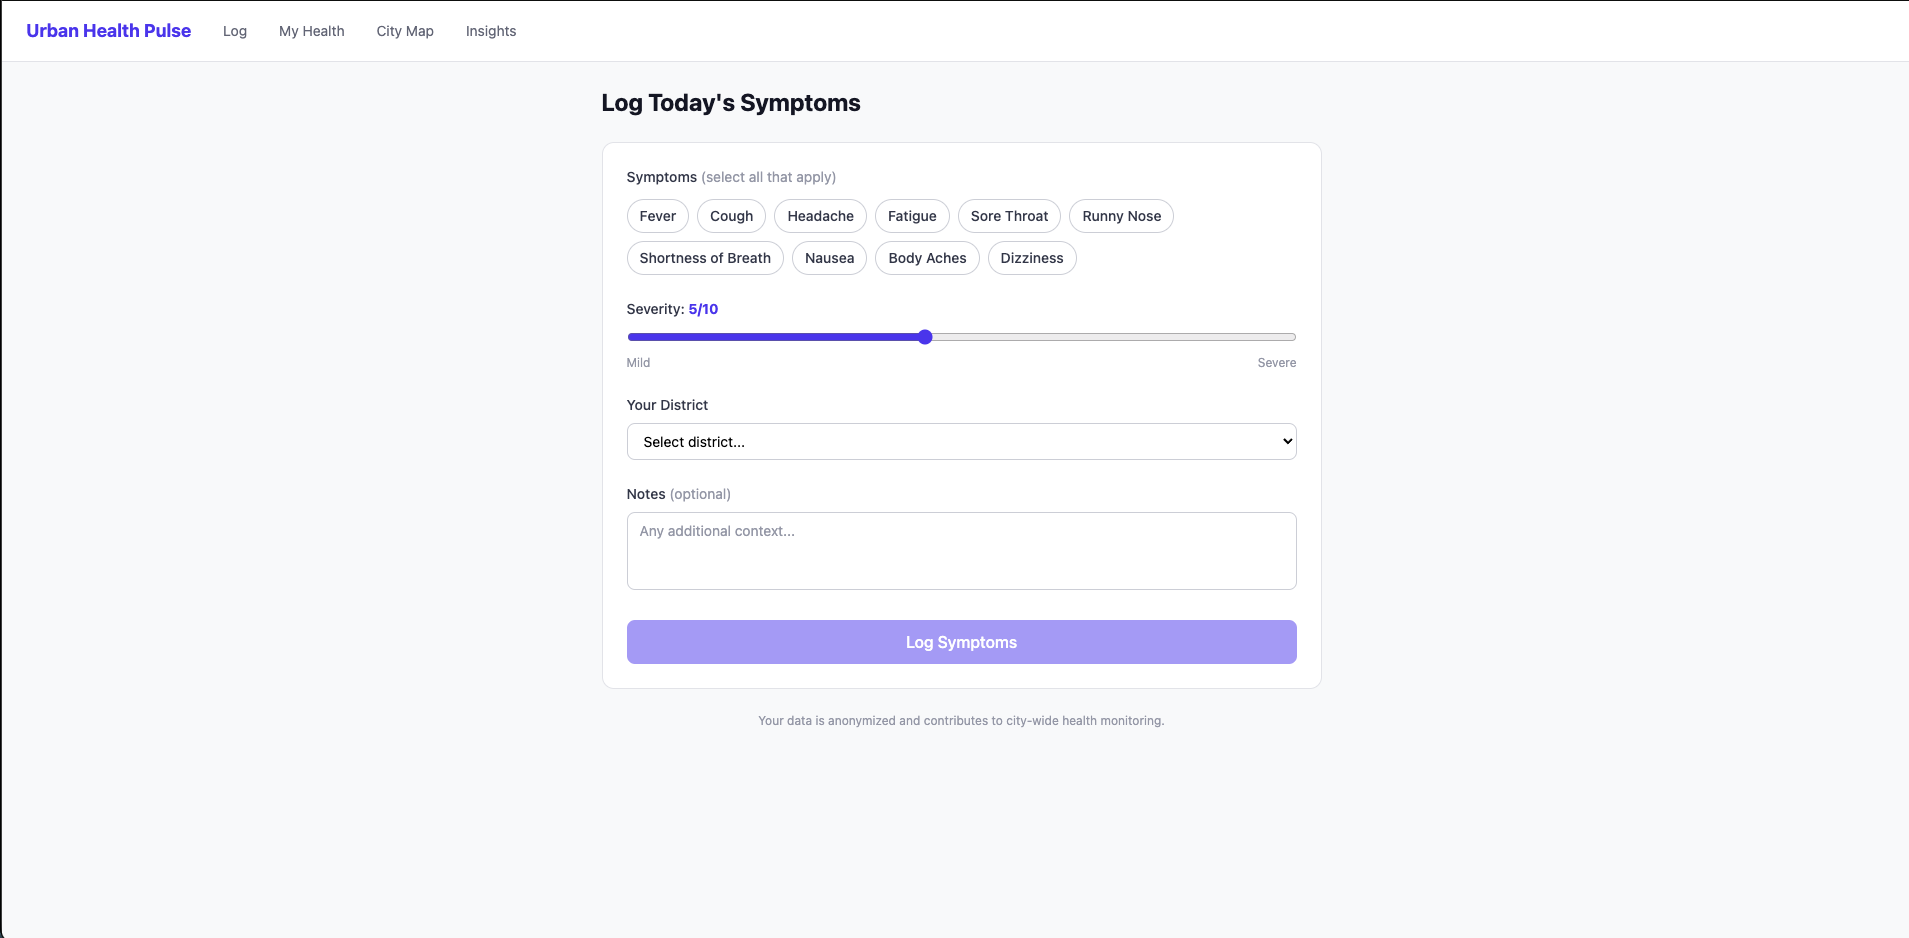
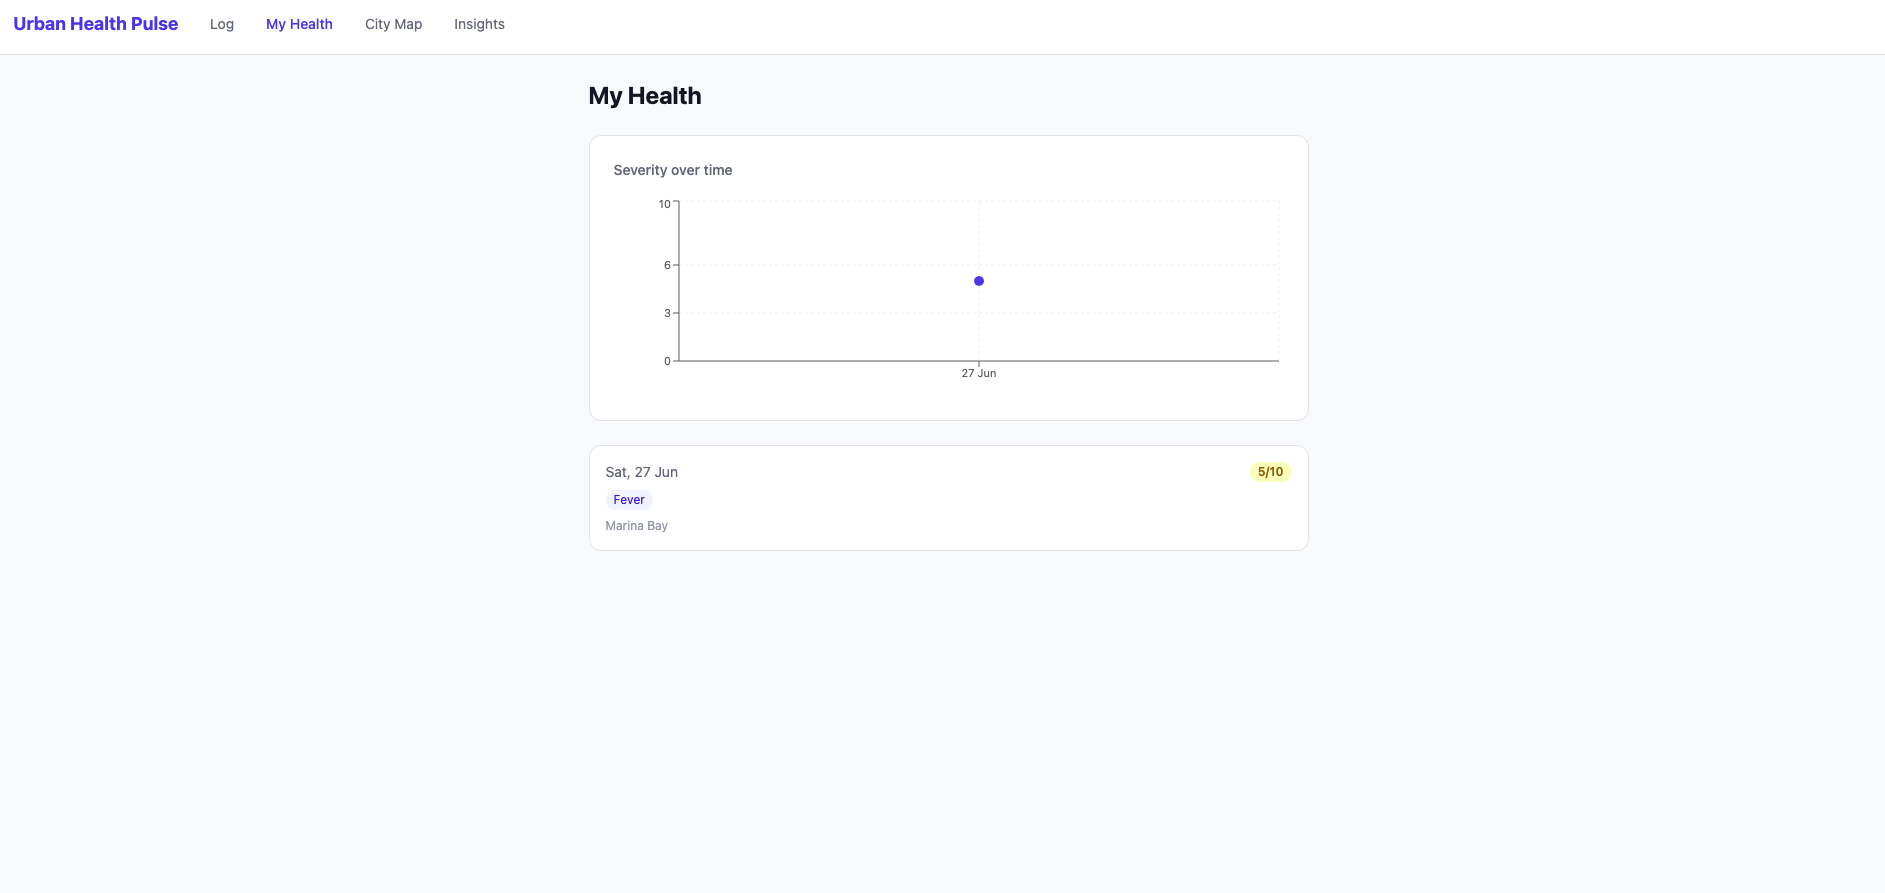
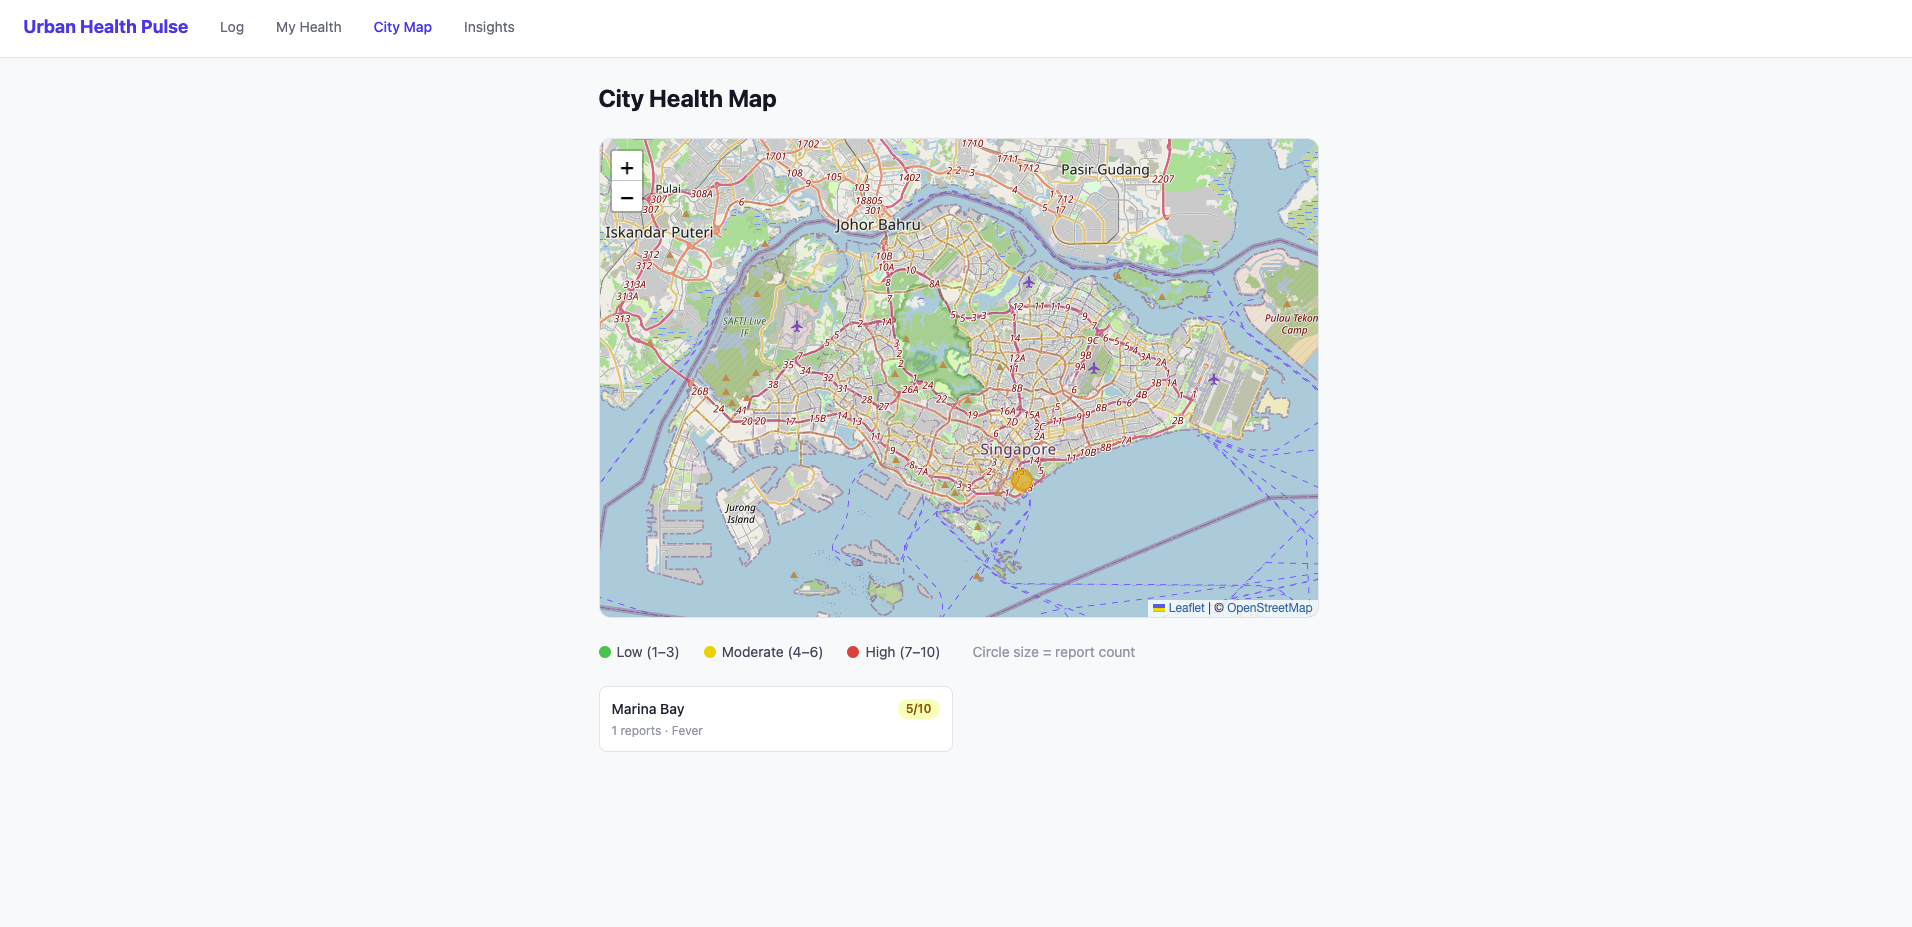
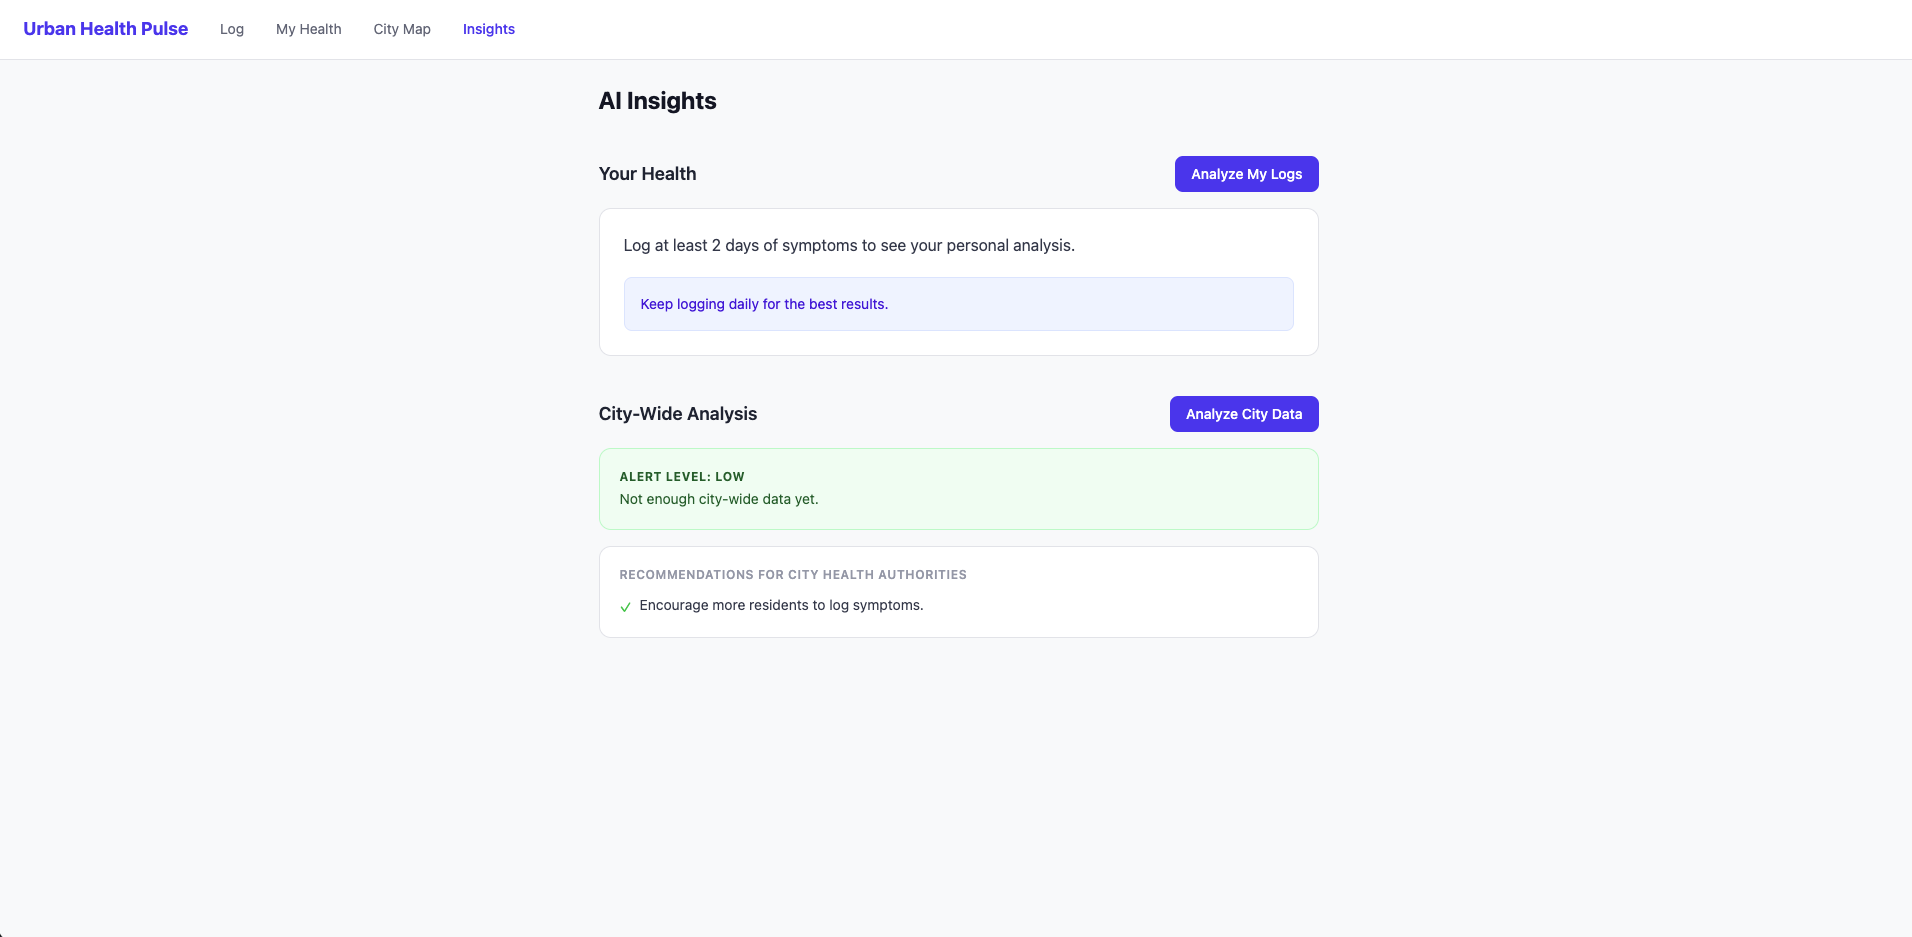
Urban Health Pulse lets residents anonymously log daily symptoms and their district. The app aggregates this data city wide and visualizes it as a live heatmap across Singapore's districts. An AI layer powered by Groq analyzes both personal health trends and city wide patterns, flagging hotspot districts and issuing alert levels with recommendations for public health authorities.
How we built it
Built with a React + Vite frontend and a Node.js + Express backend connected via a REST API. Prisma with SQLite handles data persistence. The city map uses React Leaflet with OpenStreetMap tiles. AI analysis is handled by the Groq API. The app is deployed with Vercel on the frontend and Railway on the backend.
Challenges we ran into
The biggest challenge was time. Because I am working solo and only had 3 days to work with, learning to make fast decisions under pressure and how to fix something properly was important.
What we learned
How to integrate LLM APIs into an app in a way that is useful rather than just a chatbot wrapper.
What's next for Urban Health Pulse
Real authentication, push notifications and integration with public health datasets to verify the reported signals are among some of the features that I could add to this project. On a larger scale, this app has the potential to serve as an early warning system for the public by detecting the early signals of disease outbreaks across the city before they escalate.
Built With
- css3
- express.js
- groq
- html5
- leaflet.js
- node.js
- prisma
- railway
- react
- recharts
- sqlite
- tailwind
- typescript
- vercel

Log in or sign up for Devpost to join the conversation.