-
-
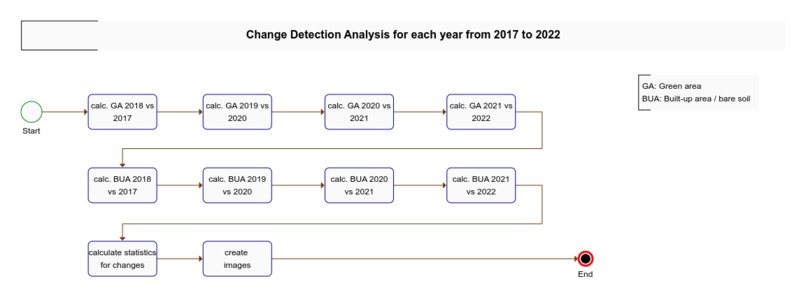
Workflow 1
-
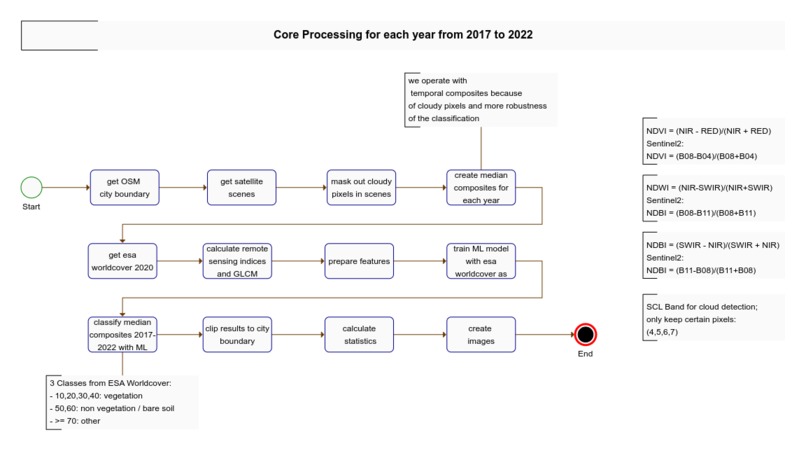
Workflow 2
-
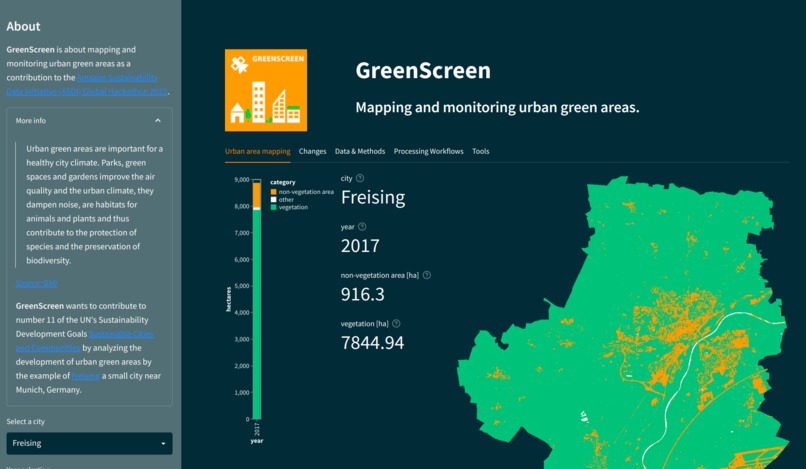
Web app GUI


Inspiration
Urban green areas are very important for urban climate. Local authorities and citizens should have an overview of the development of the urban green areas in their city.
What it does
The goal is to collect and analyze data on urban green spaces and visualize it in an appealing way with interactive maps and graphics so that the resulting information is easy to understand. The methods and outcomes of this project shall be transferable to other cities. This is ensured by a high level of automation of the data processing and the usage of global avaliable datasets.
How we built it
Using AWS SageMaker Studio Labs, Python Processing, ASDI Datasets, Streamlit web app
Challenges we ran into
- RAM resources during numpy related computations - maybe Dask can help here
- methods development take most of the time
Accomplishments that we're proud of
- applied ML classification on global available datasets (training datasets, too!) make the idea transferable to other cities
What we learned
- rasterio WarpedVRT is really the easy way to access COGs!
- rasterio's reshape_as_image and rehape_as_raster are really handy to reshape numpy arrays to ML algorithm input
- Bottleneck is a more efficient cython based drop in replacement for standard numpy computations
- fast-glcm is more easy to compute GLCM features than in scikit image
- GLCM for textures maybe an important feature for prediction
What's next for Urban green areas
- Set up monitoring and transfer the idea to other cities
- change images to real interactive maps and image overlays
- analyze more cities
- make processing chain work with bigger cities
Built With
- amazon-web-services
- bottleneck
- glcm
- numpy
- python
- rasterio
- sagemaker
- scikit-learn


Log in or sign up for Devpost to join the conversation.