Inspiration
Cities face daily challenges like traffic congestion, pollution, delayed public transport, and inefficient waste management. Most of these problems exist because there is no single platform that shows all city data in one place. Urban Eye was inspired by the idea of creating a simple, centralized dashboard that helps both citizens and authorities monitor city conditions in real time.
What it does:
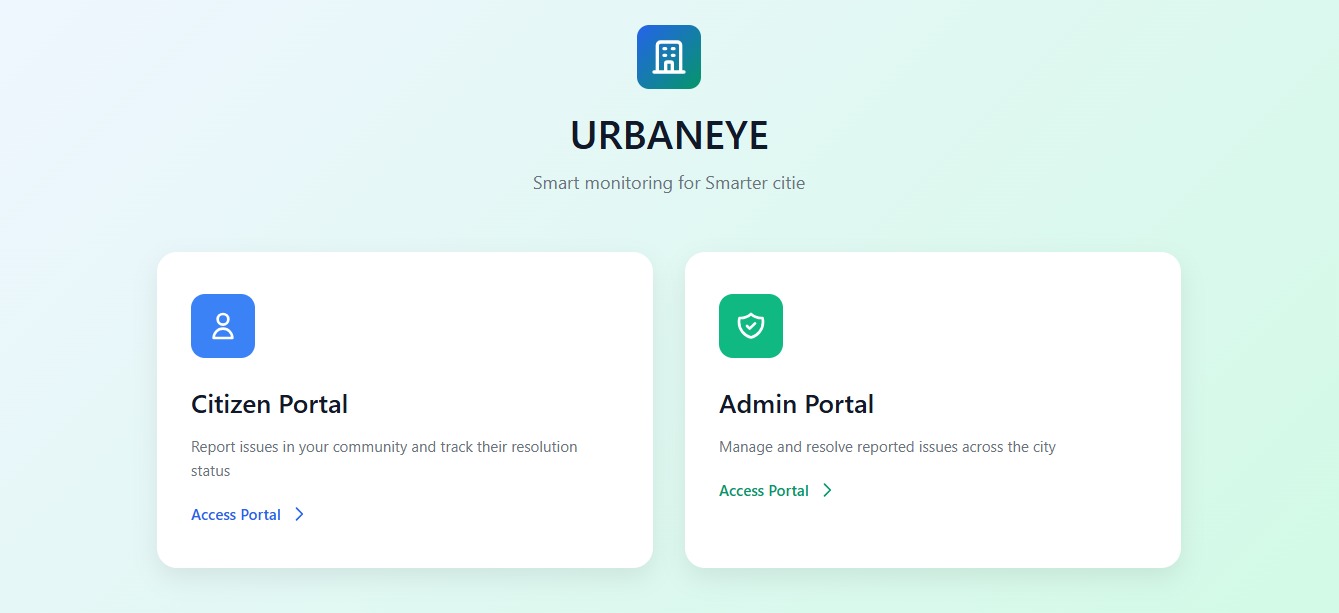
Urban Eye is a smart city dashboard that displays important urban data such as: ->Traffic conditions ->Air quality levels ->Public transport updates ->Waste management alerts
The dashboard presents this information using visual cards, charts, and indicators so users can quickly understand the situation in the city.
How we built it:
We built the project using: ->HTML for structure ->CSS for styling ->JavaScript for interactivity and dynamic updates
Since we didn’t have access to real city sensors, we used simulated data to represent traffic, pollution, and transport conditions. This allowed us to demonstrate how the dashboard would work in a real environment.
Challenges we ran into:
No real-time data: We had to simulate city data instead of using actual sensors. Time limitations: We focused on core features to finish within the hackathon time. Learning curve: Some team members were new to frontend development, so we had to learn and build at the same time.
Accomplishments that we're proud of:
Built a working smart city dashboard prototype. Created a clean and simple user interface. Successfully displayed multiple city services in one place.
What we learned:
Basics of frontend development and UI design. How to visualize data using charts and indicators. The importance of teamwork, planning, and time management.
What's next for URBAN EYE:
** Integration with real-time IoT sensor data. AI-based predictions for traffic and pollution. Mobile app version. Citizen feedback and reporting system.**
Built With
- css
- feature-planning
- google-gemini-3-?-used-for-ideation
- html
- javascript
