

Introduction
The goal to 90% high school graduation rates by 2020 is ambitious. Achieving this goal may be beyond the control of school board and district superintendents and involve substantial community involvement.
This challenge analyzes the community characteristics at the district level. It examines behavioral situations within the community affecting graduation rates.
The challenge was to improve upon the model in the benchmark analysis by digging deeper into the Census data sets. I created a multiple linear regression model using community characteristic data from Census which explains variation in graduation rates at a district level. The challenge also provides an outlier analysis examining a new educational trend and takes a look at a divided community.
Large Districts
Large districts are one of the key drivers in the Grad Nation report. These districts also educate a significant portion of America’s low income and minority students. The report cites these districts as the inflection point for raising high school graduation rates1.
This analysis is focused on the large school districts and its community characteristics. It broadened the definition of a large district to include enrollments greater than 10,000 students. These districts educate 47% of America’s schoolchildren.
While everyone can agree on a 90% graduation goal, the challenge will be greater in the large district communities because there are more varied political interests with different and sometimes conflicting agendas. Because of their sheer scale, these communities can either become the catalysts to reach the 90% goal, or the gatekeepers to maintain the status quo.
Data Sources
I started off with the individual data sets from the required data sets. The data sets used were Graduation_Rates.csv and Max_Tract_Overlap.csv. Key variables include leaid11, and ALL_RATE_1112 which were used as the NCES ID for joining data sets at the district level along with Adjusted Cohort Graduation Rate (ACGR).
I added a new data set from the National Center for Education Statistics. I used the Elementary / Secondary Information System (ELSI) table generator to get the total district enrollments for the school year 2011-12. http://nces.ed.gov/ccd/elsi/. This data set was used to identify the large districts.
Additional data from the Census Bureau’s American Community Survey was added for the analysis. I used the 2012 ACS 5 year estimates. The datasets are categorized by unified school district within each state. These datasets contained the NCES ID which allowed me to match on the required data and the enrollment data. The following lists the data tables used from the American Community Survey
| Table ID | Description |
|---|---|
| S2301 | EMPLOYMENT STATUS |
| S1201 | MARITAL STATUS |
| S0902 | CHARACTERISTICS OF TEENAGERS 15 TO 19 YEARS OLD |
| S0802 | MEANS OF TRANSPORTATION TO WORK BY SELECTED CHARACTERISTICS |
| B11009 | UNMARRIED-PARTNER HOUSEHOLDS BY SEX OF PARTNER |
| B10002 | GRANDCHILDREN UNDER 18 YEARS LIVING WITH A GRANDPARENT HOUSEHOLDER BY GRANDPARENT RESPONSIBILITY AND PRESENCE OF PARENT |
| B14001 | SCHOOL ENROLLMENT BY LEVEL OF SCHOOL FOR THE POPULATION 3 YEARS AND OVER |
| B07001 | GEOGRAPHICAL MOBILITY IN THE PAST YEAR BY AGE FOR CURRENT RESIDENCE IN THE UNITED STATES |
Data cleaning included data type conversions from character values to integer and numeric types. Some ACGR values had “GE” or “LE” prefixes and enrollment data had a “=” prefix. In these cases, the prefix was removed and the numerical value was retained.
The Model
The model is a multiple linear regression. It’s objective is to explain variation in graduation rates among large school districts.
The analysis is focused around the school district’s community characteristics. It uses data from the American Community Survey to identify community behaviors and traits which affect high school graduation rates.
I performed exploratory data analysis visualizations to determine which variables to possibly include in the model. Once the variables were identified, I performed a backward stepwise regression using AIC to validate the predictor variables and a principal component analysis to examine the variance.
Predictor Variables
Married males - Percent of males, 15 and over who are currently married. This excludes married males who are separated. The data is from the American Community Survey marital stats data table S1201.
Transient kids - Children ages 5-17 who live in a different house from one year ago. It is derived by taking the difference between the total number of 5-17 year olds and 5-17 year olds who lived in the same house 1 year ago. This difference is divided by the total number of 5-17 year olds to get the percent of transient kids. The data is from the American Community Survey data table B07001.
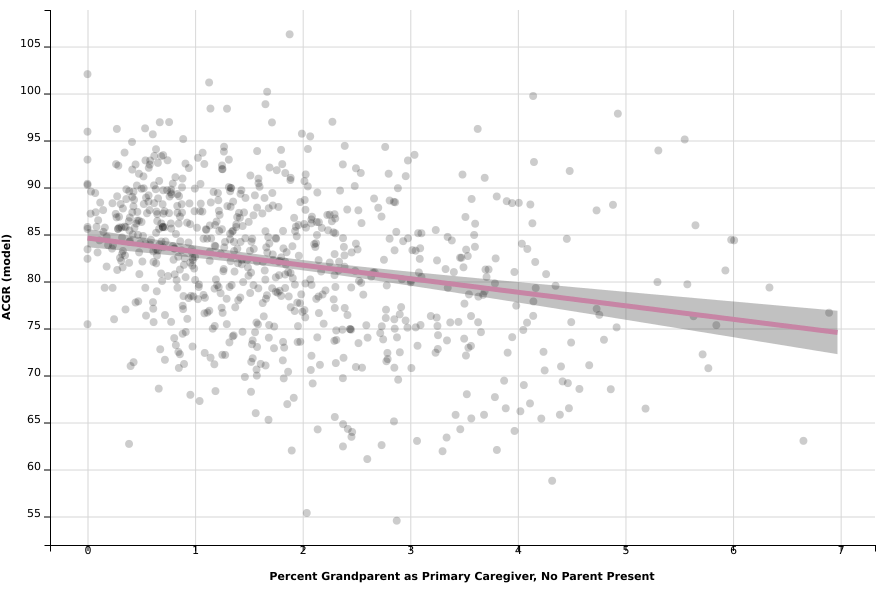
Grandparent primary caregiver, no parent - Children under 18 years is living with a grandparent who is financially responsible for the children’s basic needs. There is no parent present in the household. This number is divided by the school district enrollment to obtain the percent of children in the district where the grandparent is the primary caregiver. The data is from the American Community Survey data table B10002.
The adjusted R-square for the model is 0.4608.
Data visualizations
Visualizing multiple regression models are more complex than a simple linear regression. Multiple regression models attempt to explain the relationship between an explanatory variable and the outcome variable while the other explanatory variables are held constant. One cannot plot the observed variables because it does not hold the variables constant 2. However, there is the desire to visualize the results of a multiple regression model in a familiar simple linear regression plot.
I used the visreg package in R to create the data visualizations for model’s predictor variables. The visreg object is parsed into data frames which are used to create the presentation graphics with the ggvis package.
The visualization plots the fitted regression line and its upper and lower bound. The partial residuals for the predictor variable are underlaid as a scatter plot.
Analysis / Recommendations for action
Children living with a grandparent as a primary caregiver where no parent is present are one step away from landing in the foster care system. They instinctively know at this young age that are own their own and will probably be so for the rest of their lives. How they interact at school and make decisions is crucial to their outcomes as they transition to adulthood.
Children need stability. A stable educational environment is important to a child’s well-being. Moving upsets this sense of stability. School transfers can create emotional instability as children lose friendships and relationships built with education leaders.
The situations faced by children living with a grandparent as a primary caregiver where no parent is present and children who move are similar to those children in foster care. Reports from Maryland Public Policy Institute3, University of Chicago’s Chapin Hall Center for Children4, and The Heritage Foundation5 come up with policy actions which can address educational deficiencies to improve academic performance including high school graduation. These policy actions are based on recommendations found in those reports.
Prevent student records transfers from being held up by bureaucratic school administrators or complex inefficient IT systems3. The state of Vermont is exploring the use of electronic records that employ blockchain technology6. Blockchain is an intriguing technology for school records because of its decentralized structure which aligns with the decentralized nature of US education system. Blockchain is something which needs to be set forth in the education reform debate.
Provide life skills training. Progressive communities are starting to integrate the whole child approach into education. Many of these children already know they need to understand personal responsibility, but need guidance, consulting, exposure, and basic first step experiences to understand exactly what it means.
Provide access to children’s mental health services and counseling. Educators should be aware of emotional trauma issues, loss and separation issues. These services can help work through a child’s reaction to a crisis and focus on their long term needs, rather than throwing the child into a special education placement4.
Make sure school administration is aware that it may be necessary to protect child from their biological parent3.
In many policy reform debates in the United States for the past few decades, single mothers somehow get dragged in and it is often in a negative perspective. This is puzzling because they are the ones being responsible for the well being of their children. What about the fathers?
The married males predictor variable in the model shows a strong positive effect on graduation rates within the school district. Simply put, school districts with a higher percentages of households with married males have higher graduation rates.
The American Enterprise Institute7 and the Brookings Center on Children and Families8 have been studying marriage and the community for years and have set forth recommendations to increase the number of married family households in the United States.
Promote a “success sequence” through a national campaign. This sequence emphasizes those who graduate from high school, get a job, marry, have children in that order are more likely to enjoy a stable and happy life9.
Lower marriage penalties associated with government transfer programs and adjust public policies targeting low-income families, especially in the first years of married life7.
Expand the earned income credit to men who do not have children up to 1000 dollars. It may increase incentive to work and employment rates and thus marriageability. Expand the child tax credit to 3000 dollars for both income and payroll taxes. This could help stabilize the economic foundations for middle and lower income families7.
Young men who do not have a college degree face the highest rates of unemployment and underemployment, which limits their marriageability. Expanding vocational education and apprenticeship can play a key role in providing students with skills, confidence, and opportunities that will boost their employability and income7.
The lack of marriageable men in the black community is affected by the very high rates of incarceration and early death among black men compared to white men. Among black male high school dropouts, 60 percent will be dead or incarcerated before the age of 35. Sentencing reform or other changes to the criminal justice system could improve this picture8.
Outlier Analysis
Cyber Charter Schools
The Grad Nation report1 highlights the decrease in the number of high schools with low graduation rates i.e. “dropout factories”, but do we know what is happening with the at-risk dropout students? Are they actually graduating or are they getting transferred? Are there funding pressures which are linked to academic performance forcing education administrators to seek “alternative academic environments” for their worst performing students?
A fast and simple action to improve performance metrics which are based on averages is to remove bottom outliers. When administrators must make decisions based on incentivized performance public funding revenue formulas vs the payment outlays to transfer students to a cyber school, sometimes it may be in the best interest for ALL STUDENTS within the district to move a handful of students to an alternative academic environment.
This table shows the school districts in the bottom five percentile for graduation rate performance. The most striking element is the five worst performing schools are cyber charter schools. Their average ACGR is 12 points lower than the worst performing traditional public school district.
America may be closing “dropout factory” campuses, but is it just replacing them with new digital versions?
Grand Rapids, Michigan - A Divided City
Grand Rapids is in Western Michigan and is the state’s second largest city. It is the home of the 38th President of the United States, Gerald R. Ford. Ford served in the US House of Representatives as Grand Rapids’ congressman for 25 years and has a museum and airport named in his honor.
Grand Rapids metropolitan population is 770,000. The city’s cost of living below the national average, its unemployment rate is 4.6% and the average daily traffic delay is just 4 minutes per person. However, its violent crime rate 2.1 times greater than the national average and its property crime rate is 1.6 times greater than the national average10.
This city also plays host to both a top 10 percentile district, Forest Hills Public Schools and bottom 10 percentile district, Grand Rapids Public Schools. The superintendent's offices are a mere 6.8 miles apart, yet the difference in their district’s ACGR scores is 49 percent.
Gerald R. Ford’s early life was marked by domestic violence, divorce, moving, and living with step-siblings11. If Gerald Ford was a student today, he may be classified as at-risk child. Should the Data for Diploma’s sponsors want a place to try to implement the results from this challenge, Grand Rapids Michigan may be a good starting point.
References
- 2015 Building A Grad Nation Report
- Visulization of Regressions Models Using visreg
- Maryland Public Policy Institute, "Focus Group Study, Foster Care Families, Children, and Education"
- Chapin Hall Center For Children at the University of Chicago, "The Educational Status of Foster Children"
- The Heritage Foundation, "Foster Care Children Need Better Educational Opportunities"
- Vermont Legislature, "No. 51 An act relating to promoting economic development", page 7.
- American Enterprise Institute, "For Richer, For Poorer, How Family Structures Economic Success In America"
- Center on Children and Families at Brookings, "Is There a Shortage of Marriageable Men?"
- Ron Haskins and Isabel Sawhill, Creating an Opportunity Society (Washington, DC: Brookings Institution,2009)
- Wolfram Alpha, Grand Rapids Michigan
- Wikipedia, Gerald R. Ford
Built With
- r
- r-studio
- shiny


Log in or sign up for Devpost to join the conversation.