-
-

Login Page
-

Register Page
-
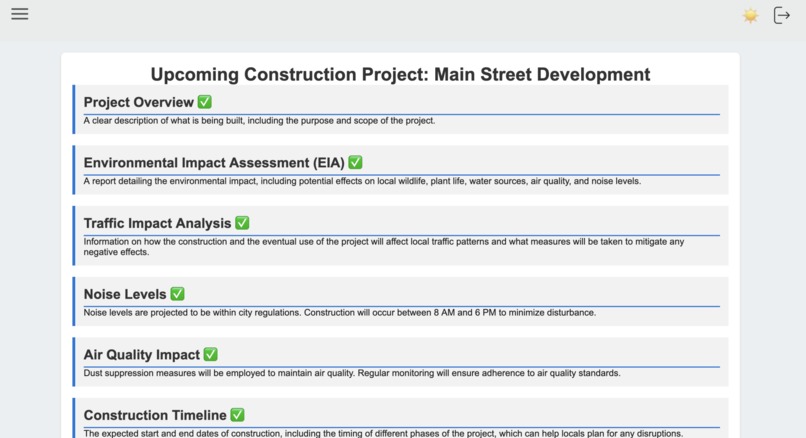
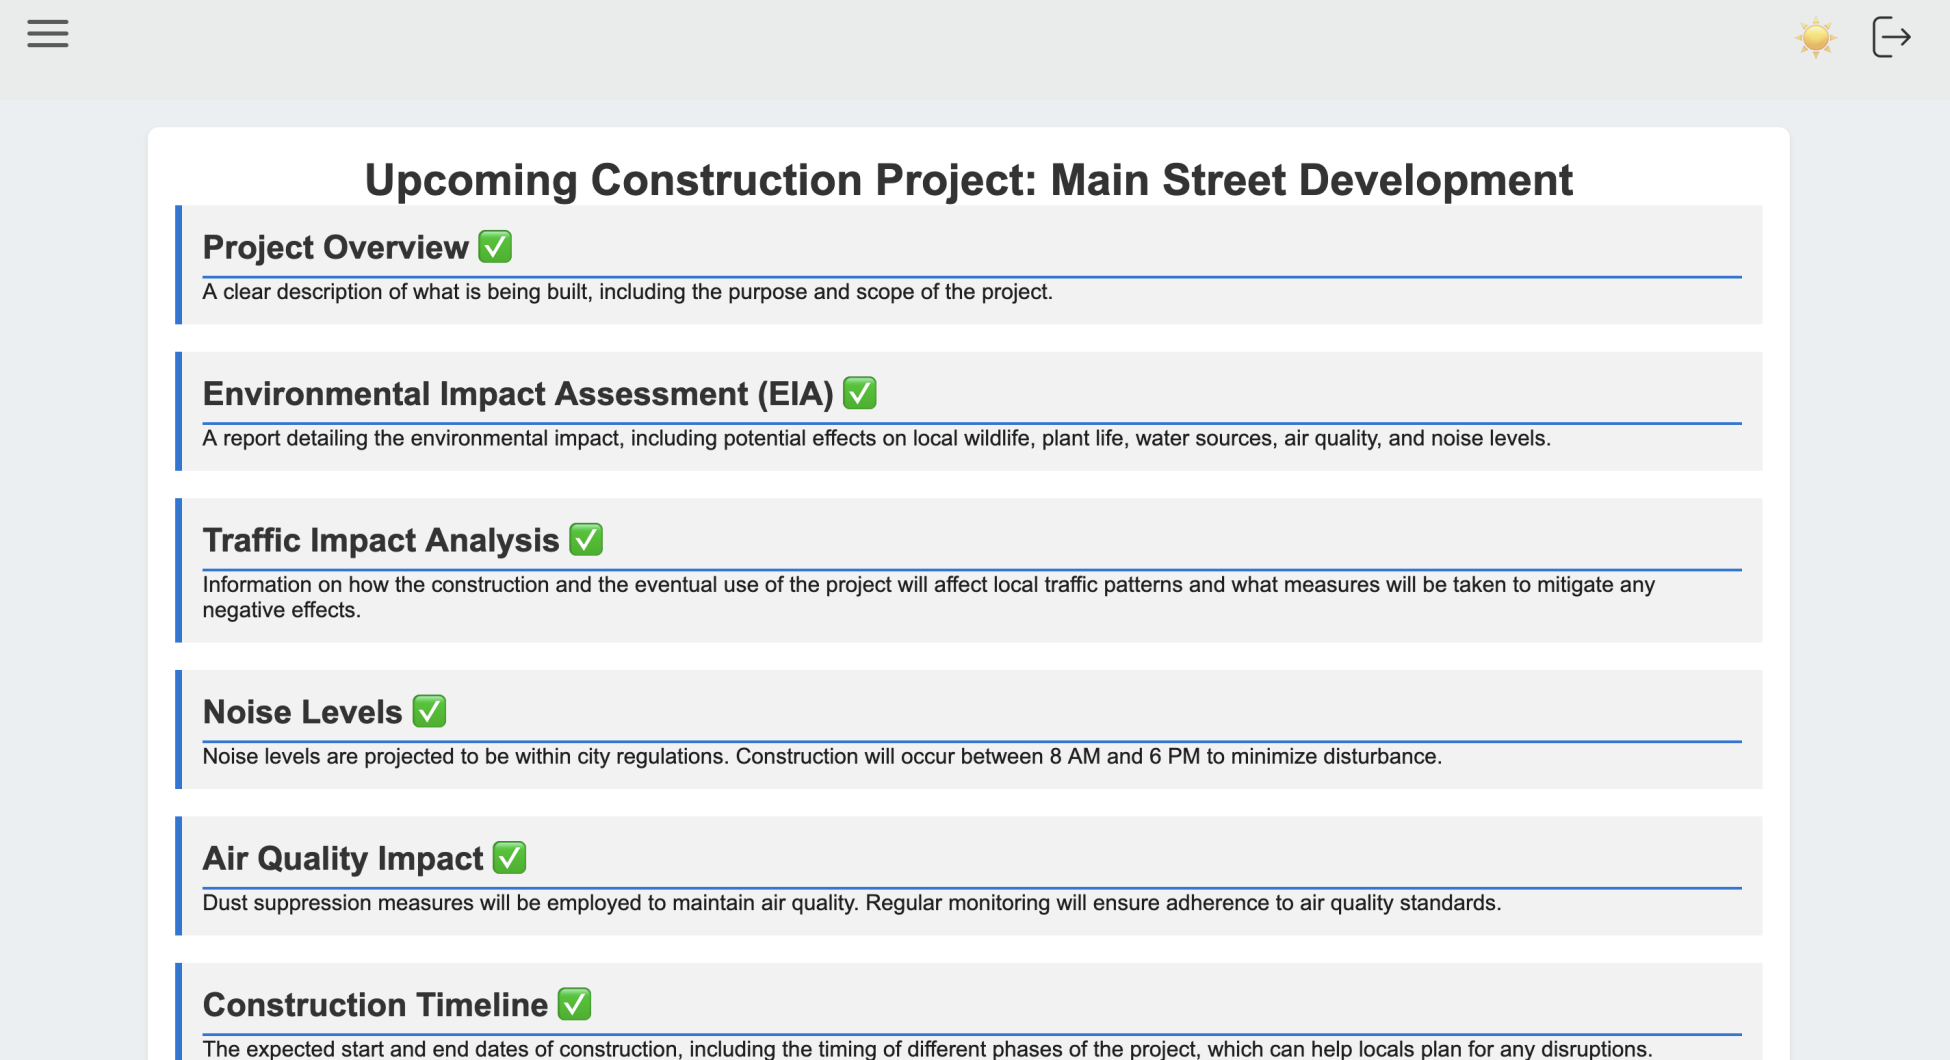
Guidelines Page
-
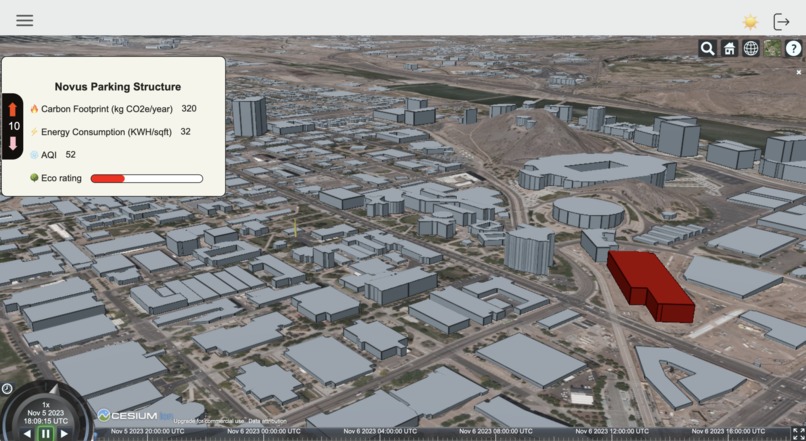
Upcoming Projects Page
-
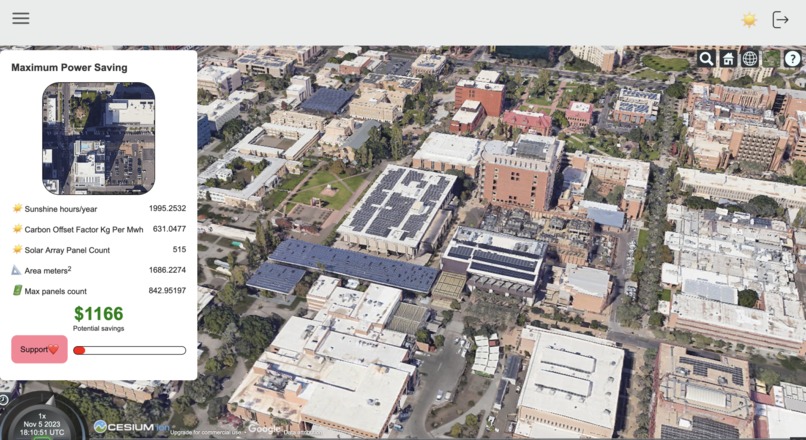
Power Savings Page


Inspiration
The driving force behind our project's inception lies in our commitment to democratize the intricacies of urban planning within cityscapes. Our ambition is to cultivate a well-informed public consciousness regarding the burgeoning infrastructural developments that are shaping their cities and neighborhoods. By unveiling the mechanics of urban growth, we empower residents to engage meaningfully in the decision-making processes that influence their immediate environments. This initiative is rooted in the belief that an engaged and knowledgeable citizenry is pivotal to the collaborative evolution of our urban spaces.
What it does
Our sophisticated web application offers comprehensive data analysis across three critical dimensions:
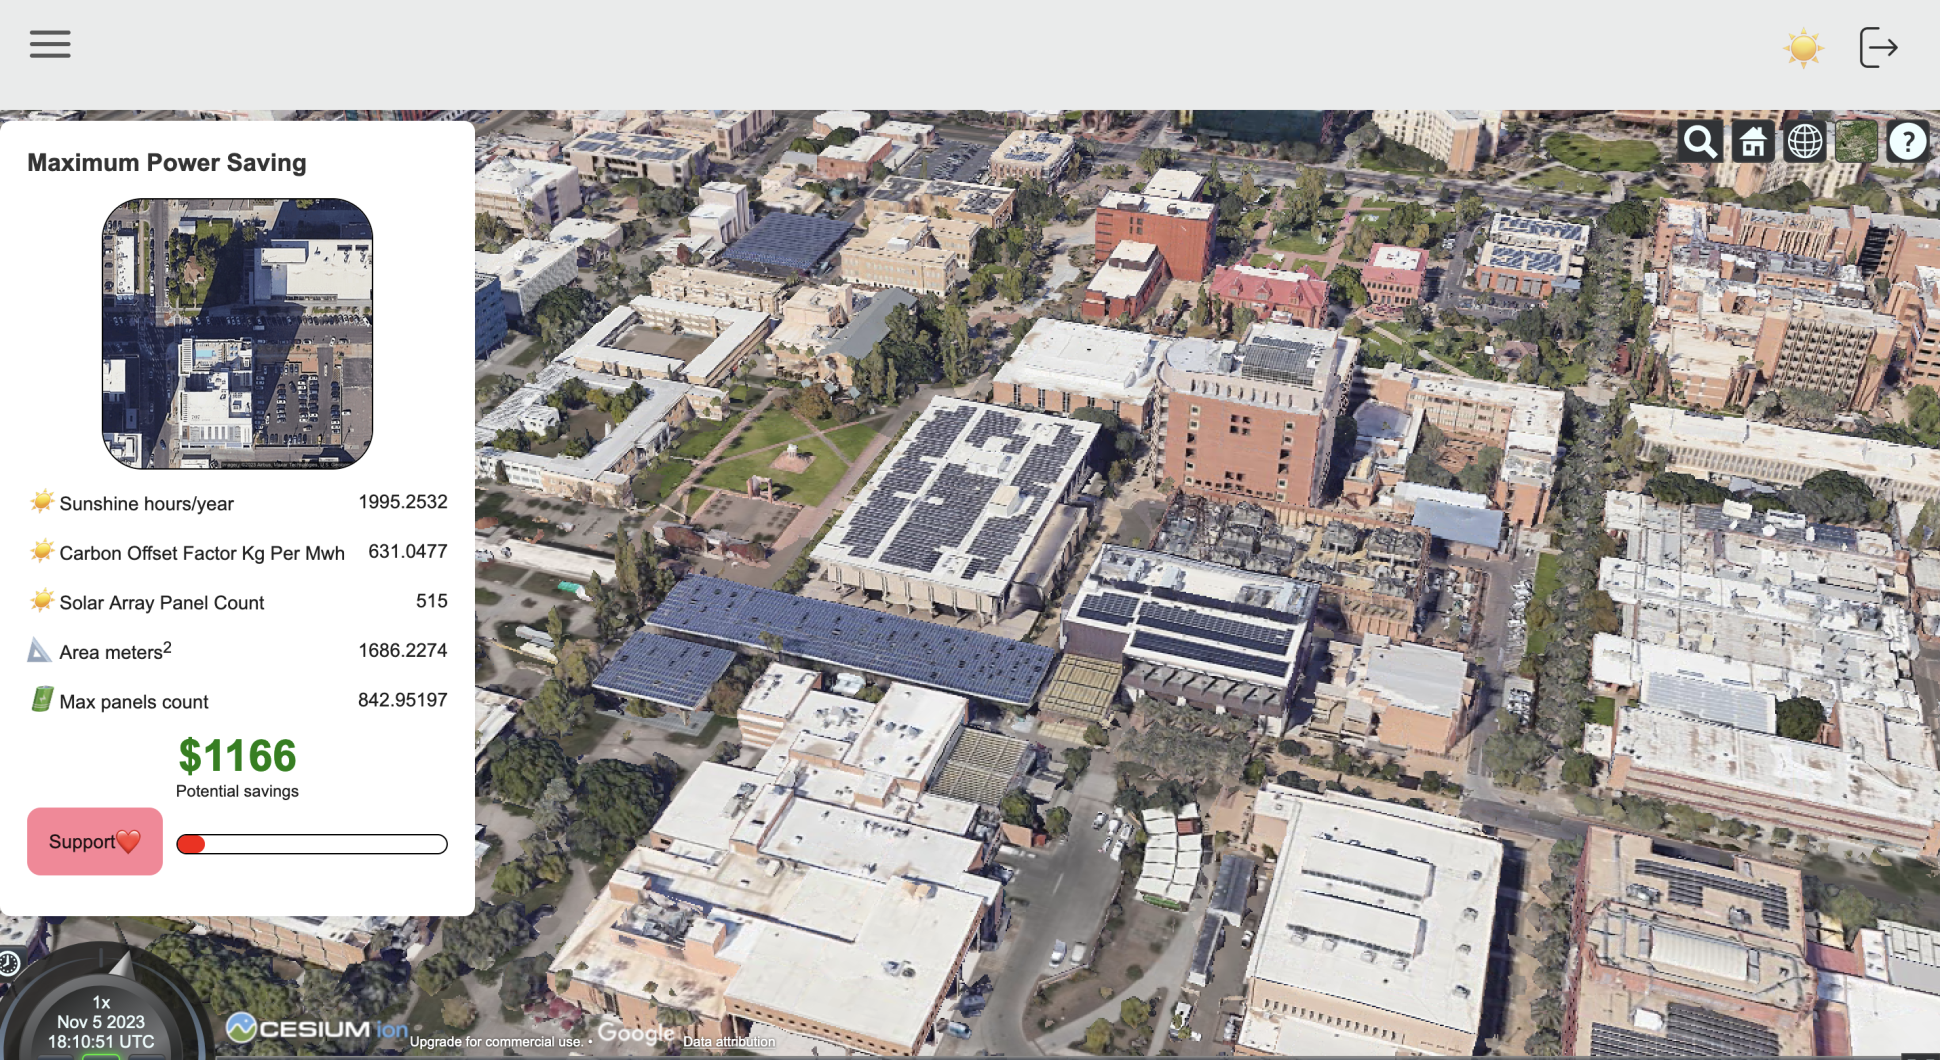
Solar Panel Impact Assessment: We delve into the financial and environmental benefits of integrating solar technology into architectural designs. Our platform not only calculates the potential cost savings derived from the adoption of solar panels but also evaluates the carbon offset potential specific to the project's locale. We provide a detailed projection of the number of solar panels that would be required to harness solar energy efficiently, taking into account the spatial footprint they would encompass. This enables a sustainable approach to energy consumption while optimising the use of available space.
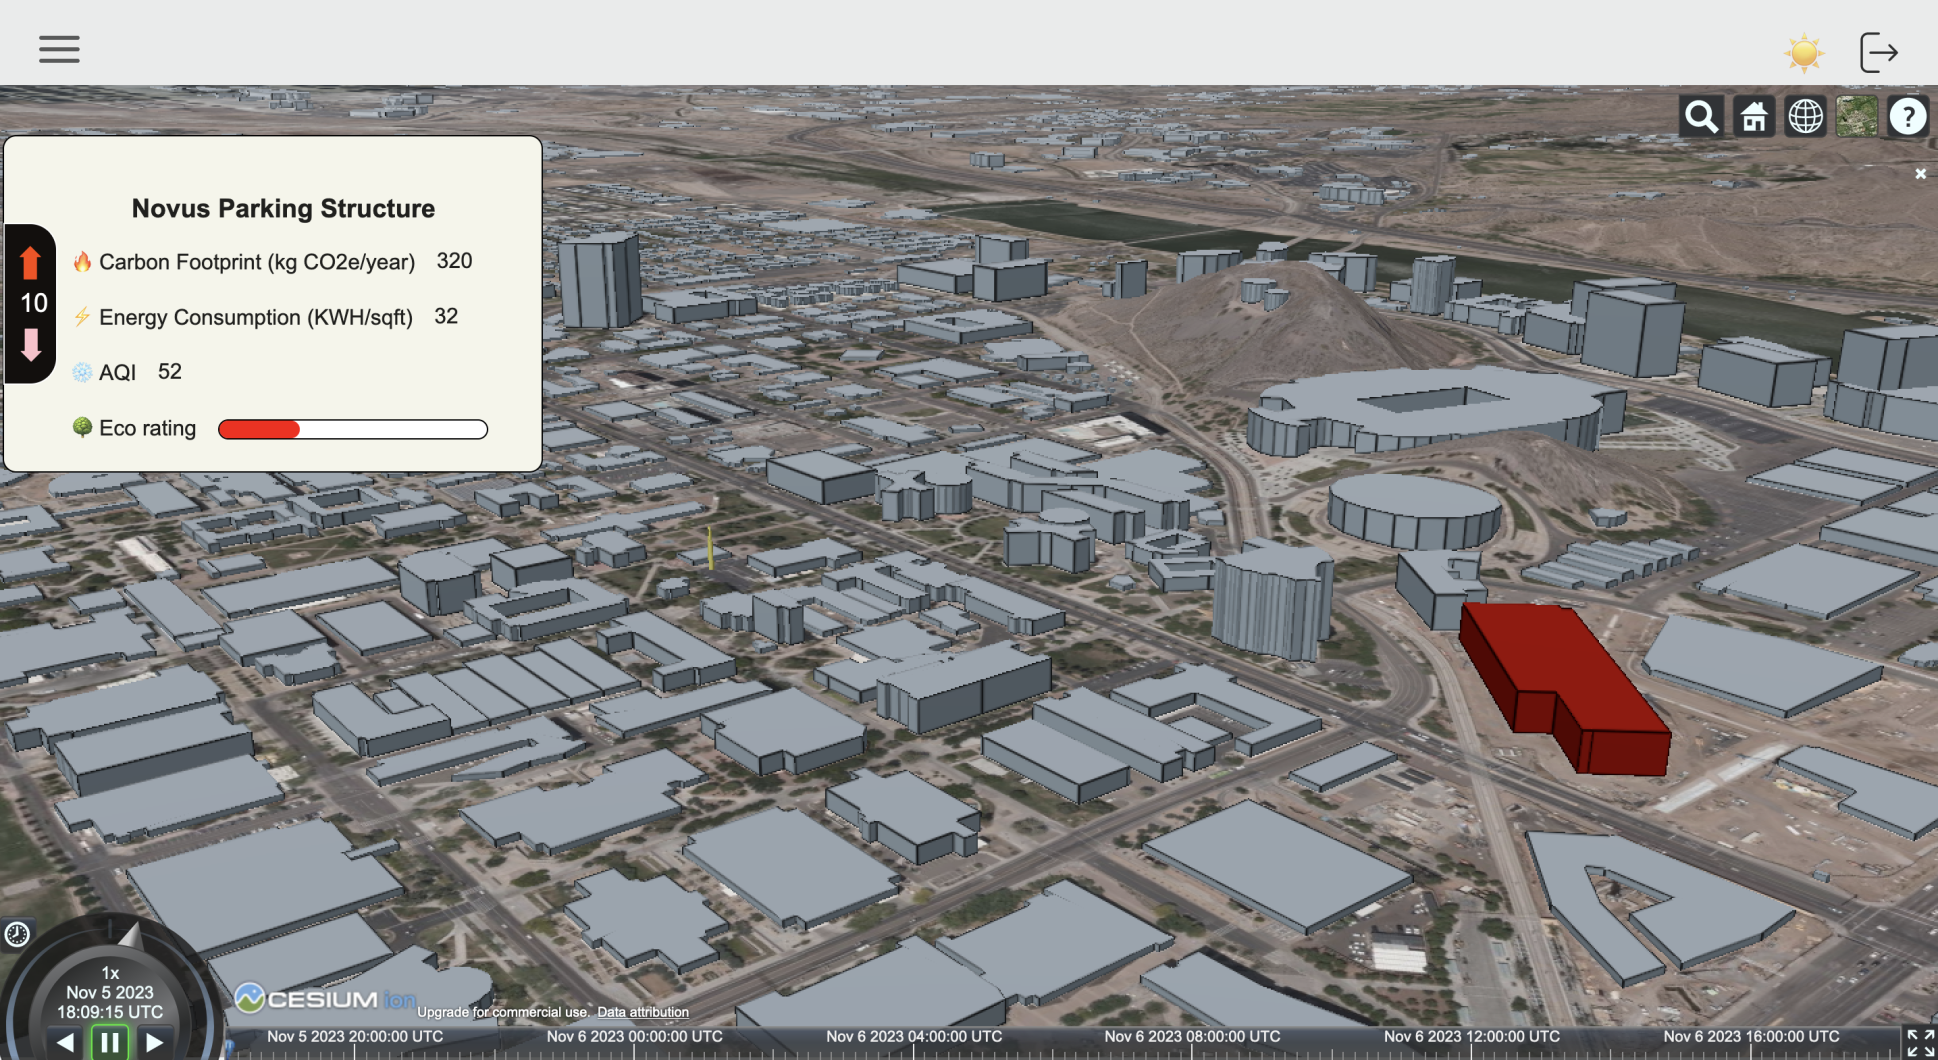
Air Quality and Particulate Matter Analysis: Our system rigorously examines the Air Quality Index (AQI) and the prevalence of particulate matter within the vicinity of the proposed construction. By offering a granular view of the air quality and identifying the types and concentrations of particulate matter, we equip planners with the data necessary to make informed decisions regarding public health and the environmental impact of their projects.
Local Weather Pattern Insights: We provide an in-depth analysis of local meteorological conditions, encompassing temperature fluctuations, humidity levels, wind velocities, directional trends, and patterns of precipitation. Our data extends to an evaluation of historical weather extremes, offering a crucial metric for assessing risk. In regions prone to severe weather anomalies, our analysis becomes instrumental in guiding the architectural considerations for building height and structural resilience, often advising against the construction of high-rise developments in favor of safety and sustainability.
How we built it
Our application is the result of an intricate blend of cutting-edge technologies, carefully selected to create an immersive and robust user experience. Here is an overview of the sophisticated tech stack we have harnessed:
Front-end Architecture: Our user interface is crafted using Cesium.js, which brings a rich, interactive, and 3D geospatial visualization, complemented by Google’s Photorealistic 3D Tiles for an unparalleled visual fidelity. This is seamlessly integrated with the core web trinity of HTML, CSS, Bootstrap and Vanilla JavaScript to deliver a fluid and responsive front-end experience.
Database and User Security: At the heart of our data management and user authentication, we have entrusted Firebase. This platform provides a comprehensive suite of tools that ensure data integrity and security while offering a streamlined, user-friendly authentication process.
API Integration: We have enhanced our application with potent API services from Google. The Google Maps Solar API provides insights into solar energy potential, while the Google Maps Air Quality API facilitates real-time environmental analysis. These are complementarily bolstered by the WeatherBit API, which offers real-time meteorological data. Collectively, they constitute an essential component of our data analysis infrastructure, empowering us to provide precise and actionable information to our users.
Challenges we ran into
Integrating Cesium JS within a React framework presented insurmountable challenges, primarily due to dependency conflicts with Webpack when attempting to resolve modules such as url, http, https, and zlib. We also encountered complexities in melding Google's photorealistic tiles with Cesium JS—while the setup was straightforward, the configuration proved to be a formidable task.
Additionally, we faced hurdles in aligning with the standardization of Google’s API responses. The Google Maps Solar API, in particular, included certain technical terminologies that were inadequately documented, which significantly extended the time required for us to decipher and effectively harness the API responses.
Accomplishments that we're proud of
In the end, we successfully brought our vision to fruition, creating a comprehensive and cohesive web application that closely mirrors our initial conception.
What we learned
The journey was rich with learning opportunities, particularly in mastering Google Maps APIs. This experience has vastly expanded our expertise, especially in leveraging these APIs to generate dynamic 3D visualizations, bringing our digital landscapes to life.
What's next for Urban Canvas
The application stands poised for numerous enhancements, which may encompass a diverse array of features, including but not limited to:
- Comprehensive Environmental Impact Assessment Reports
- Detailed Traffic Impact Analyses
- Strategic Noise and Dust Mitigation Programs
- Thorough Legal Compliance Documentation
- Assessments of Local Economic Impacts
These potential extensions are designed to enrich the application's capability, providing a more in-depth and multifaceted analysis of urban planning projects.
Built With
- bootstrap
- cesium.js
- css
- google-air-quality-api
- google-photorealistic-3d-tiles
- google-solar-api
- html
- javascript
- weatherbit-api


Log in or sign up for Devpost to join the conversation.