-
-

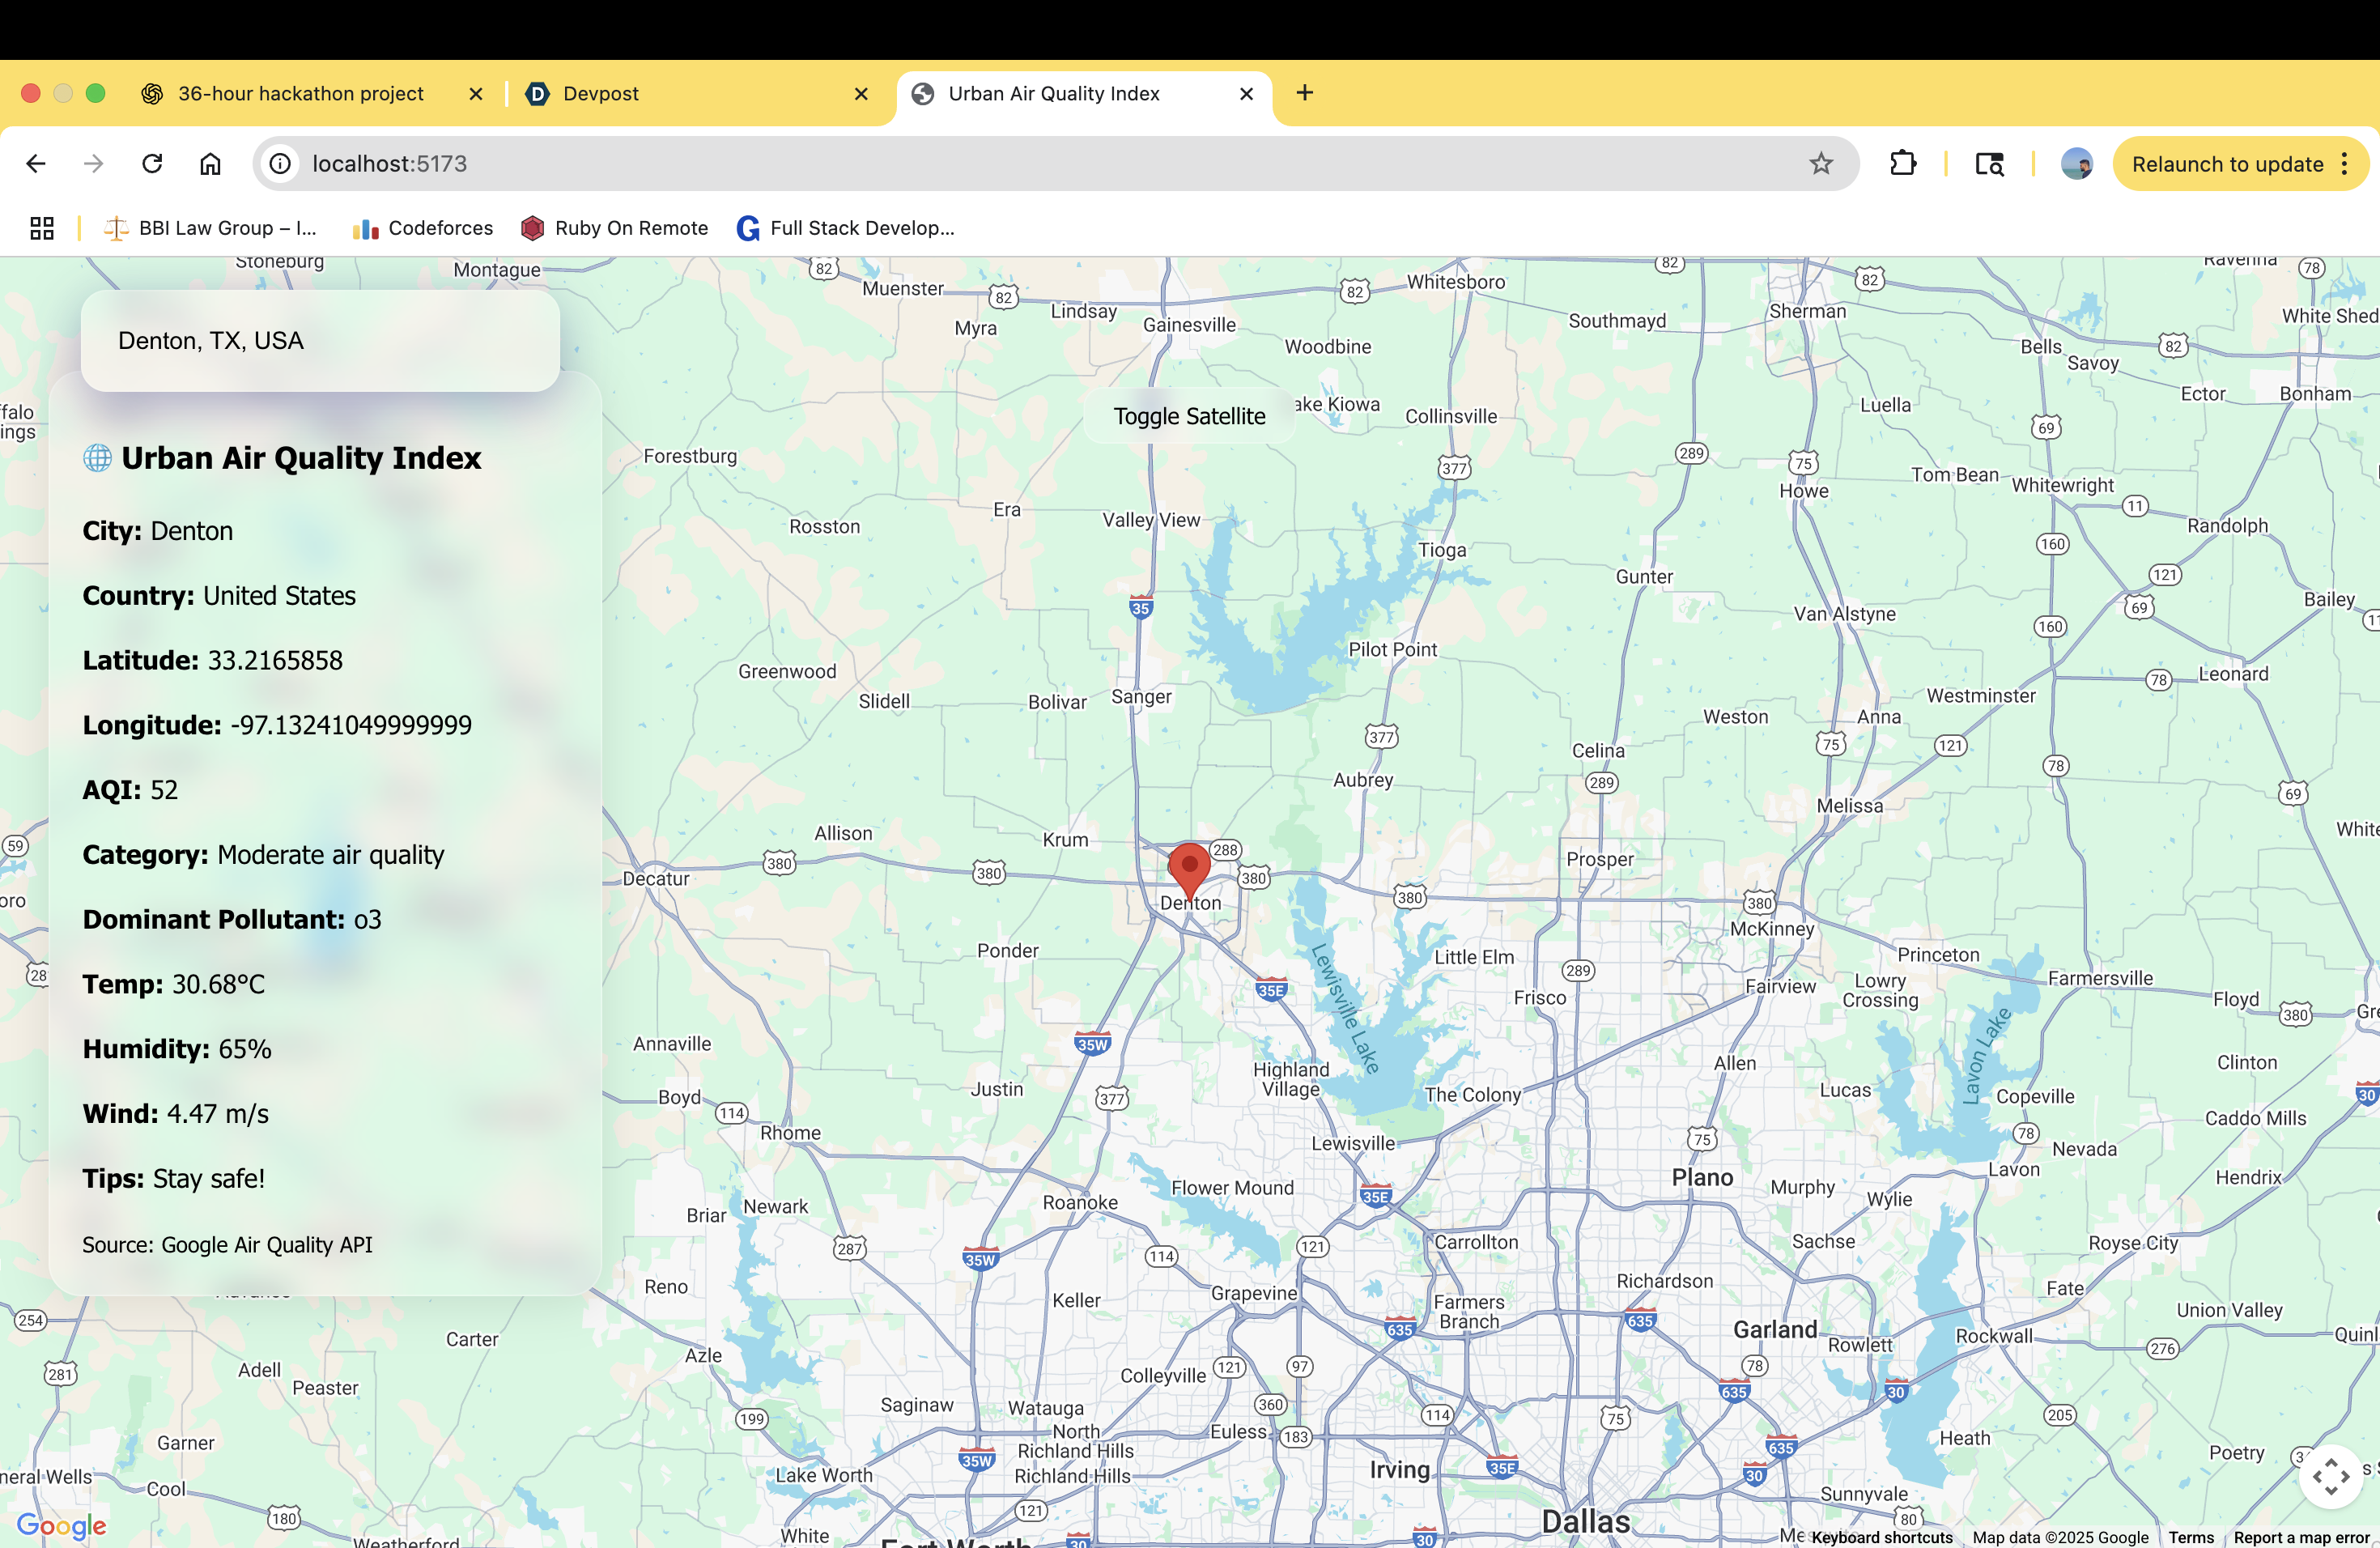
screenshot of working sample
Inspiration
We've all seen how city air can look hazy or even smell different depending on the time of day or traffic. During the COVID-19 lockdown, the air in many cities became noticeably cleaner. That made me think: What if people could easily see how clean or polluted the air is—right now—wherever they are? That’s what inspired me to build this project: a tool that lets anyone check air quality, understand what it means, and get personalized health tips using AI.
What it does
The app allows me to search or click any location on the map to view its AQI, weather, pollutant details, and personalized health tips, all within a sleek and responsive interface.
How we built it
Created a web app that combines data, design, and intelligence in a simple interface:
Frontend: Built with React + Vite, it uses:
Google Maps to search or click any city
A glassmorphism UI with draggable search and info boxes
Animated AQI markers and a satellite/street view toggle
Interactive charts to show pollutant trends
Backend: Powered by FastAPI (Python), it:
Pulls real-time AQI from the Google Air Quality API
Fetches weather data from OpenWeatherMap
Uses reverse geocoding to get accurate city and country names
Connects to OpenAI/Gemini API to generate health tips based on AQI
Challenges we ran into
CORS & Google API migration: Google deprecated parts of the Places API and Marker classes. I had to refactor with modern PlaceAutocompleteElement and AdvancedMarkerElement.
Invalid API keys & environment setup: Debugging backend .env inconsistencies and ensuring keys were accessible across services required trial and error.
Reverse geocoding nulls: Sometimes the response lacked locality or administrative_area_level_1, requiring a fallback parsing strategy.
UI Syncing across user interactions: Ensuring consistent behavior between search, map clicks, and marker animations across all states was non-trivial.
Accomplishments that we're proud of
I built a fully functional Urban Air Quality Index app that fetches real-time air quality and weather data, displays it with a modern glassmorphism UI, supports city search and map clicks, provides AI-generated health tips, and includes interactive features like animated markers, satellite/street toggle, and reverse geocoding for city and country detection.
What we learned
Real-time environmental data can be messy—handling incomplete or inconsistent responses taught me how to gracefully degrade user experience.
Combining AI with geospatial APIs unlocks personalized health insights, making the application more engaging and useful.
Optimizing API usage (rate limits, caching, and fallback strategies) is essential for stable production use.
What's next for Urban Air Quality Index
Integrate MongoDB to store user-selected cities and pollutant trends.
Enable CesiumJS globe with heatmap overlays for global AQI visualization.
Allow users to receive email alerts when AQI crosses unhealthy thresholds.
Provide insights using basic statistical modeling or ML for prediction.

Log in or sign up for Devpost to join the conversation.