Inspiration
Municipal bikeshare systems frequently experience station availability problems during peak hours. Stations may become completely full or empty, reducing service reliability and frustrating riders. We wanted to explore how Six Sigma and Statistical Process Control (SPC) could help identify unusual patterns in station unavailability.
What it does
Bikeshare Fleet Quality Monitor is a web-based quality monitoring dashboard designed to evaluate bikeshare station availability.
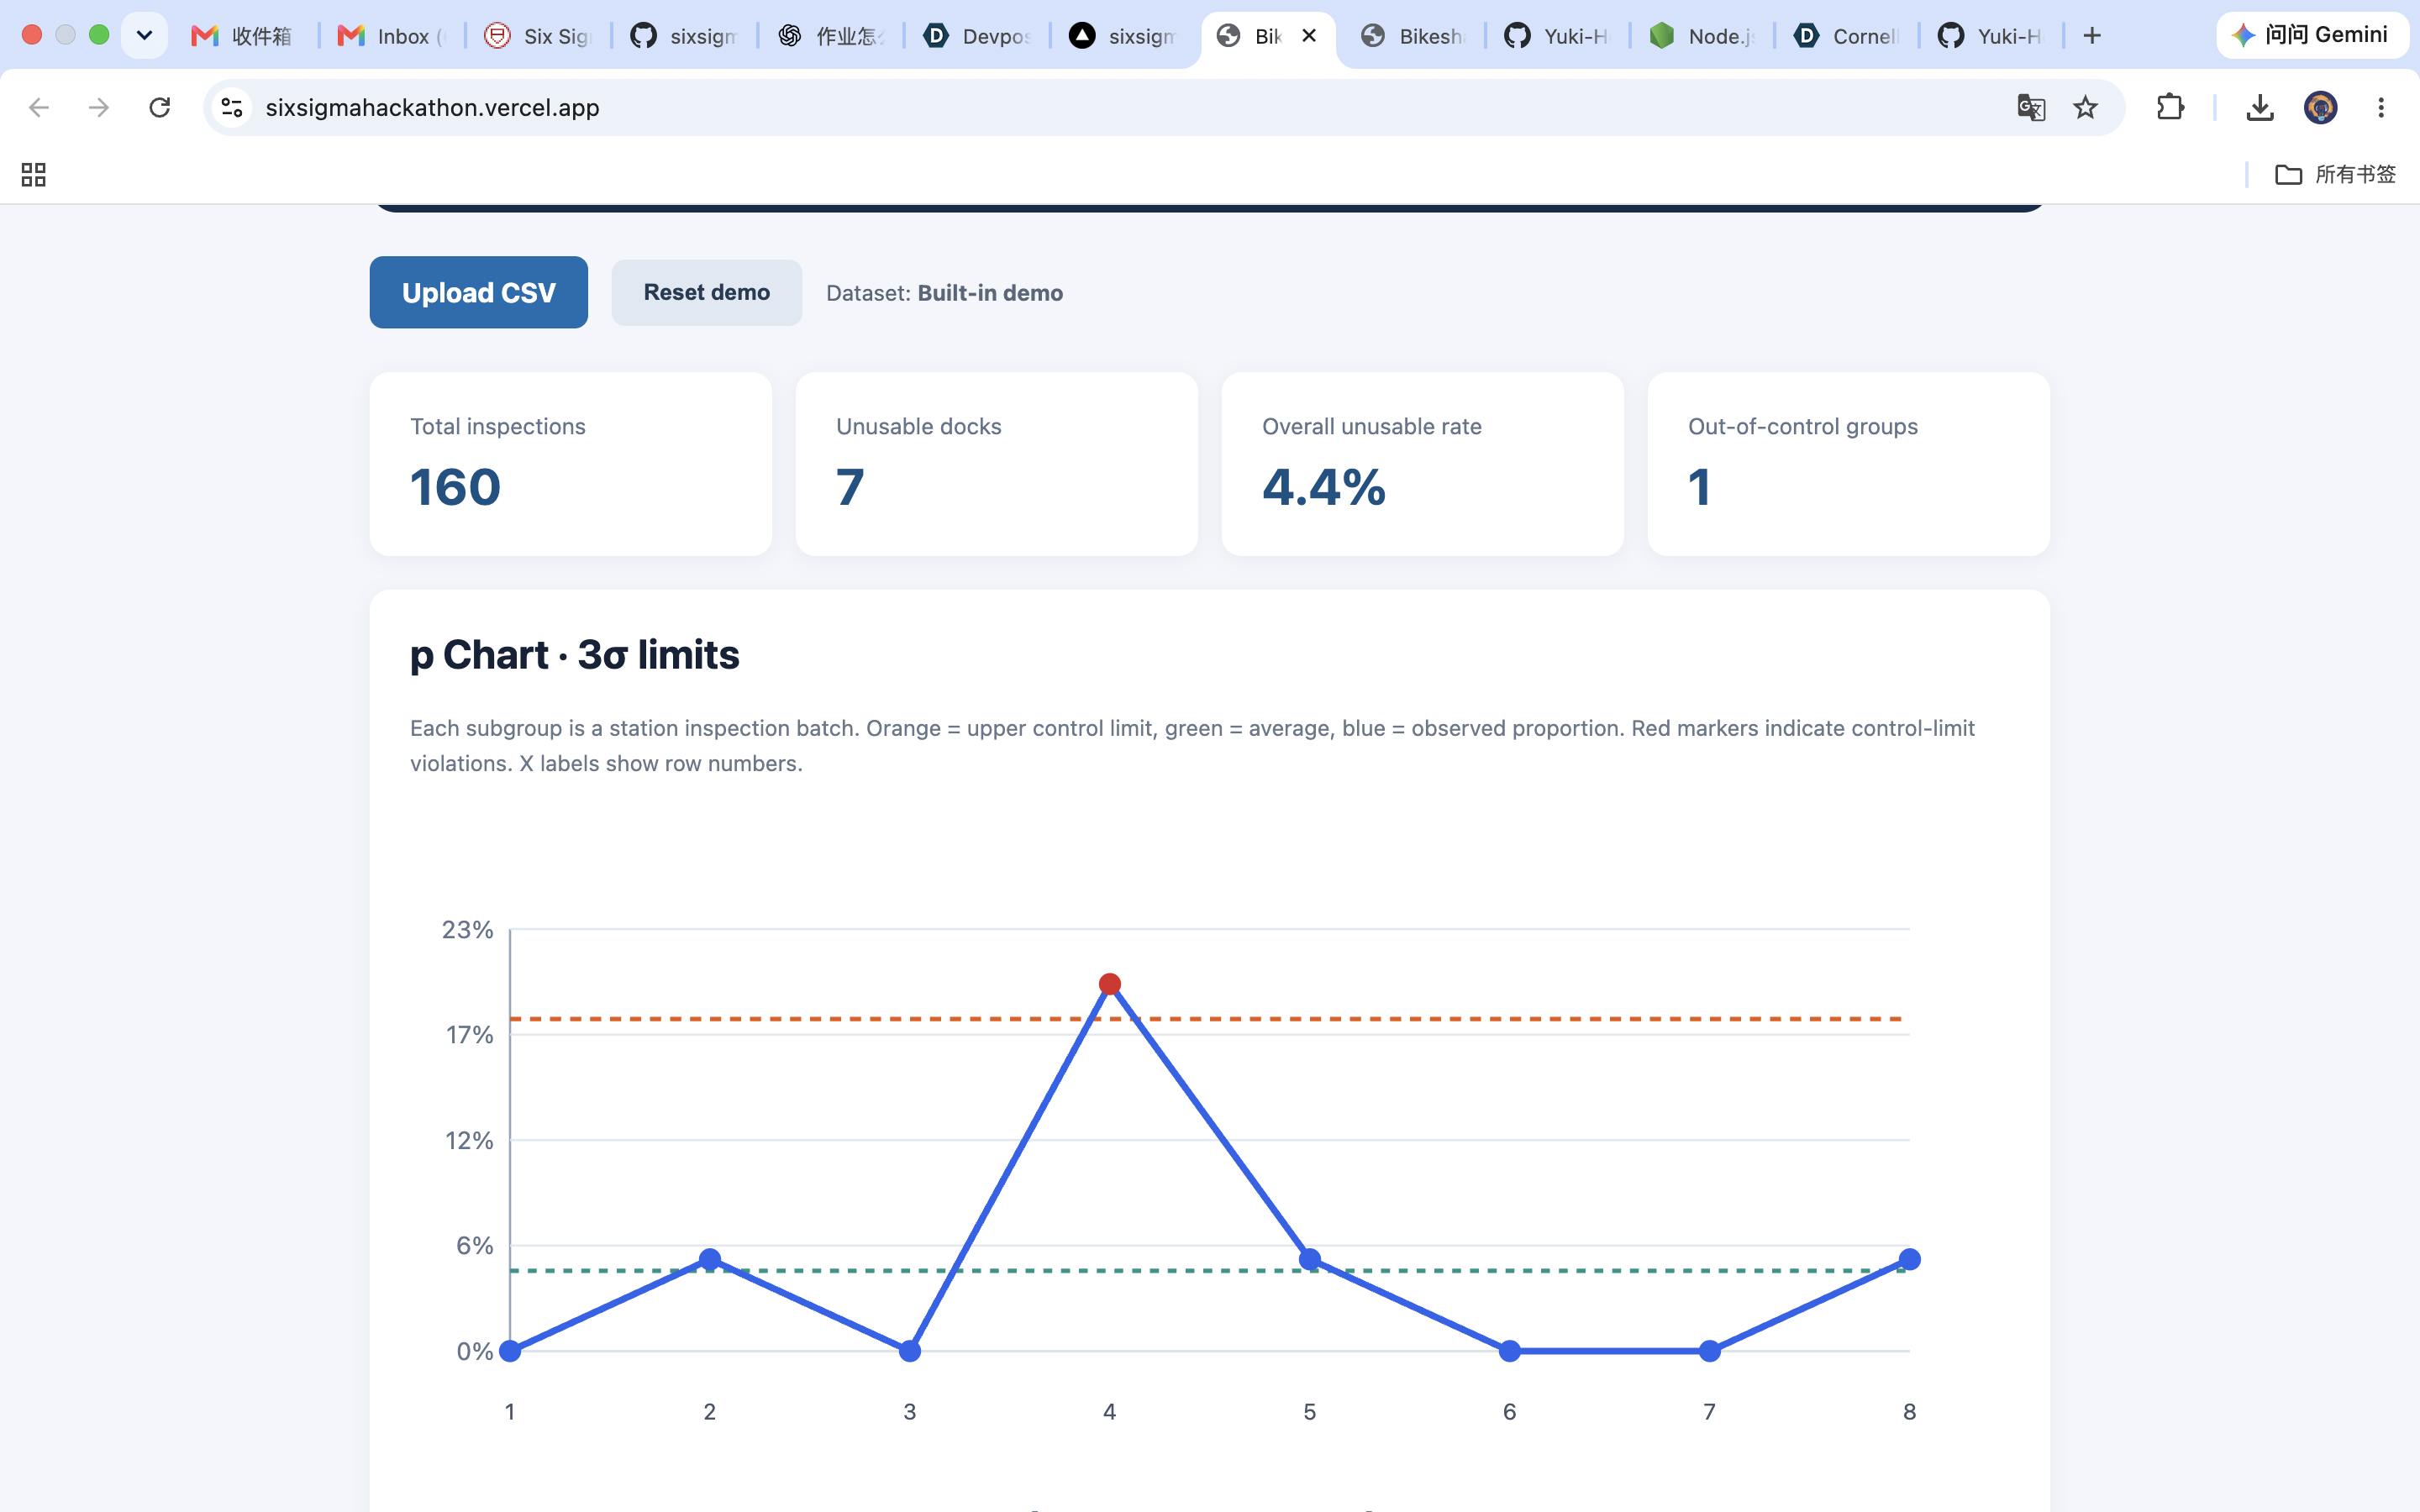
The application allows users to upload CSV inspection data and analyze the proportion of unavailable docking stations. It displays key performance indicators, including total inspections, unavailable docks, overall unavailability rate, and out-of-control groups.
The dashboard also generates a p-control chart with three-sigma control limits to identify potential special-cause variation.
How we built it
We developed the frontend using React, JavaScript, CSS, and Vite. Python was used to implement statistical calculation and testing modules.
The application uses binomial proportion calculations and statistical process control methods. We created simulated datasets representing stable operations, peak-hour disruptions, and uneven inspection sample sizes.
The source code is hosted on GitHub, and the web application is deployed through Vercel.
Challenges we faced
One challenge was calculating appropriate p-chart control limits when inspection sample sizes varied. We also needed to distinguish ordinary process variation from potential special-cause variation.
Another challenge was designing a clear dashboard that presents statistical information in an understandable way.
What we learned
This project helped us better understand how Six Sigma principles can be applied to real-world urban transportation systems. We gained experience with control charts, process monitoring, CSV-based data analysis, and web application deployment.
What's next
Future improvements could include real-time station data integration, geographic visualization, automated alerts, and historical trend analysis to support better maintenance and fleet rebalancing decisions.
Built With
- css
- github
- javascript
- process
- python
- react
- statistical
- vercel
- vite

Log in or sign up for Devpost to join the conversation.