
Inspiration
i had always enjoyed watching packets on ntwatch, but it was always too nitty gritty for me. i wanted a way to see what my computer was doing on the internet at a larger, grander scale - not just tiny packets. i wanted a way to put together processes and packets to paint a larger story of the conversations my computer was having on the internet.
what it does
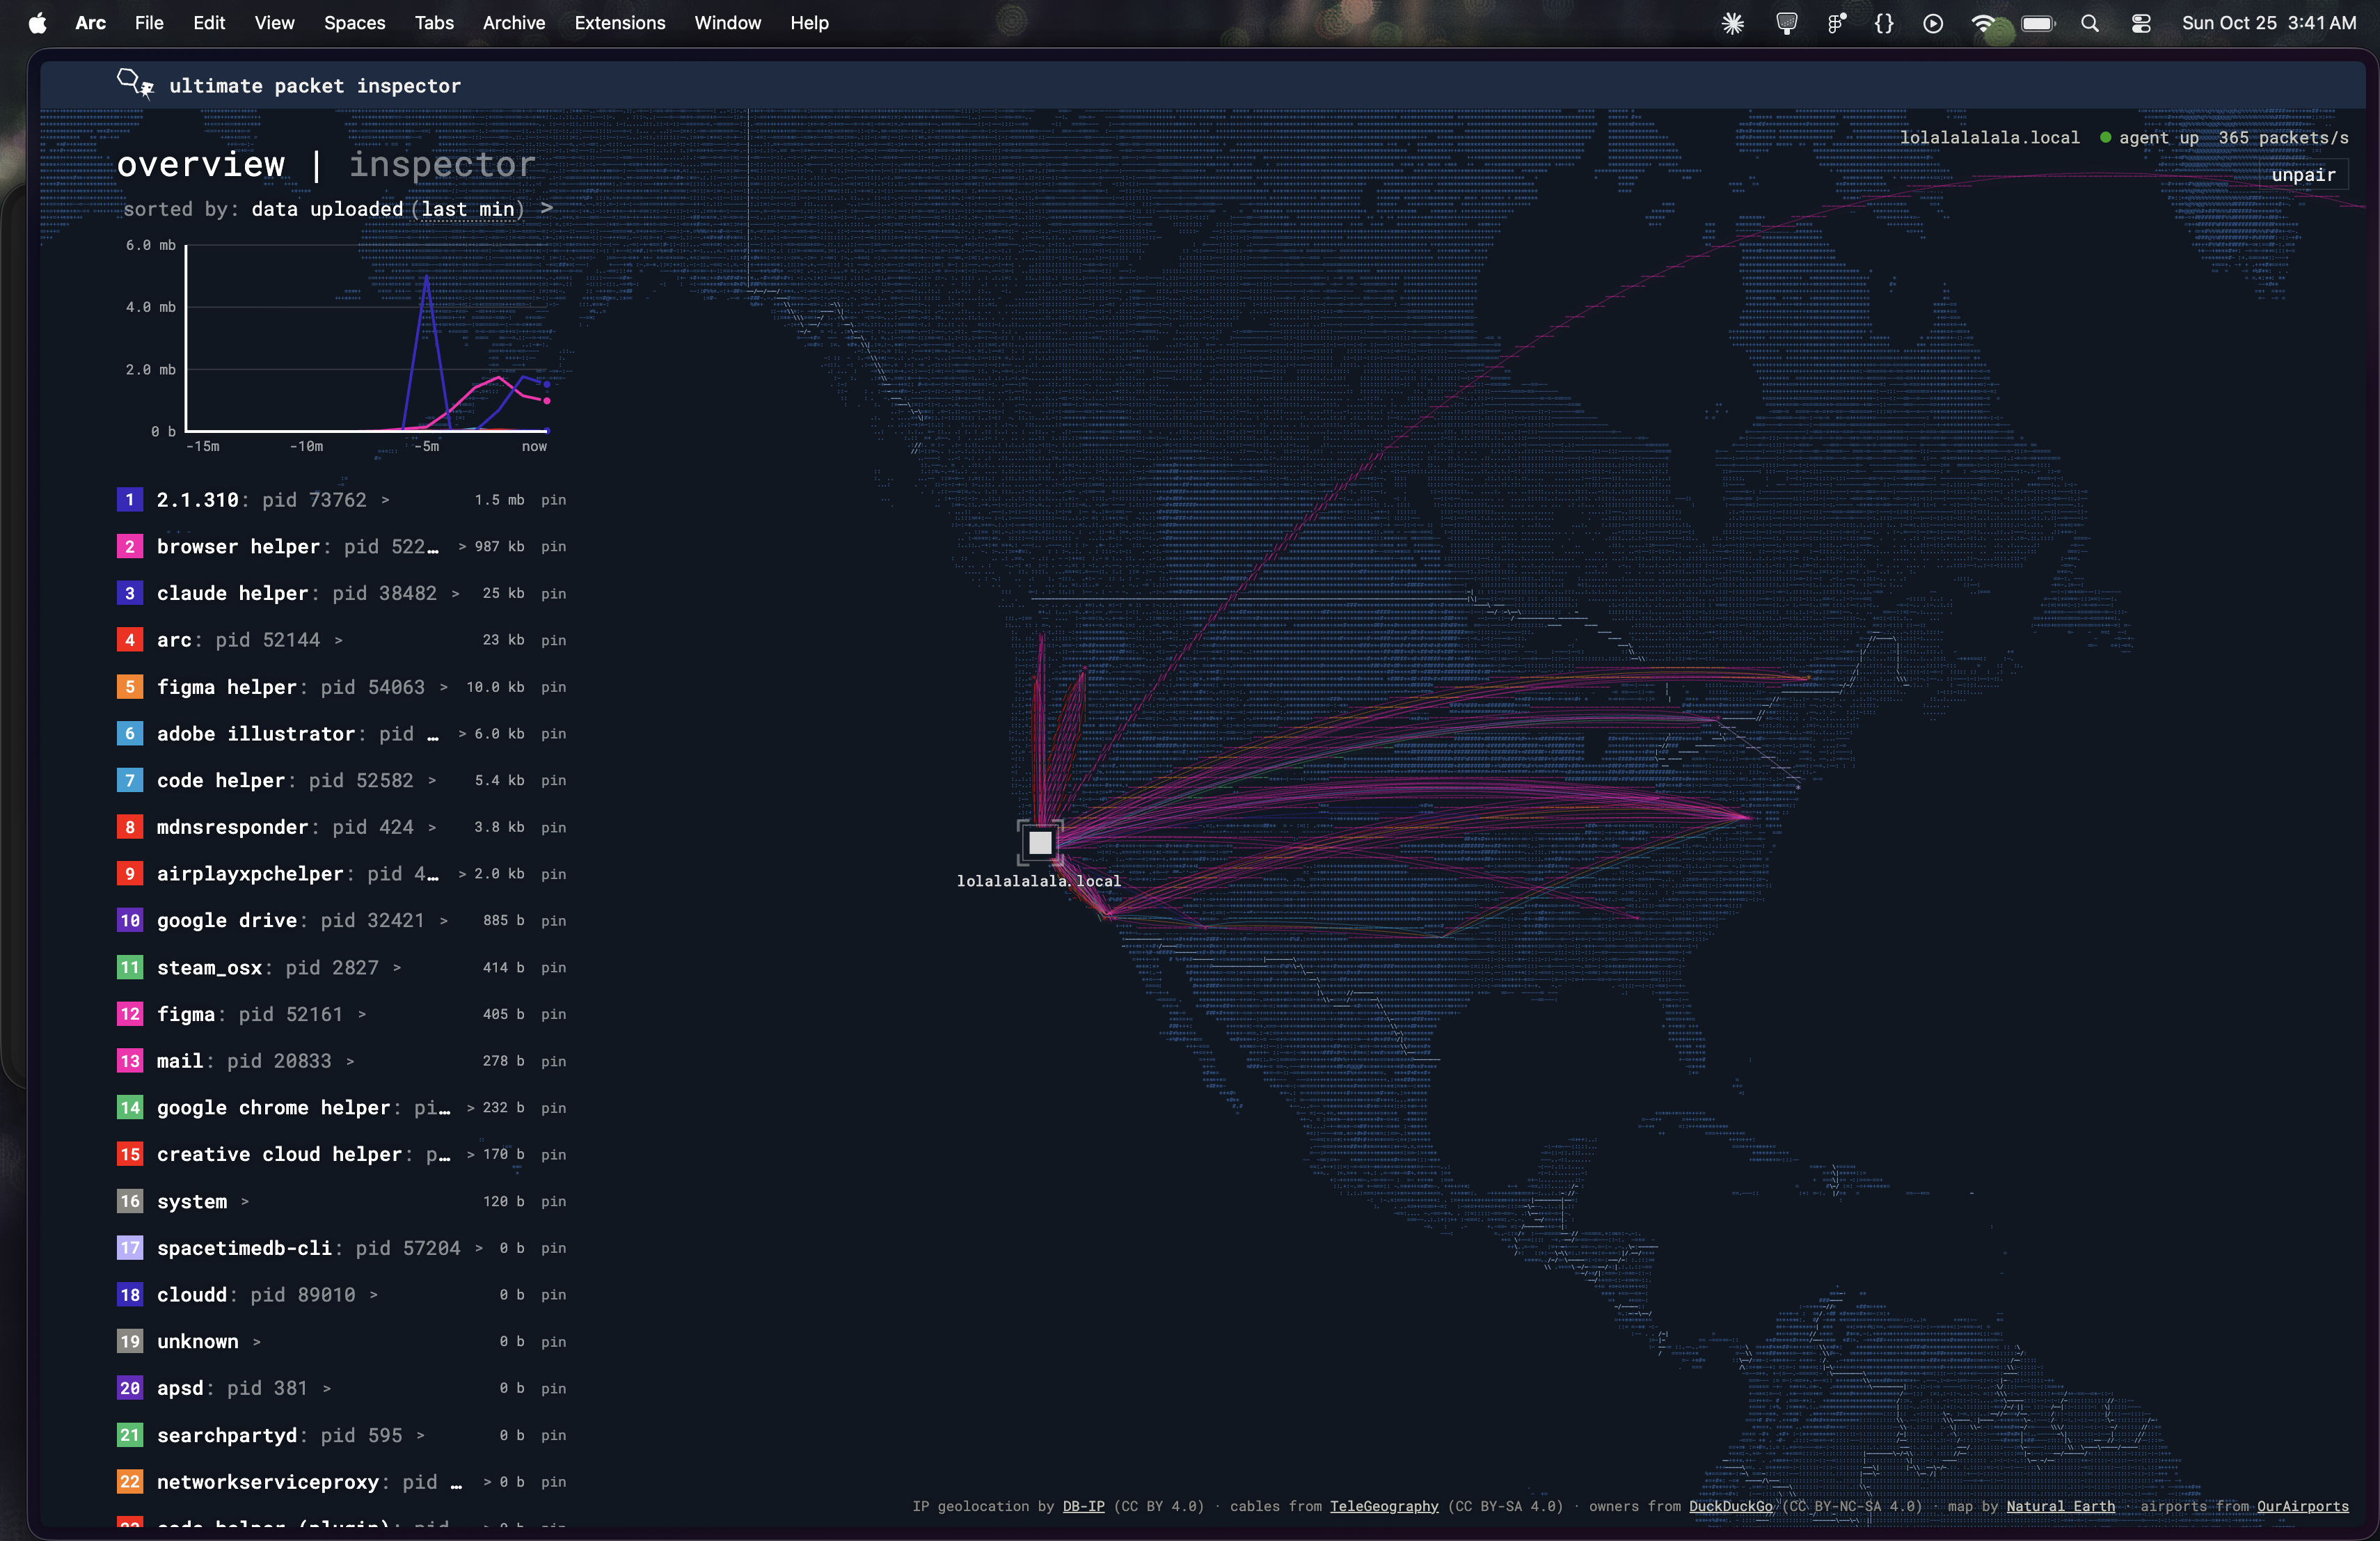
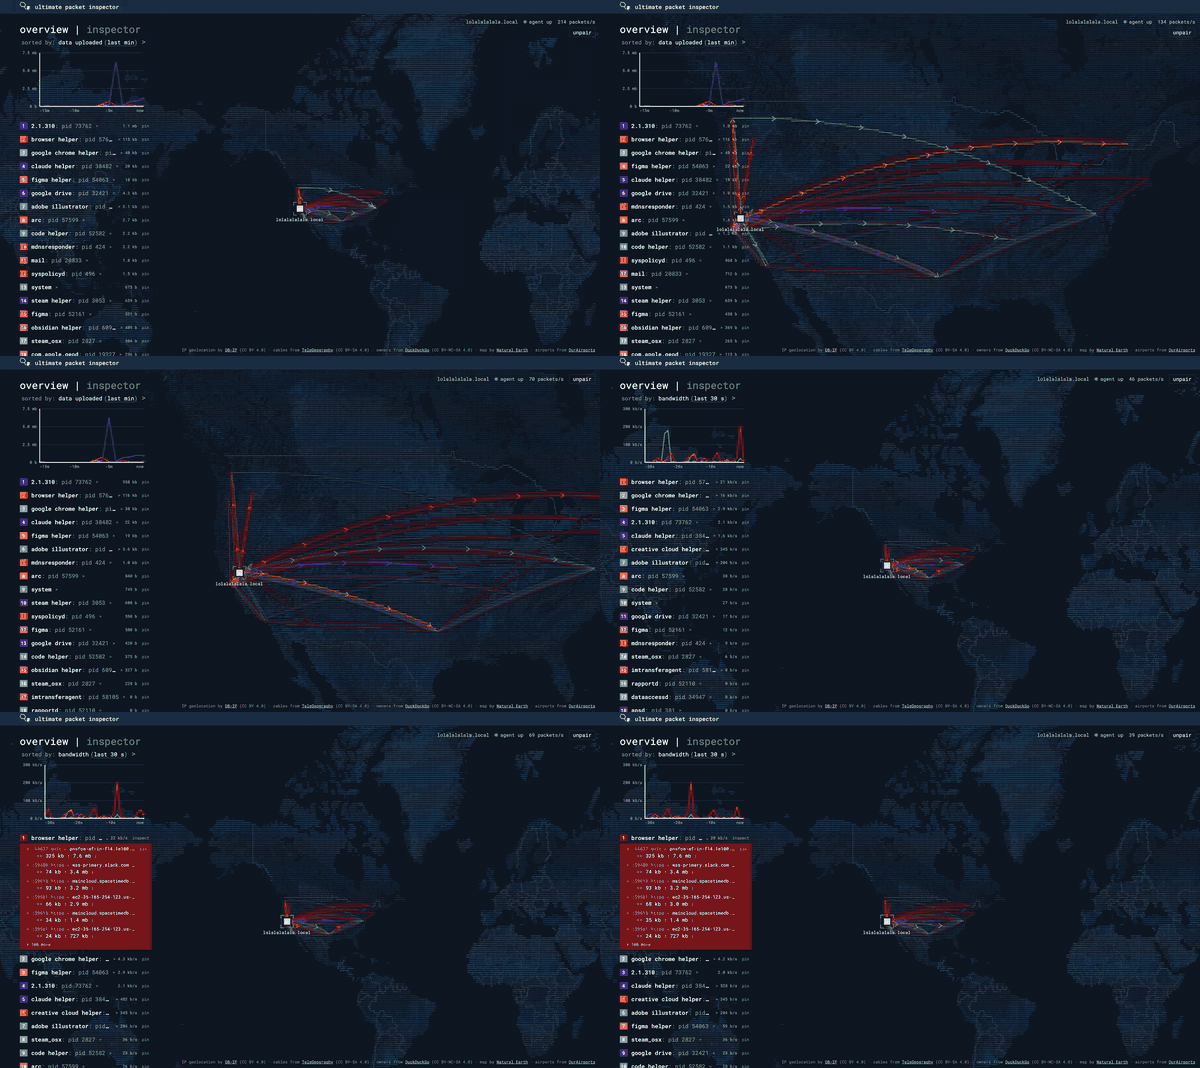
pulls network and process data from your mac and puts it on a live ascii map of the world. every computer your mac talks to gets a line from your house to wherever it is, coloured by the app that's talking to it, with packets moving along it as they're sent.
- which app. every packet is matched to the process that sent it.
- who's on the other end. each address gets a name, a location, the company that owns it, and a flag if it's a known tracker or ad network.
- the real path. each destination gets a traceroute, so lines follow the actual routers (and undersea cables) instead of a straight line. round trip times are checked against the speed of light: if a server answers in 3ms it can't really be in sydney, so that location gets thrown out.
- rank everything. sort your processes by any of 51 stats, from upload speed, jitter and cpu to countries reached, data sent to trackers and unencrypted traffic, over anything from the last 15 seconds to the last 24 hours. or open one process in the inspector to watch its packets go by.
- from anywhere. pair your phone with a one-time code and watch your mac live from it.
How we built it
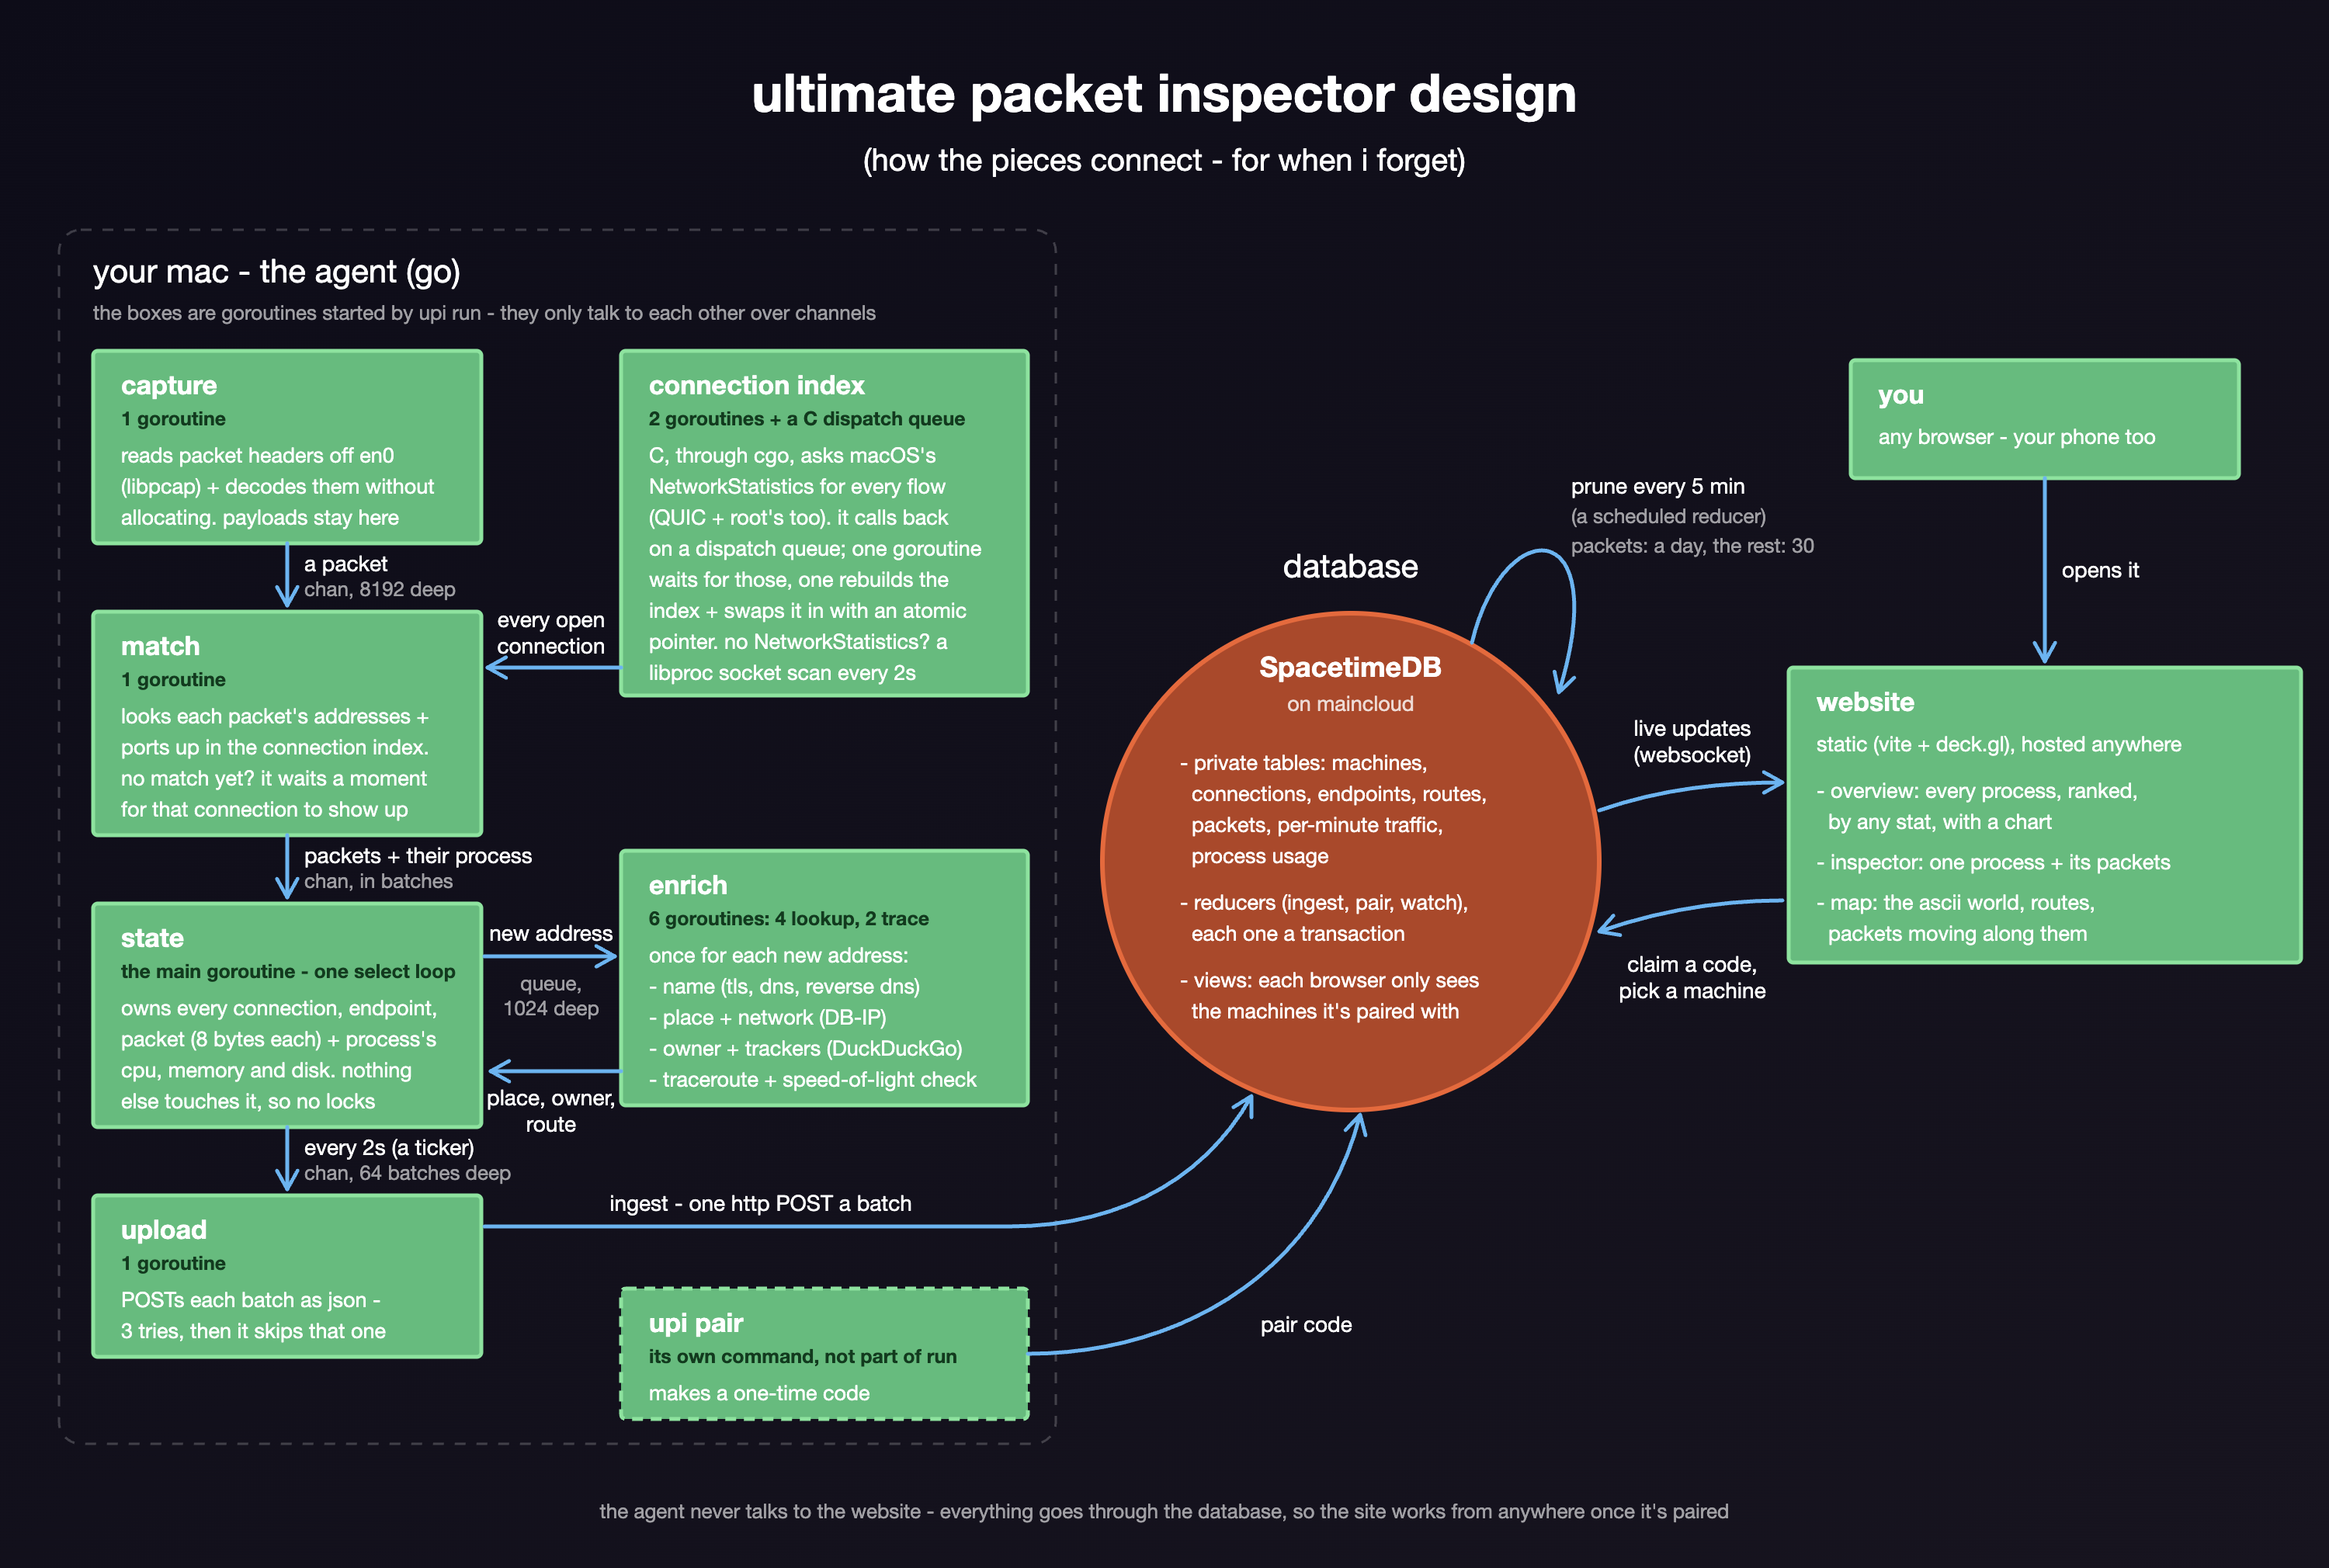
it's three parts that only talk through a database:
- the agent (go, on your mac):
- captures every packet header with libpcap. payloads never leave the machine.
- matches packets to processes with small C files called through cgo, using macOS's NetworkStatistics framework (the one nettop uses), or a libproc socket scan when that isn't available.
- worker goroutines look up each new address in the background: DB-IP for location, DuckDuckGo's tracker data for owners, reverse dns, and a own unprivileged ICMP traceroute.
- every 2 seconds it uploads one batch, with each packet packed into 8 bytes.
- the database (SpacetimeDB on maincloud): a typescript module with private tables. the agent writes through reducers, and browsers only see data through views, which only show machines they've paired with.
- the website (vite + deck.gl):
- designed in figma.
- the map is drawn live in ascii from natural earth's shaded-relief raster, so zooming in brings out more detail instead of bigger letters.
- the stats engine works the numbers out in the browser, from per-minute totals or, for periods under a minute, from the raw packets.
Challenges we ran into
- making all the moving parts work together. there's so much data needed for this project that made it difficult to keep everything realtime.
Accomplishments that we're proud of
- the beauty of the packets flowing from the computer across the world.
What we learned
- how inefficient packet routing is. the sheer volume of packets your computer sends out 24/7. all the logging and spying regular processes do on your computer.
What's next for upi [ ultimate packet inspector ]
- making it flag specific processes. taking all that packet and process data and making it better.

Log in or sign up for Devpost to join the conversation.