Inspiration
tbd
What it does
tbd
How we built it
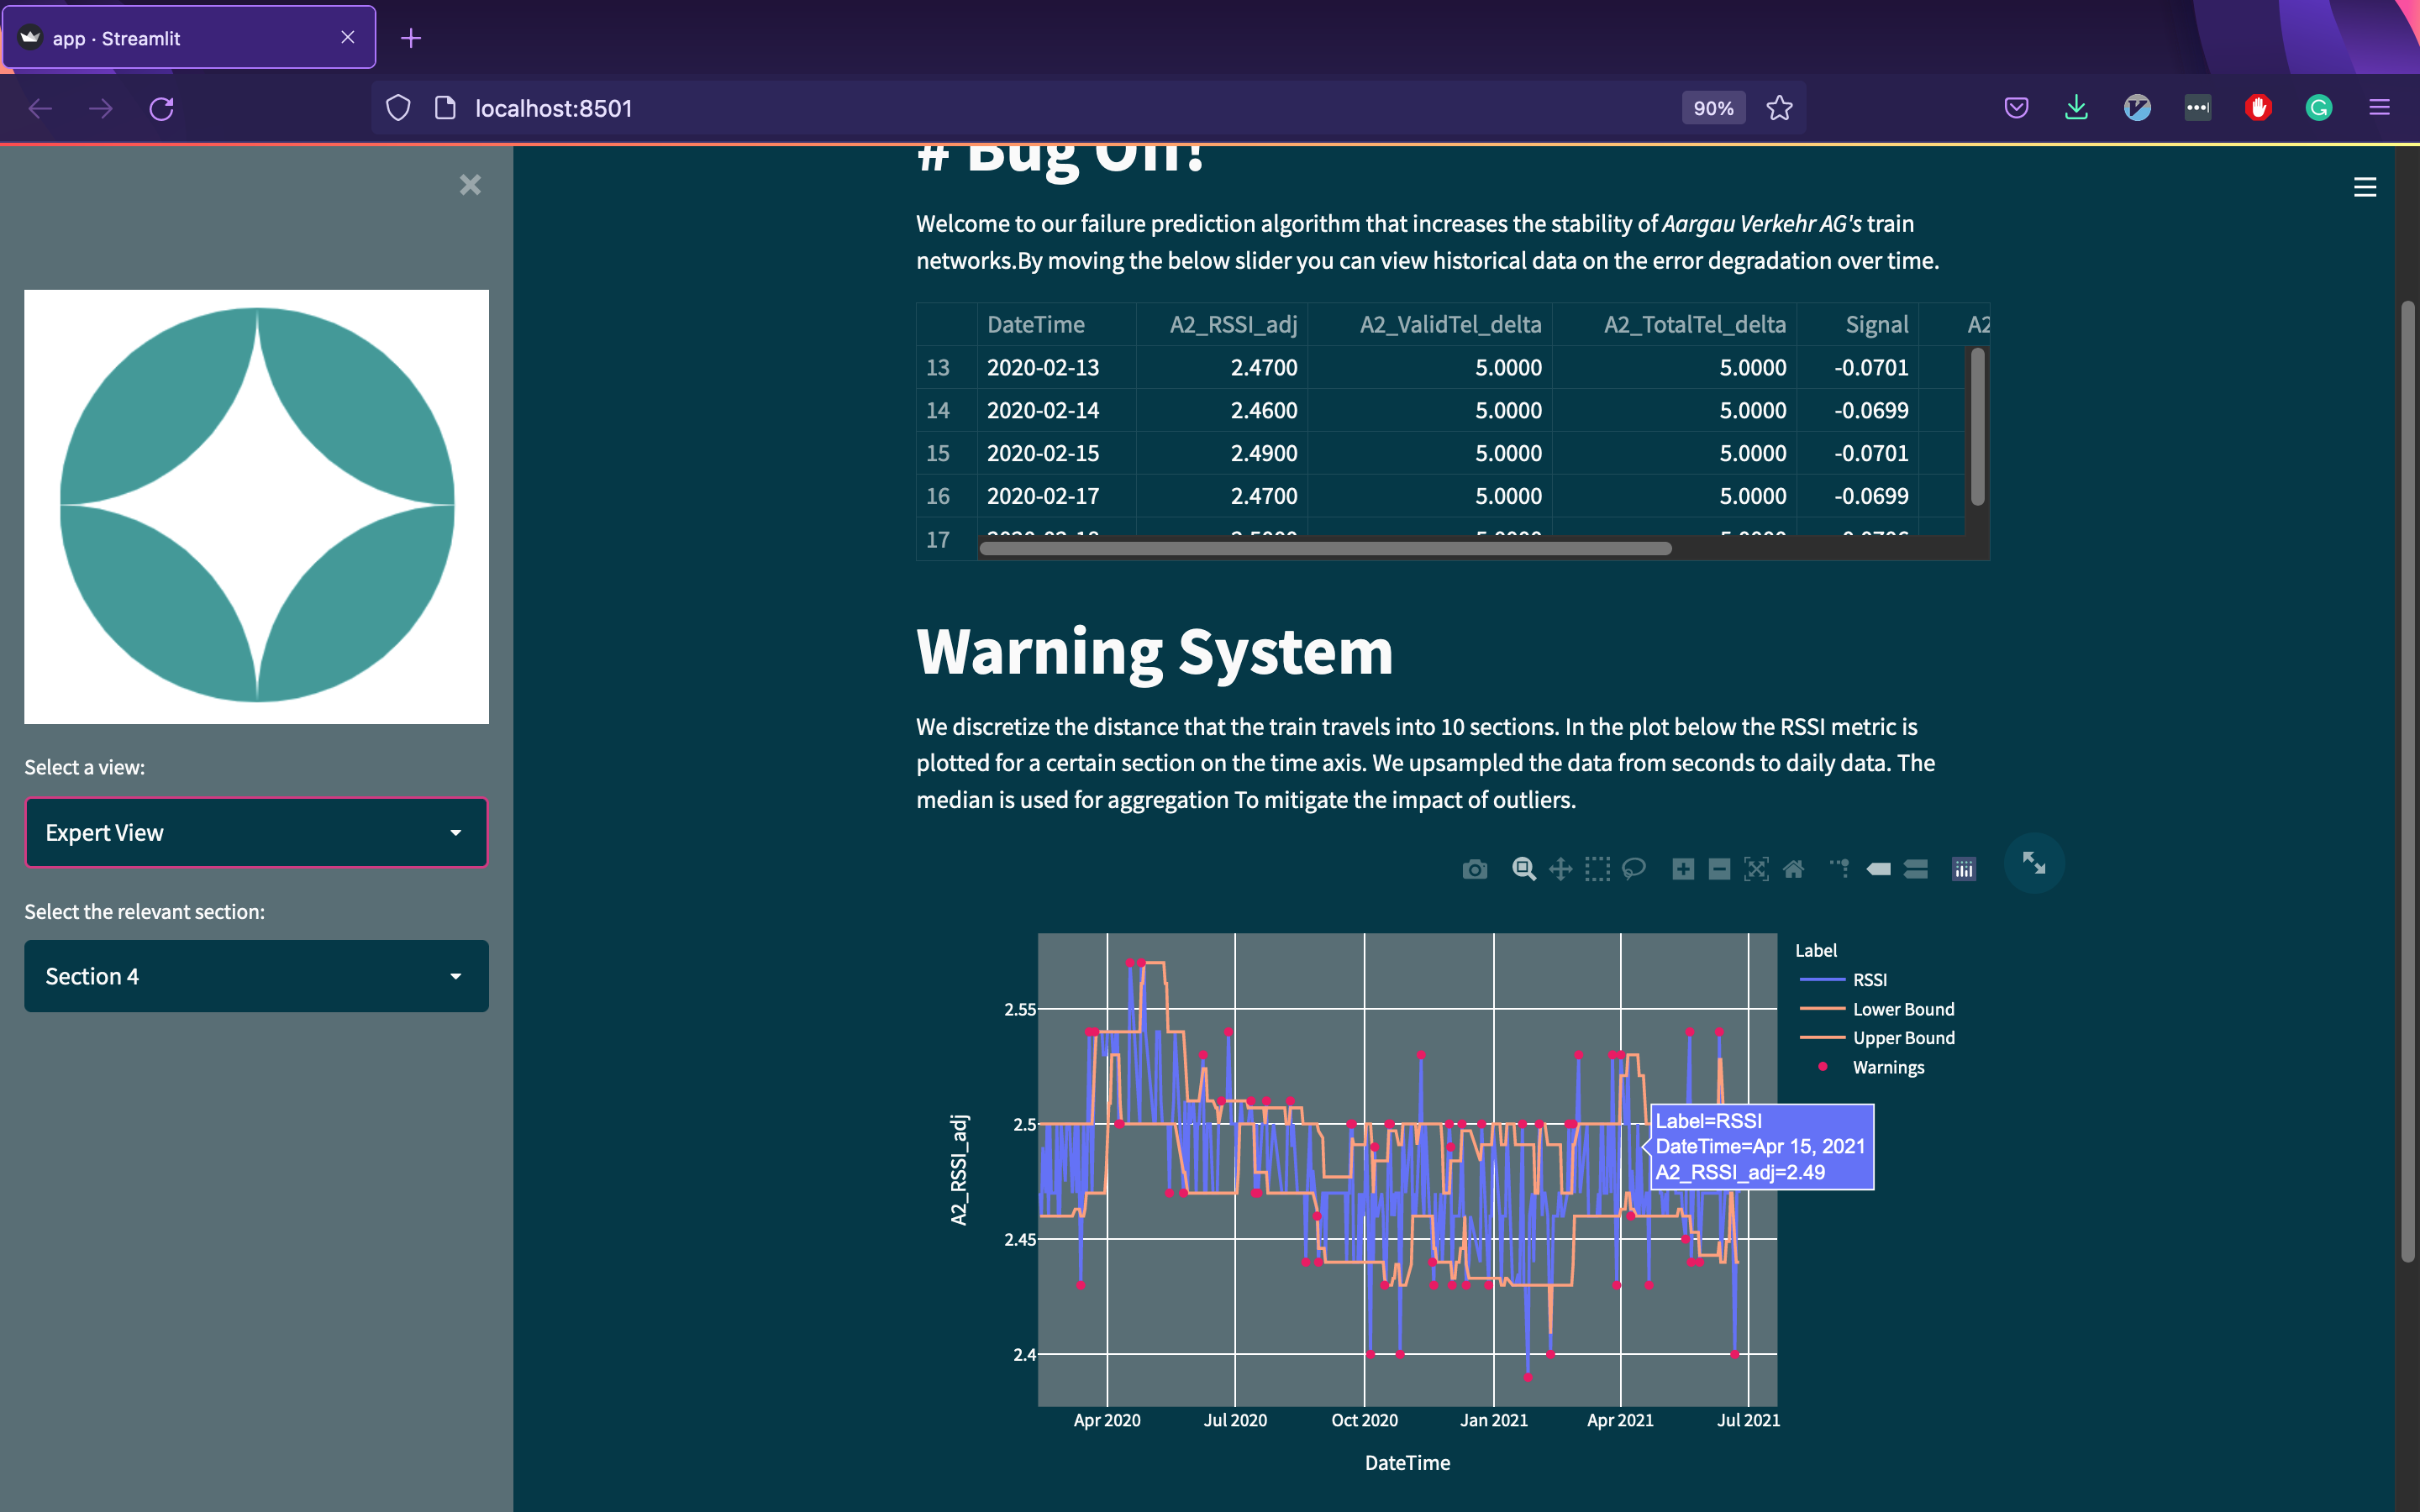
Here is our approach: Binning the track journey into 10 sections. For each section upsample the RSSI metric from seconds to daily data (for aggregation we used the median). Identifying lower and upper boundaries of the RSSI using the rolling 10th and 90th percentile (rolling window is 30 days)
Challenges we ran into
tbd
Accomplishments that we're proud of
tbd
What we learned
tbd
What's next for Bug Off
tbd
Built With
- pandas
- plotly
- python
- scikit-learn
- streamlit


Log in or sign up for Devpost to join the conversation.